
Articles
- Page Path
- HOME > Osong Public Health Res Perspect > Volume 13(2); 2022 > Article
-
Original Article
Epidemiological characteristics of varicella outbreaks in the Republic of Korea, 2016–2020 -
Eun-Young Kim1
 , Chungmin Park2, Gyehee Lee3, Suyeon Jeong4, Jeongsuk Song5, Dong-Han Lee6
 -
Osong Public Health and Research Perspectives 2022;13(2):133-141.
DOI: https://doi.org/10.24171/j.phrp.2022.0087
Published online: April 26, 2022
1Chungcheong Regional Center for Disease Control and Prevention, Daejeon, Korea
2Division of Risk Assessment, Bureau of Public Health Emergency Preparedness, Korea Disease Control and Prevention Agency, Cheongju, Korea
3Division of Infectious Disease Control, Bureau of Infectious Disease Policy, Korea Disease Control and Prevention Agency, Cheongju, Korea
4Ministry of Health and Welfare, Sejong, Korea
5Division of Healthcare Associated Infection Control, Bureau of Healthcare Safety and Immunization, Korea Disease Control and Prevention Agency, Cheongju, Korea
6Gyeongnam Regional Center for Disease Control and Prevention, Busan, Korea
- Corresponding author: Dong-Han Lee Gyeongnam Regional Center for Disease Control and Prevention, 1090 Jungang-daero,Yeonje-gu, Busan 47596, Korea E-mail: ldhmd@korea.kr
© 2022 Korea Disease Control and Prevention Agency.
This is an open access article under the CC BY-NC-ND license (http://creativecommons.org/licenses/by-nc-nd/4.0/).
Abstract
-
Objectives
- We described the trends and epidemiological characteristics of varicella outbreaks from 2016 to 2020 in the Republic of Korea.
-
Methods
- We investigated variables such as the outbreak setting, age of patients, vaccination status, and lesion count. The collected data were analyzed with the Cochrane-Armitage trend test and Kruskal-Wallis test. These statistical tests were performed using R ver. 4.0.3.
-
Results
- The number of varicella outbreaks increased from 2016 to 2018; however, after a slight decrease in the number of outbreaks in 2019, the number fell sharply in 2020. The median size of outbreaks decreased from 8 to 9 cases during 2016−2019 to 6 cases in 2020. The median duration of outbreaks was 18 days during 2016−2017, 28 days in 2018, 29 days in 2019, and 15 days in 2020. Varicella outbreaks occurred most frequently in elementary schools, and vaccination coverage of patients increased from 89.4% in 2016 to 97.2% in 2019. The median age of patients with outbreak-related varicella decreased from 8 years in 2016 to 6 years in 2020.
-
Conclusion
- Significant changes were observed in the age of patients with outbreak-related varicella. Ongoing monitoring of varicella outbreaks should be conducted. Further research will be needed to measure the disease burden of varicella and enable evidence-based policy decisions.
- Varicella usually occurs in children. It is a primary infection caused by varicella-zoster virus. This virus afflicts only human beings and causes acute infections. It is transmitted through direct contact with infected people. Moreover, the presence of this virus in respiratory secretions allows it to be transmitted through airborne channels. In most cases, the symptoms of varicella are relatively mild; however, complications such as secondary bacterial infections, pneumonia, and congenital varicella syndrome occur in some patients. The incubation period for varicella is 10 to 21 days, and the clinical symptoms of varicella usually occur 14 to 16 days after being exposed to the virus. Varicella is a highly infectious disease, and the chances of secondary infection are about 61% to 100% in susceptible people that come into contact with a patient in their household [1]. Patients cannot usually avoid contact with the source of the infection because varicella can spread before symptoms occur. Furthermore, it is not easy to implement preventive measures such as vaccination or immunoglobulin administration within 72 hours after the exposure, except for household members, since it takes quite a long time for a person exposed to the virus to be recognized.
- The Republic of Korea included varicella in the National Immunization Program (NIP) in 2005, designating it as a notifiable infectious disease for monitoring. Prior to that change, the government monitored the occurrence of varicella with the pediatric communicable diseases sentinel surveillance system. We expected that the NIP would reduce the incidence of varicella. However the number of varicella patients reported to the National Infectious Disease Surveillance System (NIDSS) continued to increase [2], which has been analyzed as being attributable to physicians’ heightened awareness and increased legal responsibility to recognize and report notifiable diseases [3]. Thereby, criticisms were raised about the effectiveness of varicella vaccines [4,5], but assessments of the exact effectiveness of vaccine policies are limited by the lack of incidence data prior to the launch of the NIP.
- After the NIP was launched in the United States of America (USA), there was a reduction in varicella outbreaks [6], and the effectiveness of vaccines has been reported [7]. Furthermore, since a high number of breakthrough varicella cases occurred after the 1-dose vaccination in children [8], a 2-dose varicella vaccination policy was adopted in 2007.
- Although varicella vaccines have not been included in the NIP of China, the country has recently recommended a single-dose varicella vaccine, investigated the varicella vaccination coverage, and conducted ongoing research on the development of varicella and the effectiveness of varicella vaccines [9,10].
- In preliminary studies, varicella outbreaks have been mostly reported in daycare centers, kindergartens, and schools. A study was conducted on varicella outbreaks in daycare centers in New Hampshire, USA [7]. Scientists found that breakthrough varicella is also transmissible, similar to wild-type varicella. They also reported that varicella developed in 28.5% of children in daycare centers; the efficacy of the vaccine was 44% in that study. It was found that the risk of vaccine failure increased after a long duration of time in patients who were vaccinated in a timely manner. Another study investigated outbreaks of varicella in kindergartens and elementary schools in Michigan, USA [11]. They reported that breakthrough infection was likely to occur in subjects after 4 years since vaccination. In Italy, a study was conducted on varicella outbreaks in kindergartens in 2009 [12]. They reported that the attack rates for unvaccinated and vaccinated children were 72.3% and 12.7%, respectively. Therefore, the overall vaccine efficacy was 82.4%.
- Preliminary studies on trends in varicella incidence in the Republic of Korea used data from the National Health Insurance Service (NHIS) and the NIDSS, including a study calculating the attack rates of varicella and herpes zoster based on NHIS data from 2003 to 2015 and researching the impact of varicella vaccination on varicella and herpes zoster considering demographic changes over time [13], a study assessing the age, period and birth cohort effects on varicella incidence using NIDSS data from 2006 to 2017 [14], and a study analyzing the NHIS data from 2011 to 2018 and the National Immunization Registry data of the Korea Disease Control and Prevention Agency (KDCA) with the aim of evaluating varicella incidence and vaccination [15].
- We described the trends and epidemiological characteristics of varicella outbreaks that were reported to the NIDSS during 2016−2020. An investigation of all outbreak-related cases was also conducted.
Introduction
- Study Design
- This is a case series of varicella outbreak-related patients reported to the KDCA from 2016 to 2020.
- Varicella Surveillance and Case Investigations
- Since varicella was designated as a notifiable infectious disease in July 2005, the Republic of Korea changed the way of monitoring varicella from the pediatric communicable diseases sentinel surveillance system to the mandatory surveillance system. According to Infections Disease Control and Prevention Act, physicians who have treated varicella patients must report them to the local public health centers within 24 hours. Furthermore, public health centers must report cases to the KDCA via municipal or provincial internet-based surveillance systems.
- According to the guidelines for preventable disease management and vaccines, if complications or deaths occur in varicella patients or varicella occurs in special groups, such as pregnant women or newborns, public health centers should conduct a case investigation within 3 days. If 2 or more children in daycare centers, kindergartens, and schools are infected in the same class within 3 weeks, or if at least 2 children are infected at an institution with a total number of people less than 20, those cases should be reported as an outbreak and go through a case investigation without delay. A case study document includes information on the following parameters: patients’ personal information, inclusion in high-risk groups, clinical symptoms and progress, visits to medical institutions, laboratory findings, vaccination history, investigation of sources of infection, and contact tracing [16].
- The results of varicella patients’ surveillance and case investigations are managed through an internet-based system (hereinafter referred to as the “Integrated System”).
- Data Collection
- We used the case investigation data of varicella patients registered in the Integrated System after being recognized as cases of outbreaks among all varicella patients reported to the NIDSS from 2016 to 2020.
- Definitions
- The variables related to group characteristics were as follows: outbreak settings, time of outbreak initiation, size of outbreaks, duration of outbreaks, percentage of people vaccinated, and the attack rate. The individual characteristics were as follows: the age of patients, the date of onset of disease symptoms, vaccination status, the date of vaccination, the interval between vaccination and incidence, and lesion count.
- The outbreak settings were classified into 4 categories: daycare centers, kindergartens, elementary schools, and others. The time of outbreak initiation was reported in terms of years and months based on the date of symptom onset of the index patient. The size of outbreaks was divided into 4 categories: 2 to 9 cases, 10 to 24 cases, 25 to 49 cases, and 50 or more cases. In cases that occurred within households, all secondary infections were epidemiologically linked to outbreaks and included in the case investigations. The duration of outbreaks was defined as the number of days between the index patient's date of symptom onset and that of the last patient. The percentage of vaccinated patients denoted the fraction of vaccinated patients in the group, being classified into 0%, 1% to 89%, 90% to 99%, and 100%. The total number of people in an institution was used as the denominator for the attack rate.
- Regarding the individual characteristics, patients’ age was classified into 6 groups: younger than 1 year old, 1 to 3 years old, 4 to 6 years old, 7 to 12 years old, 13 to 18 years old, and older than 19 years old. The vaccination status was classified into 3 categories (unvaccinated, 1 dose, and 2 doses). The interval between vaccination and occurrence was determined from the date of last vaccination to the date of symptom onset, and this interval was calculated in units of months. The lesion count was used as an indicator of disease severity. If the lesion count was less than 50, then the varicella infection was defined as mild; however, if it was more than 50, then the infection was moderate. The number of lesions was counted at the time when the patient was diagnosed with varicella. Vaccination history was obtained through internet-based records, baby journals, or patients’ and caregivers’ memories.
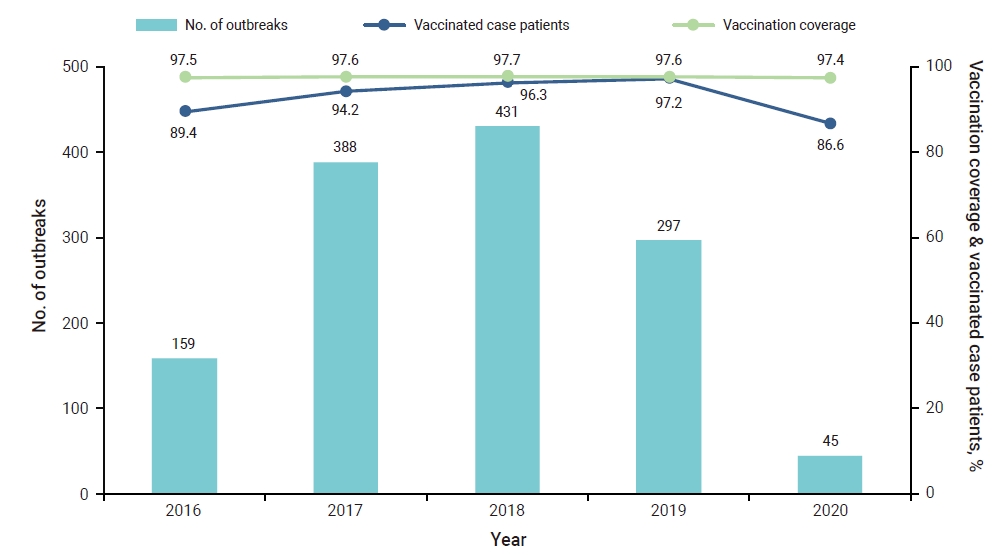
- The vaccination coverage presented in Figure 1, which refers to the percentage of children who completed the recommended 1-dose vaccination to prevent varicella, was calculated using birth cohort-based survey data on the vaccination rate [17−21].
- Statistical Analysis
- The collected data were entered into MS Excel (Microsoft Corp., Redmond, WA, USA), and the analysis was performed by using R ver. 4.0.3 (The R Foundation, Vienna, Austria; https://www.r-project.org/). We used the Cochrane-Armitage trend test and the Kruskal-Wallis test, with the level of statistical significance set at p<0.05.
- Ethics Statement
- The Institutional Review Board of the KDCA approved the protocol (IRB No. 2022-03-09-PE-A).
Materials and Methods
- In total, 344,917 varicella patients were reported from January 1, 2016 to December 31, 2020, of which 18,055 patients (5.2%) were identified as involved in outbreaks, and the total number of outbreaks was 1,302. The number of outbreak-related cases was 159 in 2016, 388 in 2017, 431 in 2018, 297 in 2019, and 45 in 2020. The highest number of cases was detected in 2018 (431 cases). The lowest number of cases was detected in 2020 (45 cases). The number of outbreak-related cases was likewise the highest in 2018 (6,642 cases), and the lowest number of outbreak-related cases was in 2020 (309 cases). Except for 2020, a tendency was observed for outbreak cases to increase from 2016 to 2019 (p<0.001) (Table 1).
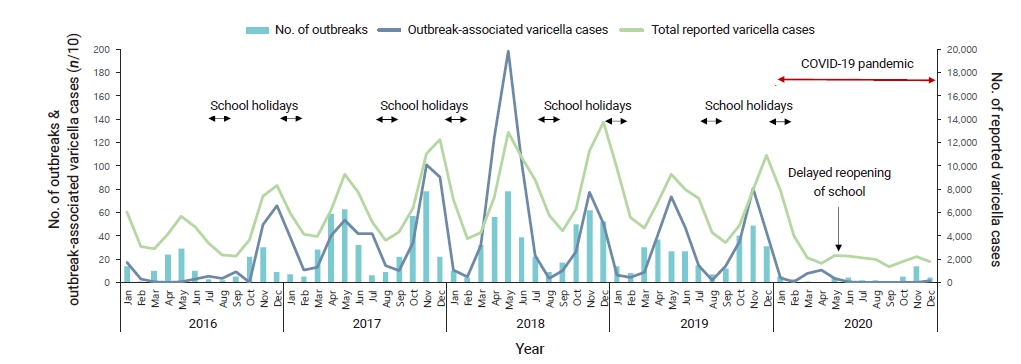
- The number of outbreaks was highest from April to May and October to November, and the number of outbreak-related cases peaked twice a year, in May and November (Figure 2).
- The median number of patients per outbreak per year decreased from 9 (range, 2−122) in 2018 to 6 (range, 2−19) in 2020 (p=0.021). From 2016 to 2019, ≥50% of outbreaks involved than 10 cases, whereas this held true for 80% of outbreaks in 2020. Approximately 5% of outbreaks each year had more than 50 cases. The median duration of outbreaks was 18 days in 2016 and 2017, 29 and 28 days in 2018 and 2019, and 15 days in 2020 (p<0.001) (Table 1).
- The proportion of varicella outbreaks in elementary schools decreased from 64.8% in 2016 to 24.4% in 2020 (p=0.004). The percentage of outbreaks in which all (100%) patients were vaccinated increased from 47.4% in 2016 to 60.8% in 2017, 74.2% in 2018, 78.3% in 2019, and 58.1% in 2020 (p<0.001). On the contrary, the number of outbreaks in which no (0%) patients were vaccinated also slightly increased from 1.5% in 2016 (2 outbreaks) to 0% in 2017, 0.9% in 2018 (4 outbreaks), 0.7% in 2019 (2 outbreaks) to 16.3% in 2020 (7 outbreaks) (p<0.001) (Table 1).
- In the past 5 years, the median age of patients involved in varicella outbreaks decreased from 8 years in 2016 to 6 years in 2020 (p<0.001). The distribution pattern of patients’ ages also changed (Table 2). In 2020, 9.7% of patients were 3 years old or younger, 43.0% were 4 to 6 years old, 33.3% were 7 to 12 years old, and 13.9% were 13 years old or older. The percentage of 4- to 6-year-old patients increased, and that of 7- to 12-year-old patients decreased (p<0.001) (Table 2).
- The percentage of vaccinated patients in outbreaks increased from 89.4% in 2016 to 97.2% in 2019, but decreased slightly to 86.6% in 2020 (Figure 1, Table 2). The proportion of vaccinated patients tended to increase in all age groups (p<0.001). The percentage of outbreak-related patients with fewer than 50 lesions was 84.0% in 2016 and 87.7% in 2020, showing no significant difference (p=0.280) (Table 2).
Results
- From 2016 to 2018, the number of varicella outbreaks increased, after which it slightly decreased in 2019 and then fell sharply in 2020, when the coronavirus disease 2019 (COVID-19) pandemic occurred. Lee et al. [22] analyzed NIDSS data from 2006 to 2018. In another study conducted by Lee et al. [14], the data were analyzed from 2006 to 2017. In these studies, the annual incidence of varicella was found to increase.
- In our study, the number of varicella outbreaks was highest from April to May and from October to November, and the number of outbreak-related cases peaked twice a year, in May and November. Similar patterns were observed in cases unrelated to outbreaks, but in winter, the peak tended to appear 1 month later than the peak of outbreaks. In the Republic of Korea, the school semester starts in early March and late August. Schools then have vacations in late July and late December. The incidence of varicella usually began to rise about a month after the start of the semester; it peaked during the semester and appeared to decline during vacations. A similar pattern was found in a related study conducted in Shanghai, China [9]. The researchers found that outbreaks peaked soon after the opening of school campuses but declined during vacations. An explanation for this is that children are close to each other in common spaces in schools.
- In our study, the size of the varicella outbreaks decreased from 8 to 9 cases per outbreak during 2016-2019 to 6 cases in 2020. Furthermore, the duration of varicella outbreaks changed at 2-year intervals: 18 days in 2016 and 2017, 28 days in 2018 and 29 days in 2019, and 15 days in 2020. Except for 2020, varicella outbreaks occurred most frequently in elementary schools, and most of the patients were in lower grades (grades 1 to 2), with their ages being 7 and 8. In the 7- to 12-year-old group of patients, the rate of vaccination increased from 74.9% in 2016 to 98.0% in 2019.
- In a study conducted in the USA that described the impact of varicella vaccination programs on the epidemiology of varicella outbreaks [23], the size of outbreaks decreased from 15 cases during 1995−1998 to 9 cases during 2002−2005. Moreover, the duration of outbreaks decreased from 44.5 days to 30 days. The proportion of varicella outbreaks that occurred in elementary schools increased, while that in childcare facilities decreased. The age of patients increased from 6 years to 9 years. After the implementation of the immunization policy, the rate of vaccination in patients increased from 1% to 46.3% within 10 years.
- In a recent study from the USA reporting the epidemiology of varicella outbreaks after a routine 2-dose varicella vaccination program [24], the size of outbreaks was 7 cases, the duration of outbreaks was 29 days, and the percentage of 1- to 9-year-old patients was 68%. Furthermore, 39% of outbreaks occurred in elementary schools, 18% in kindergartens, 42% in other locations, and 1% in unidentified places. The percentage of unvaccinated patients was 77%, while 62% of vaccinated patients had received 1 vaccine dose.
- In a study that investigated varicella outbreaks in schools in Shanghai, China [10], the average size of outbreaks was 12.5 cases, the average duration of outbreaks was 75.5 days, the average age of cases was 10.8 years, and the percentage of patients who had received 1 vaccine dose was 50.6%.
- Our study showed similar characteristics to those of varicella outbreaks in the USA, after a 1-dose varicella vaccination program [23]. After the introduction of a routine 2-dose varicella vaccination program in the USA, no significant changes were found in the size, duration, or setting of outbreaks; however, the number of varicella outbreaks and breakthrough cases decreased. This positive effect has implications for policy decisions.
- The median age of patients with outbreak-related varicella decreased from 8 years in 2016 to 6 years in 2020. The age distribution changed; the proportion of patients who were 4 to 6 years old increased, that of patients who were 7 to 12 years old decreased, and that of patients 19 years or older slightly increased. Further studies need to be carried out to understand age changes related to outbreaks.
- In recent outbreaks, varicella cases have mainly occurred among unvaccinated patients in the age group of 19 years old and older. This group of patients includes international students and foreign workers. Further investigations and policy reviews need to be conducted in order to prevent and manage infectious diseases in groups with poor vaccination rates and groups related to high-risk facilities.
- In the Republic of Korea, an increasing number of vaccinated patients in outbreaks was observed. These results are similar to prior reports of an increase in breakthrough infections after a 1-dose varicella vaccination program in studies conducted in the USA [23,25,26]. Recent epidemiological studies in the Republic of Korea have reported that the 1-dose varicella vaccine had a limited ability to suppress the incidence of varicella [13,15].
- Due to the COVID-19 pandemic in 2020, we strengthened measures for infection control, such as mask-wearing, hand sanitizer use, ventilation, and social distancing. The total incidence of varicella, including outbreaks, has decreased dramatically due to these measures. Thus, a different epidemiological pattern was observed in 2020.
- Because of the high vaccination rate, post-exposure vaccination is usually not performed in Korea. This is especially true while managing instances of varicella outbreaks. Instead, local public health centers restrict patients from going to school or work. They also monitor the symptom onset of contacts, thereby effectively introducing necessary containment measures. Nevertheless, outbreaks can still occur in schools due to breakthrough infections. In such cases, there are hardly any adequate interventional measures, making it difficult to prevent the spread of breakthrough infections. Therefore, scientific research studies must focus on developing effective and applicable prevention practices other than vaccination. These steps would help manage varicella, which is an infectious disease transmitted through the air.
- This study has some limitations. Firstly, the diagnosis of varicella is challenging, and in some cases it might be misclassified as a closely-related skin infection. In particular, physicians tend to over-diagnose varicella as they are legally compelled to recognize and report varicella patients to the governmental authorities. These factors would lead to an overestimation of varicella cases. Meanwhile, not all patients with varicella may visit medical institutions because varicella has relatively mild clinical symptoms in patients who have been vaccinated earlier. Vaccination history can be obtained from internet-based records, baby journals, and vaccinations that caregivers remember. In our study, we obtained vaccination history through internet-based records, baby journals, and patients’ or caregivers’ memories. However, the memory of patients and caregivers may be faulty. Patients have been administered various kinds of vaccines, which have been manufactured by domestic and foreign companies in Korea. To assess the control of breakthrough infections, we recommend asking vaccinated patients about the brand name of the vaccine; those data were not available in the registry.
- Despite these limitations, our study established important implications, as it analyzed the epidemiological characteristics of varicella in the Republic of Korea by applying research methods that have been used in other countries, including the USA.
Discussion
- This study described the trends and epidemiological characteristics of varicella outbreaks in the Republic of Korea. The number of outbreaks tended to increase from 2016 to 2019. The vaccination rate of outbreak-related patients increased across all age groups over the past 5 years. However, an increase in breakthrough infections was also observed during the same period. Although the size of outbreaks did not change, their duration increased. Varicella outbreaks occurred most frequently in elementary schools, and most patients were in the age group of 7 to 8 years. Their characteristics were similar to those of other related studies conducted in other countries. All these studies were conducted among patients who had received a single dose of the varicella vaccine.
- The age of patients with outbreak-related varicella changed; the median age decreased and the proportion of patients who were 4 to 6 years old increased. However, the proportion of patients aged 7 to 12 years decreased. Further research studies need to investigate changes in age groups. Ongoing monitoring and further research on outbreaks and breakthrough infections will be needed to measure the disease burden of varicella and enable evidence-based policy decisions.
Conclusion
-
Ethics Approval
The study protocol was approved by the Institutional Review Board of the Korea Disease Control and Prevention Agency (IRB No. 2022-03-09-PE-A). Informed consent was confirmed by the IRB.
-
Conflicts of Interest
The authors have no conflicts of interest to declare.
-
Funding
None.
-
Availability of Data
All data generated or analyzed during this study are included in this published article.
-
Authors’ Contributions
Conceptualization: DHL, JS; Data curation: EYK; Formal analysis: EYK; Investigation: SJ, CP, GL; Methodology: DHL, JS; Project administration: EYK; Resources: EYK; Visualization: CP, GL; Writing–original draft: EYK; Writing–review & editing: DHL, JS, SJ, CP, GL.
-
Additional Contributions
We thank all the local government infectious disease managers.
-
Disclaimer
The opinions expressed by authors contributing to this journal do not necessarily reflect the opinions of the Korea Disease Control and Prevention Agency or the institutions with which the authors are affiliated.
Article information
| Characteristic | 2016 | 2017 | 2018 | 2019 | 2020 | p for trend testa) |
|---|---|---|---|---|---|---|
| Total number of outbreaks | 159 | 388 | 431 | 297 | 45 | |
| Outbreak-related cases | ||||||
| Totalb) | 2,112 (3.9) | 5,249 (6.6) | 6,642 (6.9) | 3,743 (4.5) | 309 (1.0) | <0.001 |
| No. per outbreak | 8 (2−96) | 8 (2−161) | 9 (2−122) | 8 (2−96) | 6 (2−19) | 0.021c) |
| Outbreak size (case) | ||||||
| <10 | 93 (58.5) | 220 (56.7) | 228 (52.9) | 156 (52.5) | 36 (80.0) | 0.964 |
| 10−24 | 41 (25.8) | 114 (29.4) | 125 (29.0) | 102 (34.3) | 9 (20.0) | 0.283 |
| 25−49 | 19 (11.9) | 39 (10.1) | 55 (12.8) | 32 (10.8) | 0 (0) | 0.399 |
| ≥50 | 6 (3.8) | 15 (3.9) | 23 (5.3) | 7 (2.4) | 0 (0) | 0.291 |
| Outbreak setting | ||||||
| Daycare | 29 (18.2) | 70 (18.0) | 60 (13.9) | 51 (17.2) | 16 (35.6) | 0.499 |
| Preschool | 16 (10.1) | 50 (12.9) | 65 (15.1) | 41 (13.8) | 3 (6.7) | 0.569 |
| Elementary school | 103 (64.8) | 239 (61.6) | 270 (62.6) | 177 (59.6) | 11 (24.4) | 0.004 |
| Other | 11 (6.9) | 29 (7.5) | 36 (8.4) | 28 (9.4) | 15 (33.3) | 0.001 |
| Attack rate (%) | 3.0 (0.26−60.0) | 3.5 (0.23−53.3) | 3.1 (0.14−81.8) | 2.5 (0.13−81.8) | 6.9 (0.4−35.7) | 0.001c) |
| Duration of outbreak (d) | 18 (0−119) | 18 (0−125) | 29 (0−136) | 28 (0−143) | 15 (0−53) | 0.001c) |
| Proportion of vaccinated case (%) | ||||||
| 0 | 2 (1.5) | 0 (0) | 4 (0.9) | 2 (0.7) | 7 (16.3) | <0.001 |
| 1−89 | 51 (37.8) | 81 (23.0) | 46 (10.7) | 24 (8.1) | 9 (20.9) | <0.001 |
| 90−99 | 18 (13.3) | 57 (16.2) | 61 (14.2) | 38 (12.9) | 2 (4.7) | 0.172 |
| 100 | 64 (47.4) | 214 (60.8) | 319 (74.2) | 231 (78.3) | 25 (58.1) | <0.001 |
Data are presented as n (%) or median (range).
a) Determined by use of the Cochrane-Armitage trend test, unless otherwise specified.
b) The percentage listed is the proportion of outbreak-associated varicella cases among the total number of cases reported during that period.
c) The Kruskal-Wallis test was used to test for associations among the raw data rather than for trends over time.
| Characteristic | 2016 | 2017 | 2018 | 2019 | 2020 | p-value for trend testa) |
|---|---|---|---|---|---|---|
| Age of patients (y) | 8 (0−43) | 7 (0−42) | 8 (0−62) | 7 (1−45) | 6 (0−44) | <0.001 |
| Total patients, by age (y) | ||||||
| <1 | 1 (0.0) | 2 (0.0) | 4 (0.1) | 0 (0.0) | 3 (1.0) | 0.118 |
| 1−3 | 85 (4.0) | 239 (4.6) | 156 (2.3) | 77 (2.1) | 27 (8.7) | <0.001 |
| 4−6 | 420 (19.9) | 1,593 (30.3) | 1,819 (27.4) | 1,132 (30.2) | 133 (43.0) | <0.001 |
| 7−12 | 1,550 (73.4) | 3,235 (61.6) | 4,505 (67.8) | 2,401 (64.1) | 103 (33.3) | <0.001 |
| 13−18 | 45 (2.1) | 169 (3.2) | 134 (2.0) | 98 (2.6) | 17 (5.5) | 0.844 |
| ≥19 | 11 (0.5) | 11 (0.2) | 24 (0.4) | 35 (0.9) | 26 (8.4) | <0.001 |
| Time since vaccination (mo) | 83 (0−149) | 77 (0−444) | 80 (0−244) | 79 (0−250) | 64 (0−170) | <0.001b) |
| Vaccination status (n=17,360) | ||||||
| Unvaccinated | 192 (10.6) | 282 (5.8) | 248 (3.7) | 103 (2.8) | 39 (13.4) | <0.001 |
| 1 dose | 1,583 (87.0) | 4,404 (90.0) | 5,920 (89.2) | 3,331 (89.6) | 237 (81.2) | 0.921 |
| 2 doses | 44 (2.4) | 207 (4.2) | 469 (7.1) | 285 (7.6) | 16 (5.4) | <0.001 |
| Vaccinated patients, by age (y) (n=16,496)c) | ||||||
| 1−3 | 78 (90.7) | 217 (90.0) | 153 (95.6) | 70 (90.9) | 22 (77.3) | 0.271 |
| 4−6 | 385 (91.7) | 1,467 (92.1) | 1,809 (99.5) | 1,120 (98.9) | 127 (95.5) | <0.001 |
| 7−12 | 1,161 (74.9) | 2,880 (89.0) | 4,352 (96.6) | 2,352 (98.0) | 88 (85.4) | <0.001 |
| 13−18 | 3 (6.7) | 44 (26.0) | 73 (54.5) | 72 (73.5) | 15 (88.2) | <0.001 |
| ≥19 | 0 (0.0) | 3 (27.3) | 2 (8.3) | 2 (5.7) | 1 (3.8) | 0.371 |
| Lesion count (case) | ||||||
| <50 | 1,775 (84.0) | 4,396 (83.7) | 5,735 (86.3) | 3,123 (83.4) | 271 (87.7) | 0.280 |
| ≥50 | 337 (16.0) | 853 (16.3) | 907 (13.7) | 620 (16.6) | 38 (12.3) | 0.280 |
Data are presented as median (range) or n (%).
a) Determined by use of the Cochrane-Armitage trend test, unless otherwise specified.
b) The Kruskal-Wallis test was used to test for associations among the raw data rather than for trends over time.
c) The percentage listed is the proportion of vaccinated patients among the total patients during that period.
- 1. Lopez A, Leung J, Schmid S, et al. Varicella [Internet]. In: Centers for Disease Control and Prevention (CDC). Manual for the surveillance of vaccine-preventable diseases. Atlanta: CDC; 2018 [cited 2022 Apr 5]. Available from: https://www.cdc.gov/vaccines/pubs/surv-manual/chpt17-varicella.pdf.
- 2. Korea Disease Control and Prevention Agency (KDCA). Infectious diseases surveillance yearbook, 2020. Cheongju: KDCA; 2021. Korean.
- 3. Chun BC. Public policy and laws on infectious disease control in Korea: past, present and prospective. Infect Chemother 2011;43:474−4. Korean.Article
- 4. Lee YH, Choe YJ, Cho SI, et al. Effectiveness of Varicella Vaccination Program in Preventing Laboratory-Confirmed Cases in Children in Seoul, Korea. J Korean Med Sci 2016;31:1897−901.ArticlePubMedPMC
- 5. Oh SH, Choi EH, Shin SH, et al. Varicella and varicella vaccination in South Korea. Clin Vaccine Immunol 2014;21:762−8.ArticlePubMedPMC
- 6. Seward JF, Watson BM, Peterson CL, et al. Varicella disease after introduction of varicella vaccine in the United States, 1995-2000. JAMA 2002;287:606−11.ArticlePubMed
- 7. Galil K, Lee B, Strine T, et al. Outbreak of varicella at a day-care center despite vaccination. N Engl J Med 2002;347:1909−5.ArticlePubMed
- 8. Lee BR, Feaver SL, Miller CA, et al. An elementary school outbreak of varicella attributed to vaccine failure: policy implications. J Infect Dis 2004;190:477−83.ArticlePubMed
- 9. Zhu YF, Li YF, Du Y, et al. Epidemiological characteristics of breakthrough varicella infection during varicella outbreaks in Shanghai, 2008-2014. Epidemiol Infect 2017;145:2129−36.ArticlePubMedPMC
- 10. Wu QS, Wang X, Liu JY, et al. Varicella outbreak trends in school settings during the voluntary single-dose vaccine era from 2006 to 2017 in Shanghai, China. Int J Infect Dis 2019;89:72−8.ArticlePubMed
- 11. Centers for Disease Control and Prevention (CDC). Outbreak of varicella among vaccinated children--Michigan, 2003. MMWR Morb Mortal Wkly Rep 2004;53:389−92.PubMed
- 12. Tafuri S, Martinelli D, De Palma M, et al. Report of varicella outbreak in a low vaccination coverage group of otherwise healthy children in Italy: the role of breakthrough and the need of a second dose of vaccine. Vaccine 2010;28:1594−7.ArticlePubMed
- 13. Choi JK, Park SH, Park S, et al. Trends in varicella and herpes zoster epidemiology before and after the implementation of universal one-dose varicella vaccination over one decade in South Korea, 2003-2015. Hum Vaccin Immunother 2019;15:2554−60.ArticlePubMedPMC
- 14. Lee YH, Choe YJ, Cho SI, et al. Increasing varicella incidence rates among children in the Republic of Korea: an age-period-cohort analysis. Epidemiol Infect 2019;147:e245.ArticlePubMedPMC
- 15. Hong K, Sohn S, Choe YJ, et al. Waning effectiveness of one-dose universal varicella vaccination in Korea, 2011-2018: a propensity score matched national population cohort. J Korean Med Sci 2021;36:e222.ArticlePubMedPMC
- 16. Korea Centers for Disease Control and Prevention (KCDC). Management guidelines for vaccine preventable disease. Cheongju: KCDC; 2020. Korean.
- 17. Korea Centers for Disease Control and Prevention (KCDC). National childhood vaccination coverage among children aged 3 years in Korea, 2016. Cheongju: KCDC; 2017. Korean.
- 18. Korea Centers for Disease Control and Prevention (KCDC). National childhood vaccination coverage among children aged 1-3 years in Korea, 2017. Cheongju: KCDC; 2018. Korean.
- 19. Korea Centers for Disease Control and Prevention (KCDC). National childhood vaccination coverage among children aged 1-3 and 6 years in Korea, 2018. Cheongju: KCDC; 2019. Korean.
- 20. Korea Centers for Disease Control and Prevention (KCDC). National childhood vaccination coverage among children aged 1-3 and 6 years in Korea, 2019. Cheongju: KCDC; 2020. Korean.
- 21. Korea Disease Control and Prevention Agency (KDCA). National childhood vaccination coverage among children Aged 1-3 and 6 years in Korea, 2020. Cheongju: KCDC; 2021. Korean.
- 22. Lee YH, Choe YJ, Hwang SS, et al. Spatiotemporal distribution of varicella in the Republic of Korea. J Med Virol 2022;94:703−12.ArticlePubMed
- 23. Civen R, Lopez AS, Zhang J, et al. Varicella outbreak epidemiology in an active surveillance site, 1995-2005. J Infect Dis 2008;197 Supplement 2:S114−9.Article
- 24. Lopez AS, Leung J, Marin M. Varicella outbreak surveillance in the United States, 2015-2016. Open Forum Infect Dis 2017;4(Suppl 1). S461. Article
- 25. Grose C. Varicella vaccination of children in the United States: assessment after the first decade 1995-2005. J Clin Virol 2005;33:89−95.ArticlePubMed
- 26. Tugwell BD, Lee LE, Gillette H, et al. Chickenpox outbreak in a highly vaccinated school population. Pediatrics 2004;113:455−9.ArticlePubMed
References
Figure & Data
References
Citations
- The Protective Effectiveness of 2-Dose Varicella Vaccination in Children in Korea: A Case-control Study
Young Hwa Lee, Young June Choe, Kwan Hong, Yoonsun Yoon, Yun-Kyung Kim
Pediatric Infectious Disease Journal.2023; 42(8): 719. CrossRef - Epidemiological Characteristics of Varicella Outbreaks — China, 2006–2022
Miaomiao Wang, Xudong Li, Meiying You, Yuanyuan Wang, Xinyu Liu, Zihan Li, Wenjia Zhao, Zhuojun Jiang, Yuehua Hu, Dapeng Yin
China CDC Weekly.2023; 5(52): 1161. CrossRef
 PubReader
 Cite
Cite- Figure
-


- Related articles
-
- Epidemiological characteristics of carbapenemase-producing Enterobacteriaceae outbreaks in the Republic of Korea between 2017 and 2022
- Trends of legionellosis reported in Jeju Province, Republic of Korea, 2015–2022
- Vaccine effectiveness and the epidemiological characteristics of a COVID-19 outbreak in a tertiary hospital in Republic of Korea
