Skip to contents Skip to Global Navigation Menu
  • KDCA
  • Contact us
  • E-Submission

PHRP : Osong Public Health and Research Perspectives

OPEN ACCESS. pISSN: 2210-9099. eISSN: 2233-6052
Review Article

Prevalence and genotype diversity of rotavirus A in humans, animals, and environmental water samples in West Africa: a systematic review and meta-analysis


Published online: September 3, 2026

1Environment, Climate, Health, Engineering and Sustainable Development Laboratory, Peleforo Gon Coulibaly University, Korhogo, Côte d’Ivoire

2Department of Science and Technology, École Normale Supérieure, Abidjan, Côte d’Ivoire

3Department of Biochemistry and Genetics, Peleforo Gon Coulibaly University, Korhogo, Côte d’Ivoire

4Institut Pasteur, Abidjan, Côte d’Ivoire

5Laboratory of Animal Biology and Cytology, Training and Research Unit of Nature Sciences, Nangui Abrogoua University, Abidjan, Côte d’Ivoire

Corresponding author: Jacques Danho Monney Environment, Climate, Health, Engineering and Sustainable Development Laboratory, Peleforo Gon Coulibaly University, P.O. Box 1328 Korhogo, Côte d’Ivoire E-mail: monneyjacques@yahoo.fr
• Received: April 10, 2026   • Revised: July 14, 2026   • Accepted: July 21, 2026

© 2026 Korea Disease Control and Prevention Agency.

This is an open access article under the CC BY-NC-ND license (http://creativecommons.org/licenses/by-nc-nd/4.0/).

  • 760 Views
  • 29 Download
  • Objectives
    To systematically review and meta-analyze the prevalence and genetic diversity of rotavirus A (RVA) in humans, animals, and environmental water samples in West Africa and to describe its geographic distribution and circulation patterns.
  • Methods
    PubMed, Scopus, Web of Science, African Journals Online, ScienceDirect, SpringerLink, JSTOR, clinical trial registries, and global health libraries were searched for observational studies published from January 1, 2010, to December 20, 2025, reporting molecular RVA genotyping data from West Africa. Two reviewers independently screened studies, extracted data, assessed risk of bias using the Joanna Briggs Institute and SYRCLE tools, and summarized genotype distributions narratively. Random-effects meta-analyses were used to estimate pooled prevalence by source category.
  • Results
    Fifty-four studies were included, comprising 21,532 samples and 2,080 RVA-positive cases. The overall pooled prevalence was 12.6% (95% confidence interval [CI], 9.9%–15.6%). Prevalence was highest in animals (19.77%; 95% CI, 5.4%–40.1%), followed by environmental water samples (14.81%; 95% CI, 3.5%–31.1%) and humans (11.37%; 95% CI, 9.0%–14.0%). Overall heterogeneity was very high (I²=97.1%). In human studies, G1P[8], G9P[8], and G2P[4] were among the most frequently detected and geographically widespread genotype combinations.
  • Conclusion
    RVA circulates widely in humans, animals, and environmental water samples across West Africa, although evidence is characterized by substantial heterogeneity, uneven geographic representation, and limited animal and environmental water data. These findings support integrated One Health surveillance, monitoring for genotype shifts, and stronger water, sanitation, and hygiene interventions.
Rotavirus A (RVA) is a leading cause of acute gastroenteritis in young children worldwide and an important enteric pathogen in animals. It causes substantial morbidity and mortality, particularly in low- and middle-income countries [1,2]. Recent estimates indicate that rotavirus gastroenteritis accounts for millions of outpatient visits and approximately 2 million hospitalizations each year among children younger than 5 years [3]. Although disease burden has declined after vaccine introduction, rotavirus remains a major contributor to diarrheal mortality, causing an estimated 100,000 to 150,000 deaths annually among children younger than 5 years worldwide [4]. In domestic animals, gastroenteritis affects 10% to 80% of animals depending on farming practices, with mortality ranging from 1.5% to 50% and substantial economic consequences [5]. RVA is a nonenveloped virus with an 11-segmented double-stranded RNA genome and belongs to the family Sedoreoviridae. It is commonly classified by the outer capsid proteins VP7 (G genotype) and VP4 (P genotype), reflecting its extensive genetic diversity. To date, at least 42 G genotypes and 58 P genotypes have been identified [6,7].
In Africa, RVA genotype distribution is highly heterogeneous and often differs from patterns reported in other regions. Socioeconomic conditions, sanitation, healthcare access, and vaccine implementation may influence genotype circulation [8]. A recent review of African data reported that genotypes G1, G2, G3, G9, P[8], P[6], and P[4] predominated, with G1P[8] as the most frequently detected genotype combination [9]. In West Africa, historical surveillance among children showed that G1, G2, G3, and G9 accounted for more than 70% of typed strains during the prevaccine period [10]. However, most available West African studies have focused on human infections, particularly among hospitalized children, whereas evidence from animals and environmental water samples remains limited. RVA detection in domestic and wild animals, wastewater, surface water, and other environmental water samples is therefore relevant to public health within a One Health framework [5,11]. For example, co-surveillance studies conducted outside West Africa have shown considerable genotype diversity in domestic animals living near humans, suggesting possible interspecies transmission [12]. Similarly, recent evidence has documented RVA in environmental water samples, especially untreated water sources, underscoring the potential importance of waterborne exposure and environmental contamination [11]. In West Africa, where humans, animals, and shared environments frequently interact, understanding RVA diversity across human, animal, and environmental water sources has important implications for vaccine monitoring, possible interspecies transmission, and environmental contamination [13].
Comprehensive and up-to-date evidence integrating human, animal, and environmental water data from West Africa remains limited. Therefore, this systematic review and meta-analysis synthesized available evidence on the prevalence and genotype diversity of RVA in humans, animals, and environmental water samples and described its geographic distribution and circulation patterns in the subregion.
The review followed the Preferred Reporting Items for Systematic Reviews and Meta-Analyses (PRISMA) guidelines and Cochrane Collaboration recommendations [14,15]. The protocol was registered in the International Prospective Register of Systematic Reviews (PROSPERO; CRD420251207397) and is available at https://www.crd.york.ac.uk/PROSPERO/view/CRD420251207397.
Geographic Scope
For this review, West Africa was defined as the westernmost subregion of the African continent, extending from the Atlantic coast and Gulf of Guinea to the Sahelian belt and bounded to the north by the Sahara region. The study area included Benin, Burkina Faso, Cabo Verde, Côte d’Ivoire, Gambia, Ghana, Guinea, Guinea-Bissau, Liberia, Mali, Mauritania, Niger, Nigeria, Senegal, Sierra Leone, and Togo. Studies were eligible when they were conducted in at least 1 of these countries.
Eligibility Criteria
The eligibility criteria were defined using the CoCoPop framework (condition, context, and population), which is appropriate for prevalence reviews [16]. The condition of interest was RVA infection, including genotype-specific prevalence and genotype diversity. The context was West Africa. The populations of interest included humans, domestic and wild animals, and environmental water samples. Eligible studies were observational studies, including cross-sectional, cohort, prospective, retrospective, and multicenter studies conducted in West Africa and published from January 1, 2010, to December 20, 2025. Studies were required to report RVA genotype-specific prevalence and genotype diversity data generated using molecular methods, including polymerase chain reaction (PCR) and/or sequencing, in at least 1 target source category. No language restriction was applied. Studies were excluded if they were conducted outside West Africa; lacked molecular RVA genotyping data; reported only overall RVA prevalence without molecular genotype data; focused on non-group A rotaviruses; were case reports, non-peer-reviewed reports, or experimental studies using in vitro, ex vivo, or in silico models; or had a sample size of fewer than 10. For synthesis, studies were grouped into 3 source categories: human, animal, and environmental water. Domestic and wild animal studies were combined into a single animal category for meta-analysis.
Information Sources
PubMed, Scopus, Web of Science, African Journals Online (AJOL), ScienceDirect, SpringerLink, and JSTOR were searched for eligible studies. Additional sources included clinical trial registries, such as ClinicalTrials.gov, the World Health Organization Global Health Library, African Index Medicus, and the reference lists of relevant articles. All sources were last consulted on December 20, 2025.
Search Strategy
A comprehensive search strategy was developed using controlled vocabulary terms, including Medical Subject Headings (MeSH) in PubMed, and free-text keywords related to RVA, genotypes, genetic diversity, acute gastroenteritis, diarrhea, humans, animals, environmental water samples, and West Africa. The strategy was adapted to the syntax of each source, and terms were combined using the Boolean operators AND and OR. Searches were conducted in PubMed, Scopus, Web of Science, AJOL, ScienceDirect, SpringerLink, JSTOR, ClinicalTrials.gov, the World Health Organization Global Health Library, and African Index Medicus. The search was restricted to records published from January 1, 2010, to December 20, 2025. No language restriction was applied at the search stage. The review team screened and extracted data from articles published in English and French. When records in other languages were identified, titles, abstracts, and, when necessary, full texts were assessed using translation support; key eligibility, methodological, and outcome data were cross-checked by 2 reviewers before inclusion or exclusion. Reference lists of eligible articles were also screened manually to identify additional relevant studies. The full search strategies for all databases, registers, and websites, including source-specific syntax and limits, are provided in Tables S1 and S2.
Selection Process
Records identified through database searches were imported into Zotero ver. 7.0.24 (Corporation for Digital Scholarship), and duplicate records were removed. Two reviewers independently screened titles and abstracts to exclude irrelevant records. The same 2 reviewers then retrieved the full texts of potentially eligible studies and independently assessed them against the predefined eligibility criteria. Disagreements were resolved through discussion, and a third reviewer was consulted when necessary to reach consensus. No automation tools were used in the study selection process.
Data Collection Process
Data from each eligible study were extracted from full-text articles into a standardized Microsoft Excel database (Microsoft Corp.). Two reviewers independently performed data extraction, and discrepancies were resolved through discussion; a third reviewer was consulted when consensus could not otherwise be reached. Each included study was assigned a unique identification number to ensure traceability. When relevant data were not reported directly in the text, they were extracted from tables, figures, or graphical displays when possible. No automation tools were used in the data collection process, and study investigators were not contacted to obtain or confirm additional data.
Data Items
The primary outcomes of interest were RVA prevalence and the distribution of RVA genotypes, including G types, P types, and G/P genotype combinations, across the included source categories. For each eligible study, all reported results compatible with these outcome domains were sought and extracted when available. Additional variables extracted from each study included article title, authors, year of publication, study period, study design, country, source category, study population, sample size, study setting, sampling strategy, specimen type, and molecular genotyping method, including PCR and/or sequencing. Data on individual genotypes and genotype combinations were also extracted. When studies reported data separately by source category, country, or subgroup, these results were extracted separately whenever possible. When relevant information was missing, unclear, or not explicitly reported in the text, data were extracted from tables, figures, or supplementary materials when feasible. If information could not be clearly determined, it was recorded as not reported and was not imputed. For quantitative synthesis, domestic and wild animals were grouped into a single animal category.
Study Risk-of-Bias Assessment
Risk of bias in human studies was assessed using the Joanna Briggs Institute (JBI) Critical Appraisal Checklist for studies reporting prevalence data, which includes 9 items [17]. Animal and environmental water studies were assessed using the SYRCLE risk-of-bias tool, which includes 10 items [18]. Two reviewers independently assessed each study, and disagreements were resolved through discussion with a third reviewer when necessary. For this review, a manuscript-specific operational classification was used to summarize appraisal results. Under this classification, JBI assessments were categorized as A (low risk) for scores of 7–9, B (moderate risk) for scores of 4–6, and C (high risk) for scores of 0–3. SYRCLE assessments were categorized as A (low risk) for scores of 8–10, B (moderate risk) for scores of 5–7, and C (high risk) for scores of 0–4. This A/B/C classification was used as an operational framework to facilitate interpretation and reporting; it was not a native classification prescribed by the original tools. Because the 2 tools differ in scope and structure, risk-of-bias judgments were interpreted separately and were not directly compared across study types. No automation tools were used.
Effect Measures
For the main outcomes, the effect measure was the proportion of RVA-positive cases among all tested samples, reported with 95% confidence intervals (CIs). For genotype-specific analyses, the effect measure was the proportion of each RVA genotype, including G types, P types, and G/P genotype combinations, among all tested samples; these estimates were also reported with 95% CIs. Pooled prevalence estimates were generated using random-effects meta-analysis.
Synthesis Methods
Studies were grouped by source category (human, animal, and environmental water) and outcome type (overall RVA prevalence and genotype-specific prevalence). Domestic and wild animals were combined into a single animal category. Studies were included in each synthesis when they reported the number of RVA-positive cases and the total number of samples tested for overall prevalence analyses, or the number of cases positive for a given genotype and the total number of samples tested for genotype-specific analyses. Data preparation consisted of extracting the number of positive cases and the total sample size from each study. Data that could not be clearly determined were treated as not reported and were not imputed. No missing data requiring imputation were identified for the variables included in the analyses. Statistical analyses were performed in R ver. 4.4.3 (The R Foundation for Statistical Computing) within the RStudio environment [19]. For the main meta-analyses, pooled prevalence estimates and 95% CIs were calculated using the metaprop function in the meta package under a random-effects model, with between-study variance estimated by the DerSimonian-Laird method. Forest plots displayed individual study estimates and pooled estimates [14,20]. Genotype-specific syntheses were also performed for individual G types, P types, and G/P genotype combinations. Heterogeneity was assessed using the I² statistic and Cochran’s Q test. Potential sources of heterogeneity were explored through subgroup analyses according to study design, study duration, sample size, and country. Source category was evaluated separately in the primary stratified meta-analysis. For subgroup analyses, study duration was categorized as ≤2 years, 3–5 years, or >5 years, whereas sample size was categorized as <100, 100–299, or ≥300 samples. Subgroup analyses were conducted using metaprop with a random-intercept logistic regression model, logit transformation, and maximum-likelihood estimation of τ². Differences between subgroups were assessed using the subgroup-difference test integrated within the meta-analysis model [21,22]. Geographic maps were produced to visualize the spatial distribution of dominant RVA genotype combinations across West African countries. Sensitivity analyses were conducted to assess the robustness of the overall pooled RVA prevalence estimate. Using the same random-effects meta-analysis approach, the primary analysis was repeated after studies classified as having high risk of bias were excluded and after studies with fewer than 100 samples were excluded. In addition, a leave-one-out influence analysis was performed by sequentially removing 1 study at a time to determine whether any single study disproportionately influenced the pooled estimate. Sensitivity analyses were not performed for the environmental water source category because only 1 study contributed data to that category.
Reporting Bias Assessment
Risk of bias due to missing results in the synthesis was assessed using funnel plots and Egger’s regression test. Funnel plots were visually inspected for asymmetry, and Egger’s test was used to evaluate possible small-study effects and potential reporting bias [23,24].
Certainty Assessment
No formal certainty-of-evidence assessment, such as Grading of Recommendations Assessment, Development, and Evaluation (GRADE), was performed for the assessed outcomes.
Study Selection Results
The study selection process is presented in the PRISMA 2020 flow diagram (Figure 1). A total of 682 records were identified through database searches. No additional records were identified through other sources. After 79 duplicate records were removed, 603 records were screened by title and abstract, and 432 were excluded. A total of 171 reports were sought for retrieval; 169 were assessed for eligibility because 2 reports could not be retrieved. Of the 169 reports assessed for eligibility, 115 were excluded for the following reasons: no RVA genotyping data (n=62), sample size <10 (n=7), inappropriate detection method for RVA genotyping (n=10), study conducted outside West Africa (n=34), and non-group A rotavirus (n=2). Ultimately, 54 studies met the inclusion criteria and were included in the systematic review and meta-analysis. Excluded full-text reports and the primary reasons for exclusion are provided in Table S3.
Study Characteristics
The characteristics of the 54 included studies are summarized in Table 1 [10,25–77]. Overall, eligible studies were conducted across West Africa, with Nigeria contributing the largest number of studies (18/54), including 16 human studies and 2 ruminant studies. Ghana contributed 15 studies, comprising 13 human studies, 1 pig study, and 1 environmental water study. Burkina Faso contributed 6 studies, including 5 human studies and 1 poultry study. Côte d’Ivoire contributed 4 studies, including 3 human studies and 1 ruminant study, whereas Togo contributed 3 studies, all involving humans. Mali and Senegal each contributed 2 human studies. Benin, Gambia, Niger, and Sierra Leone each contributed 1 human study. No eligible studies were identified from Mauritania, Liberia, Guinea, Guinea-Bissau, or Cabo Verde. The included studies covered diverse populations and sample sources. Human studies mostly involved children younger than 5 years and included outpatient, hospitalized, or community-based participants. Animal studies primarily involved domestic or wild animals, especially neonates or juveniles. The environmental water study assessed wastewater and/or surface water samples for RVA genotype detection. Some studies contributed data from more than 1 source category; when human and animal samples were reported separately within the same study, these data were extracted separately.
Risk of Bias in Studies
Risk-of-bias assessments for the included studies are summarized in Table 2. Overall, 21 studies were classified as category A (low risk of bias), 25 as category B (moderate risk of bias), and 8 as category C (high risk of bias) according to the manuscript-specific operational classification applied in this review. Most studies had low to moderate risk of bias. The main concerns involved sample representativeness, insufficiently described sampling procedures, limited sample-size justification, and incomplete methodological reporting. The environmental water study was classified as having high risk of bias.
Individual RVA Prevalence Estimates across Study Categories
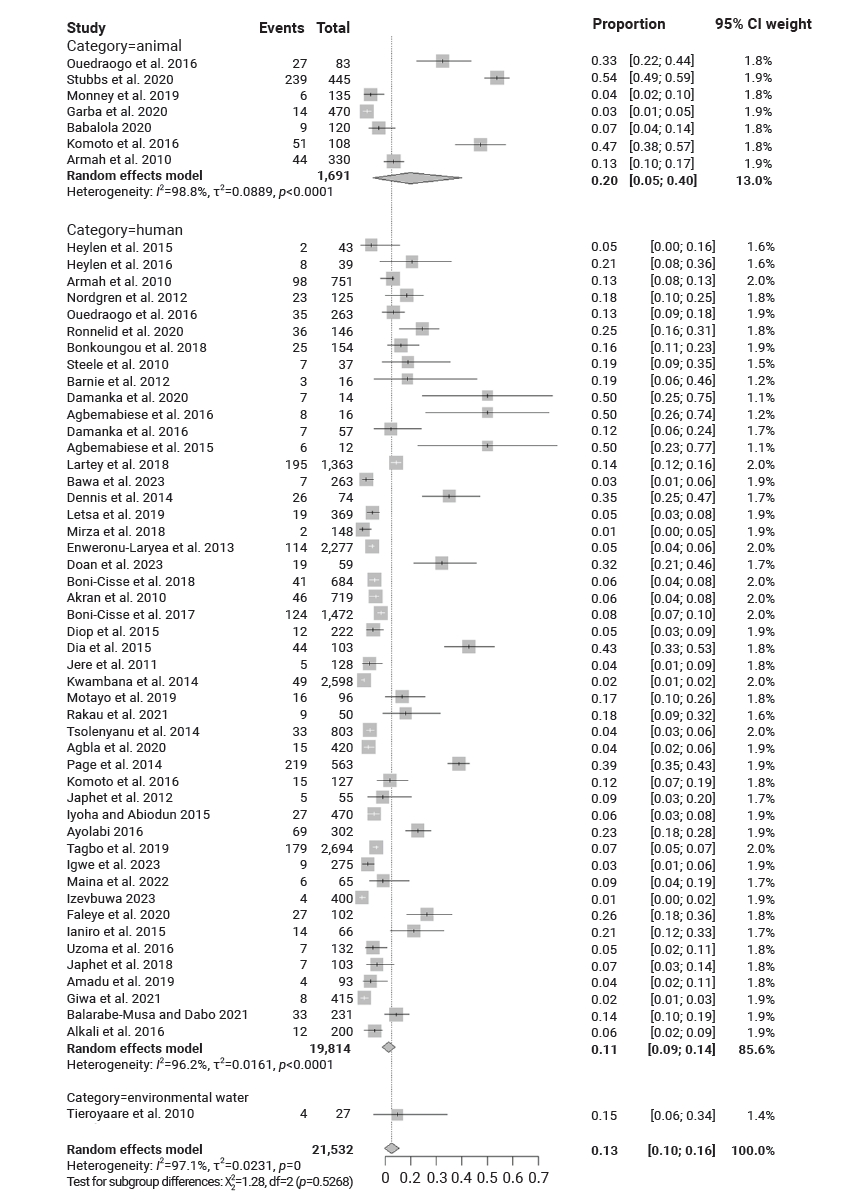
Individual study estimates of RVA prevalence across human, animal, and environmental water source categories are shown in Figure 2. Although 54 studies were included overall, 56 source-category-specific estimates were analyzed because 2 studies contributed separate human and animal data. Prevalence varied widely across studies, ranging from 1% to 50% in humans and from 2.97% to 53.70% in animals. Only 1 study contributed environmental water data; its prevalence estimate was 14.81% (95% CI, 3.47%–31.11%). CIs were generally narrower in larger studies and wider in smaller studies.
Stratified Meta-Analysis of RVA Prevalence across Study Categories
A stratified meta-analysis was conducted to estimate the pooled prevalence of RVA across human, animal, and environmental water source categories in West Africa. The analysis included 56 source-category-specific estimates, representing 21,532 samples and 2,080 RVA-positive cases (Figure 2). The evidence base consisted predominantly of human studies, with fewer animal studies and only 1 environmental water study. Under the random-effects model, the overall pooled RVA prevalence was 12.62% (95% CI, 9.90%–15.61%), with very high overall heterogeneity across all source-category-specific estimates (I²=97.1%; Q=1,924.61; p<0.001). By source category, pooled prevalence was 11.37% (95% CI, 8.96%–14.00%) for human estimates (48 estimates; I²=96.2%), 19.77% (95% CI, 5.39%–40.07%) for animal estimates (7 estimates; I²=98.8%), and 14.81% (95% CI, 3.47%–31.11%) for environmental water (one estimate). These values correspond to the rounded proportions displayed in Figure 2. A source-category-specific heterogeneity estimate could not be calculated for environmental water because only 1 study contributed data to this category. Differences between source categories were not statistically significant (Q=1.28; p=0.5268).
Geographic and Source-Category Distribution of RVA Genotypes in West Africa
The geographic and source-category distribution of RVA genotypes is summarized in Tables 3 and 4. Table 3 shows the occurrence of individual VP7 (G) and VP4 (P) genotypes across source categories and countries, whereas Table 4 presents the distribution of combined G/P genotypes. Overall, RVA showed broad genetic diversity across West Africa. Several G genotypes, particularly G1, G2, G3, and G9, were widely distributed across multiple source categories and countries. Other genotypes, including G6, G8, G10, and G12, were also detected but had a more heterogeneous distribution. For example, G6 was mainly detected in human samples from Burkina Faso and Niger, whereas G8 was detected in Côte d’Ivoire, Ghana, Gambia, Mali, and Senegal. Among VP4 genotypes, P[6] and P[8] were the most widely distributed, occurring across all 3 source categories and in most countries, whereas P[4], P[9], P[10], P[11], and P[14] were less frequent and more geographically restricted. Several G/P genotype combinations, including G1P[8], G2P[4], G2P[6], G9P[8], and G12P[8], were identified across multiple countries. Among these, G2P[4] and G2P[6] were widely distributed in Burkina Faso, Ghana, Niger, Nigeria, Gambia, Togo, and Benin. In contrast, some combinations appeared more source-category specific: G10P[5] and G10P[11] were detected mainly in animals, whereas G1P[4] and G1P[9] were found mainly in human samples.
Pooled Prevalence of RVA Genotypes across Human, Animal, and Environmental Water Source Categories in West Africa
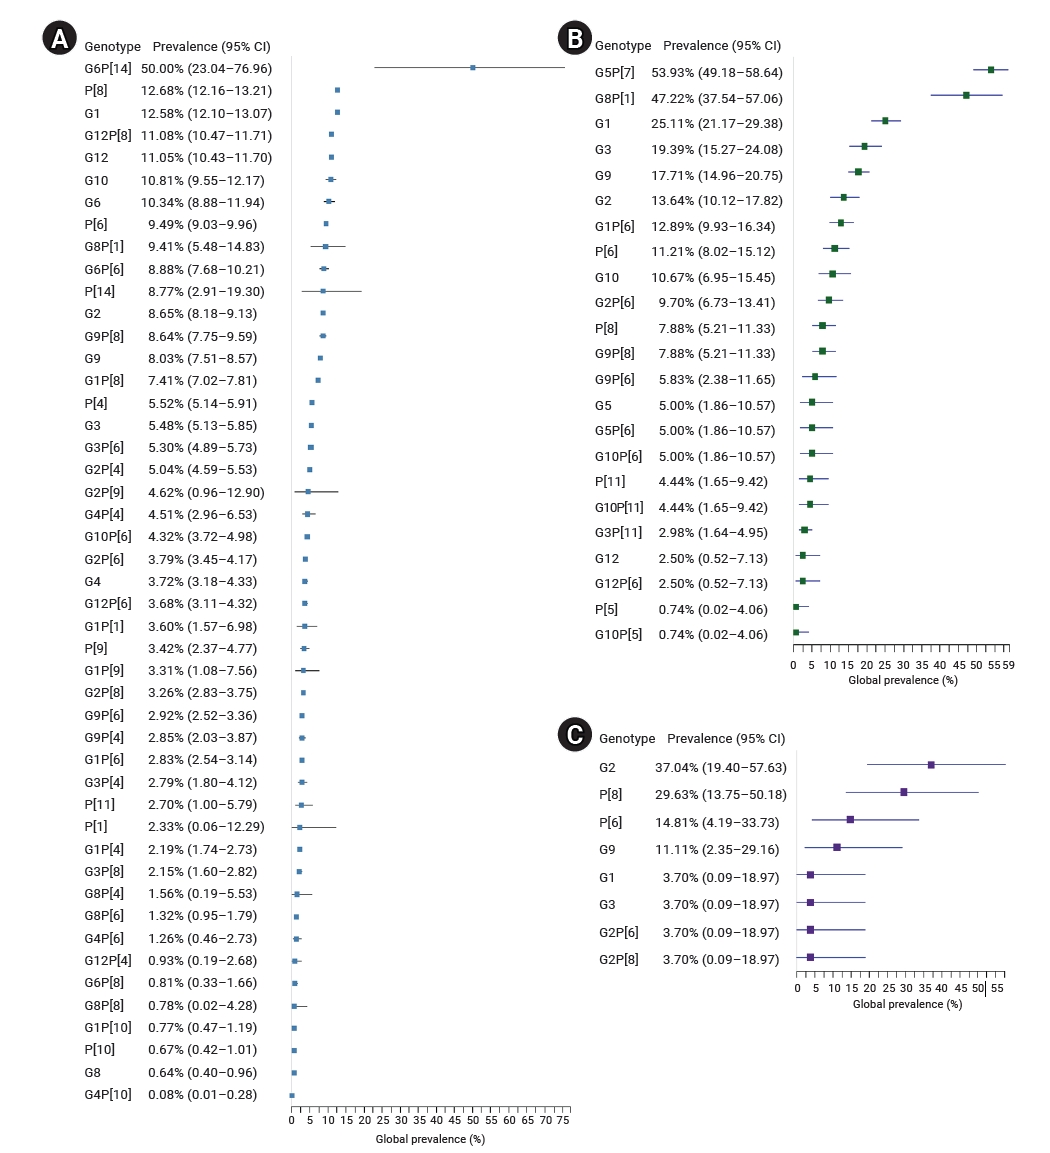
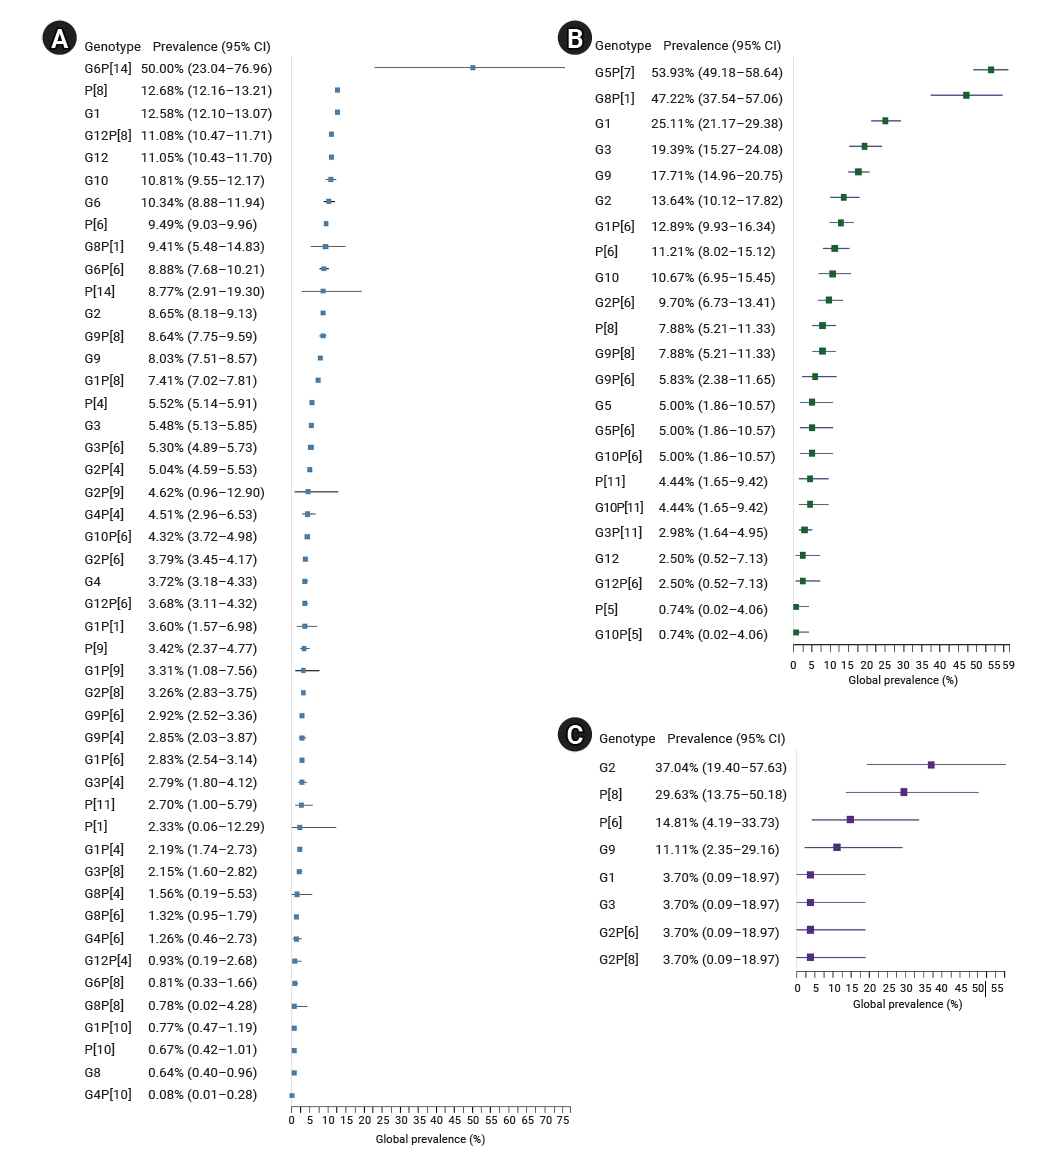
As shown in Figure 3, genotype prevalence varied by source category. In the human source category (Figure 3A), the highest pooled prevalence estimates among the G types were observed for G1 (12.58%), G12 (11.05%), G10 (10.81%), and G6 (10.34%). Among the P types, P[8] had the highest pooled prevalence (12.68%), followed by P[6] (9.49%) and P[14] (8.77%). Among the G/P combinations, G6P[14] had the highest pooled prevalence (50.00%; 95% CI, 23.04%–76.96%), followed by G12P[8] (11.08%), G8P[1] (9.41%), G6P[6] (8.88%), G9P[8] (8.64%), and G1P[8] (7.41%). In the animal source category (Figure 3B), the highest pooled prevalence estimates among the G types were G1 (25.11%), G3 (19.39%), G9 (17.71%), and G2 (13.64%). Among the P types, P[6] had the highest pooled prevalence (11.21%), followed by P[8] (7.88%) and P[11] (4.44%). For G/P combinations, G5P[7] had the highest pooled prevalence (53.93%; 95% CI, 49.18%–58.64%), followed by G8P[1] (47.22%; 95% CI, 37.54%–57.06%), G1P[6] (12.89%), and G2P[6] (9.70%). In the environmental water source category (Figure 3C), G2 had the highest study-specific prevalence estimate among the G types (37.04%; 95% CI, 19.40%–57.63%), followed by G9 (11.11%), whereas G1 and G3 each had a study-specific prevalence estimate of 3.70%. Among the P types, P[8] had the highest study-specific prevalence estimate (29.63%; 95% CI, 13.75%–50.18%), followed by P[6] (14.81%; 95% CI, 4.19%–33.73%). The only reported G/P combinations were G2P[6] and G2P[8], each with a study-specific prevalence estimate of 3.70%. Overall, several genotypes were detected in more than 1 source category, particularly G1, G2, G3, G9, P[6], and P[8], whereas G5P[7] and G8P[1] were especially prominent in the animal source category.
Subgroup Analyses of Pooled RVA Prevalence
Subgroup differences were assessed using the subgroup-difference test integrated within the meta-analysis model. By study design, pooled RVA prevalence was 10.88% (95% CI, 8.14%–14.38%) in cross-sectional studies and 11.11% (95% CI, 4.66%–24.22%) in cohort studies, with no significant subgroup difference (Q=0.002; degrees of freedom [df]=1; p=0.963). Heterogeneity remained very high in both groups (I²=97.2% and 94.1%, respectively). By study duration, pooled prevalence was 12.62% (95% CI, 8.74%–17.88%) for studies lasting ≤2 years, 9.50% (95% CI, 5.90%–14.94%) for studies lasting 3–5 years, and 8.10% (95% CI, 3.69%–16.87%) for studies lasting >5 years, with no significant subgroup differences (Q=1.558; df=2; p=0.459). Heterogeneity remained high across all duration groups, with I² values ranging from 95.4% to 98.1%. By sample size, pooled prevalence was 19.43% (95% CI, 13.92%–26.44%) in studies with <100 samples, 9.81% (95% CI, 6.22%–15.13%) in studies with 100–299 samples, and 7.26% (95% CI, 4.45%–11.62%) in studies with ≥300 samples. Subgroup differences were significant (Q=12.935; df=2; p=0.0016), with lower heterogeneity in studies with <100 samples (I²=75.0%) than in larger studies. By country, pooled prevalence ranged from 6.86% (95% CI, 5.56%–8.43%) in Côte d’Ivoire to 18.33% (95% CI, 14.20%–23.35%) in Burkina Faso, with a significant subgroup difference (Q=37.03; df=6; p<0.0001). Heterogeneity remained substantial in most country subgroups. Overall, significant subgroup differences were observed only for sample size and country.
Sensitivity Analyses of Pooled RVA Prevalence
Sensitivity analyses were performed to assess the robustness of the overall pooled RVA prevalence estimate. After studies classified as having high risk of bias were excluded, the pooled prevalence was 11.71% (95% CI, 8.96%–14.75%), compared with 12.62% (95% CI, 9.90%–15.61%) in the primary analysis. After studies with fewer than 100 samples were excluded, the pooled prevalence decreased to 10.28% (95% CI, 7.50%–13.44%), with persistently high heterogeneity (I²=97.9%). Leave-one-out influence analysis showed that no single study disproportionately influenced the overall pooled estimate; after sequential removal of individual studies, pooled prevalence estimates ranged from 11.81% to 12.97%. These findings suggest that the overall estimate was relatively robust to exclusion of high-risk studies and to individual-study removal, although small studies may have contributed to higher pooled prevalence estimates.
Geographic Mapping of Dominant RVA Genotype Combinations
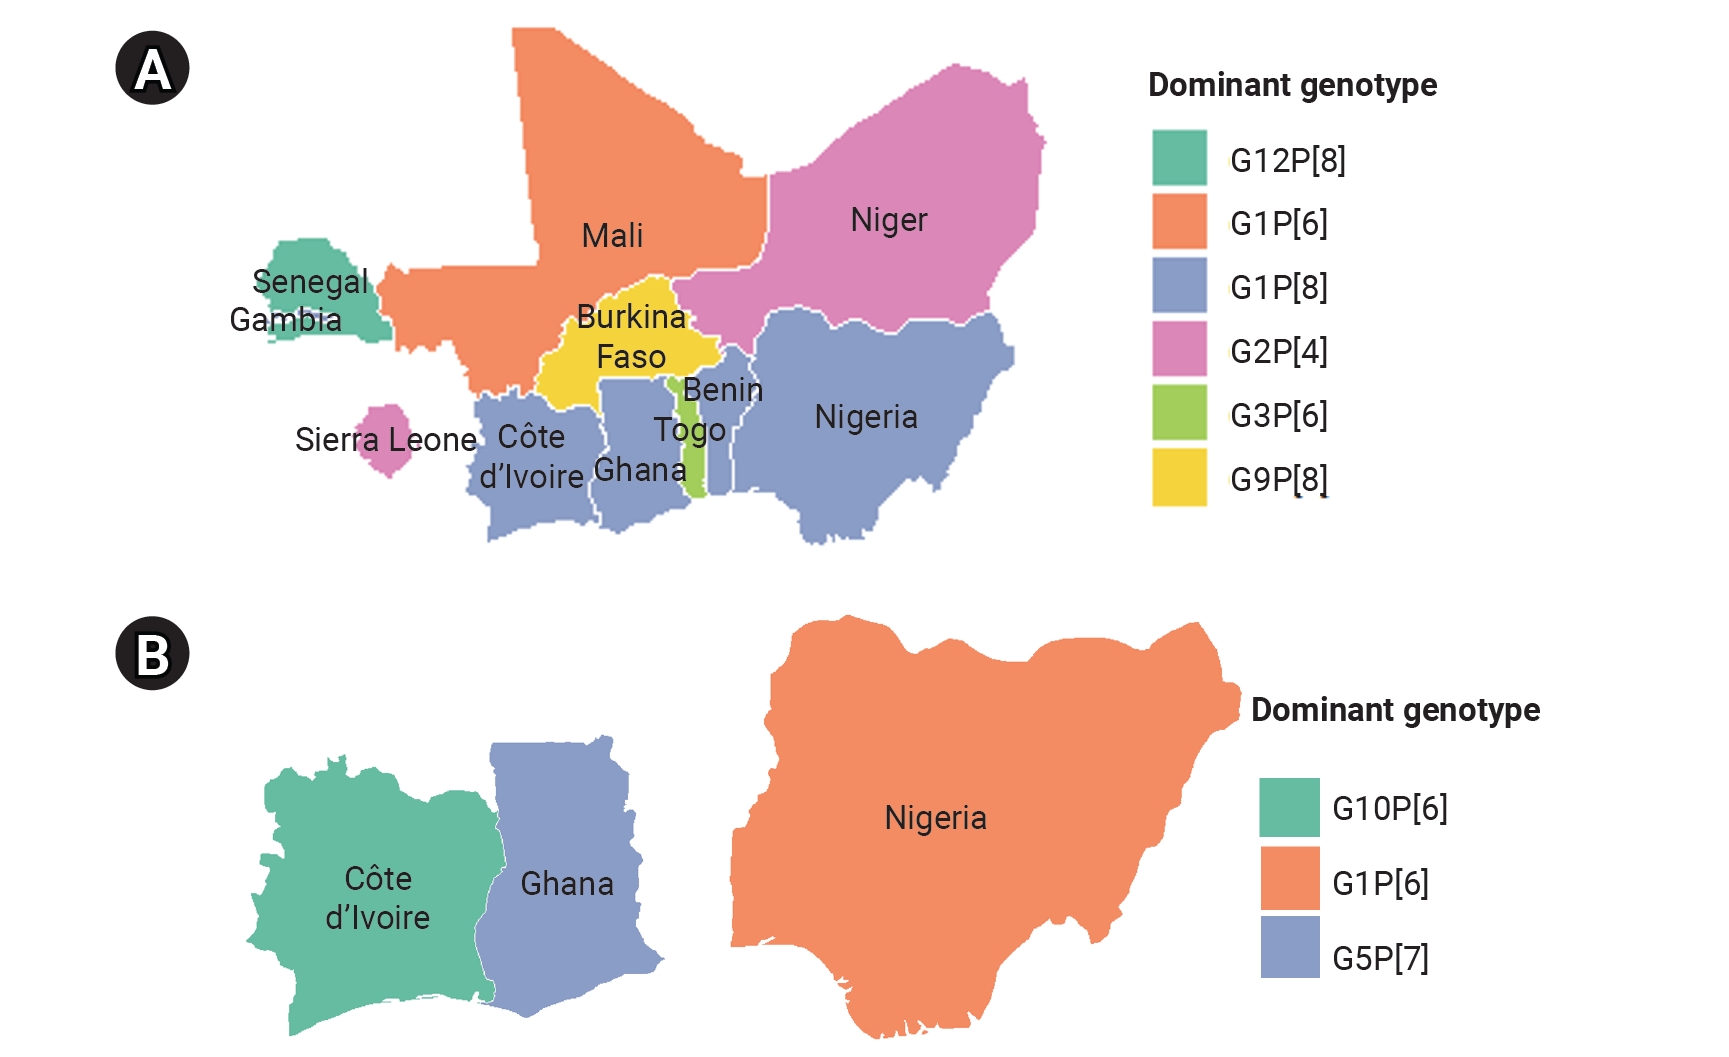
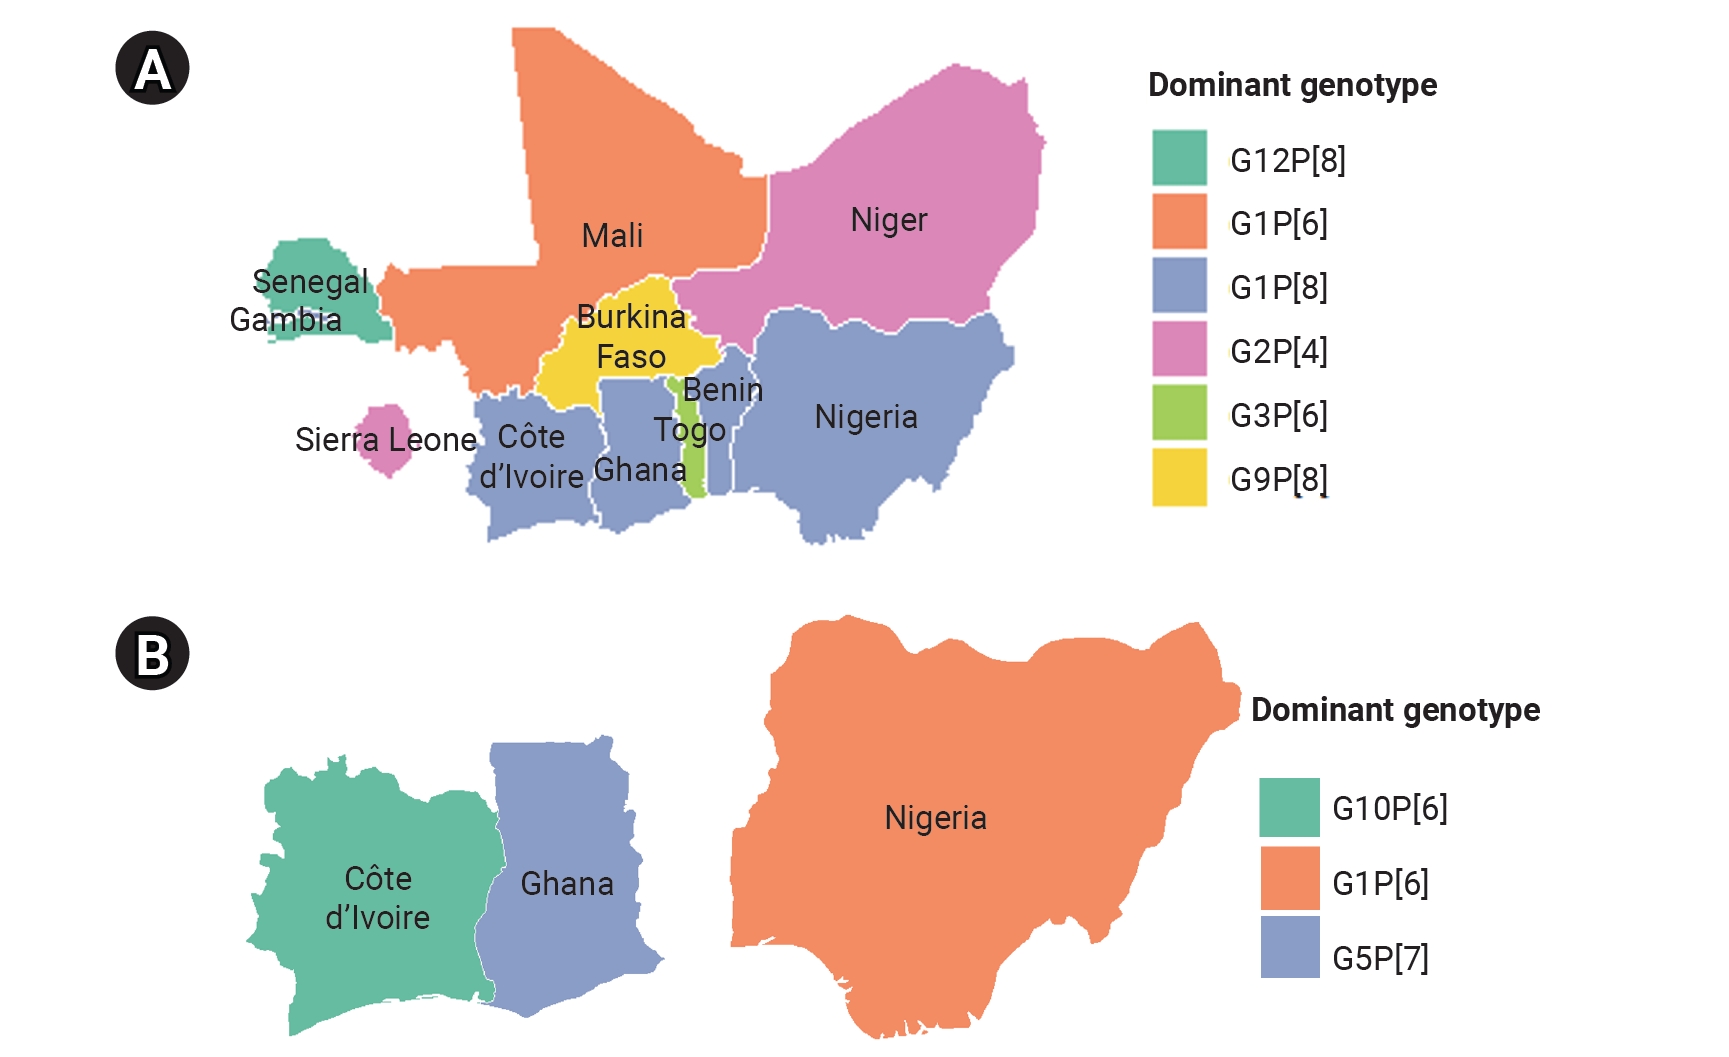
The maps showed marked spatial heterogeneity in the distribution of dominant RVA genotype combinations across West Africa. In the human source category (Figure 4A), G1P[8] was the dominant genotype in several countries, notably Côte d’Ivoire, Gambia, Benin, Ghana, and Nigeria. Other dominant combinations included G9P[8] in Burkina Faso, G1P[6] in Mali, G2P[4] in Niger and Sierra Leone, G3P[6] in Togo, and G12P[8] in Senegal. These patterns indicate that common human-associated RVA genotype combinations predominated, with clear geographic variation across countries. In the animal source category (Figure 4B), the geographic pattern was more restricted because fewer studies were available. The dominant genotype combinations were G10P[6] in Côte d’Ivoire, G5P[7] in Ghana, and G1P[6] in Nigeria, consistent with genotypes commonly associated with animal hosts. No separate map was produced for environmental water because only 1 study from Ghana was available. That study identified G2P[8] and G2P[6] as co-dominant genotype combinations.
Reporting Bias Assessment
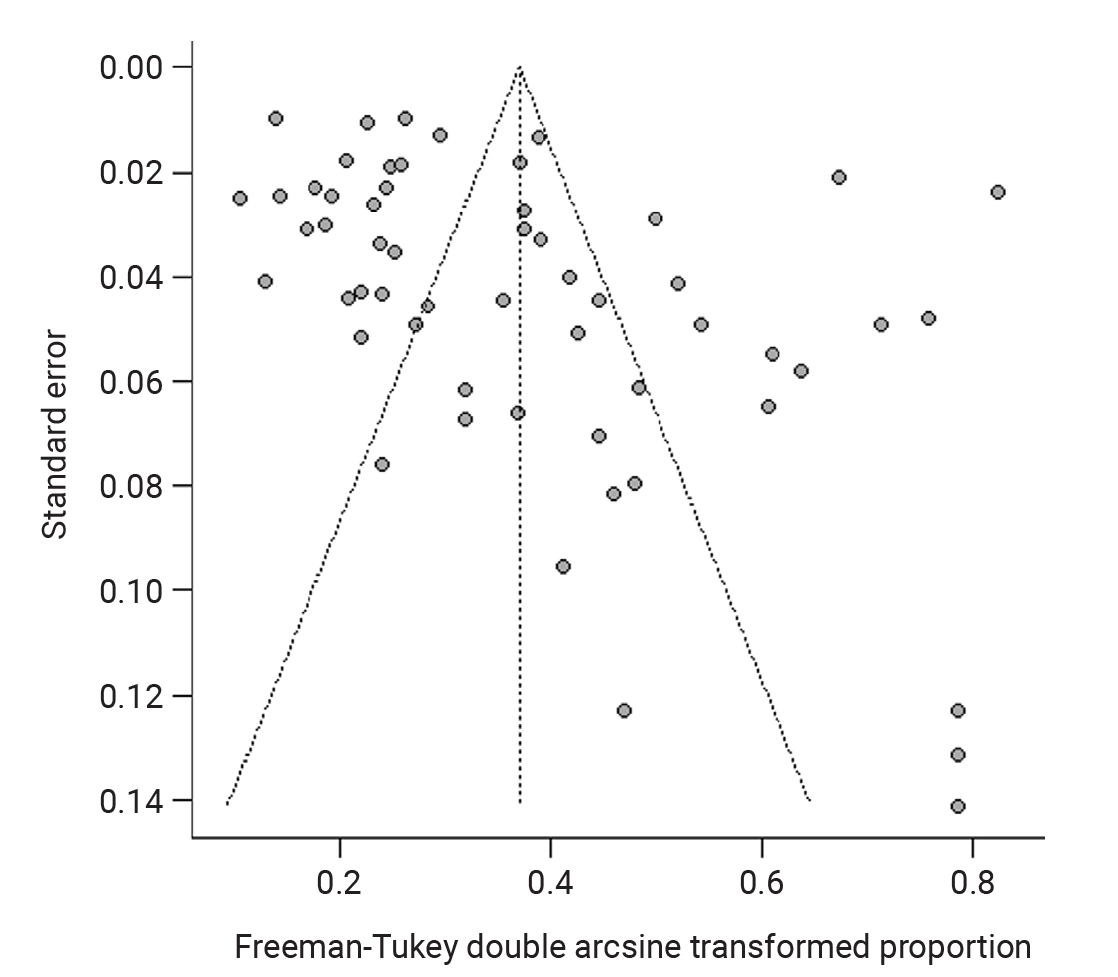
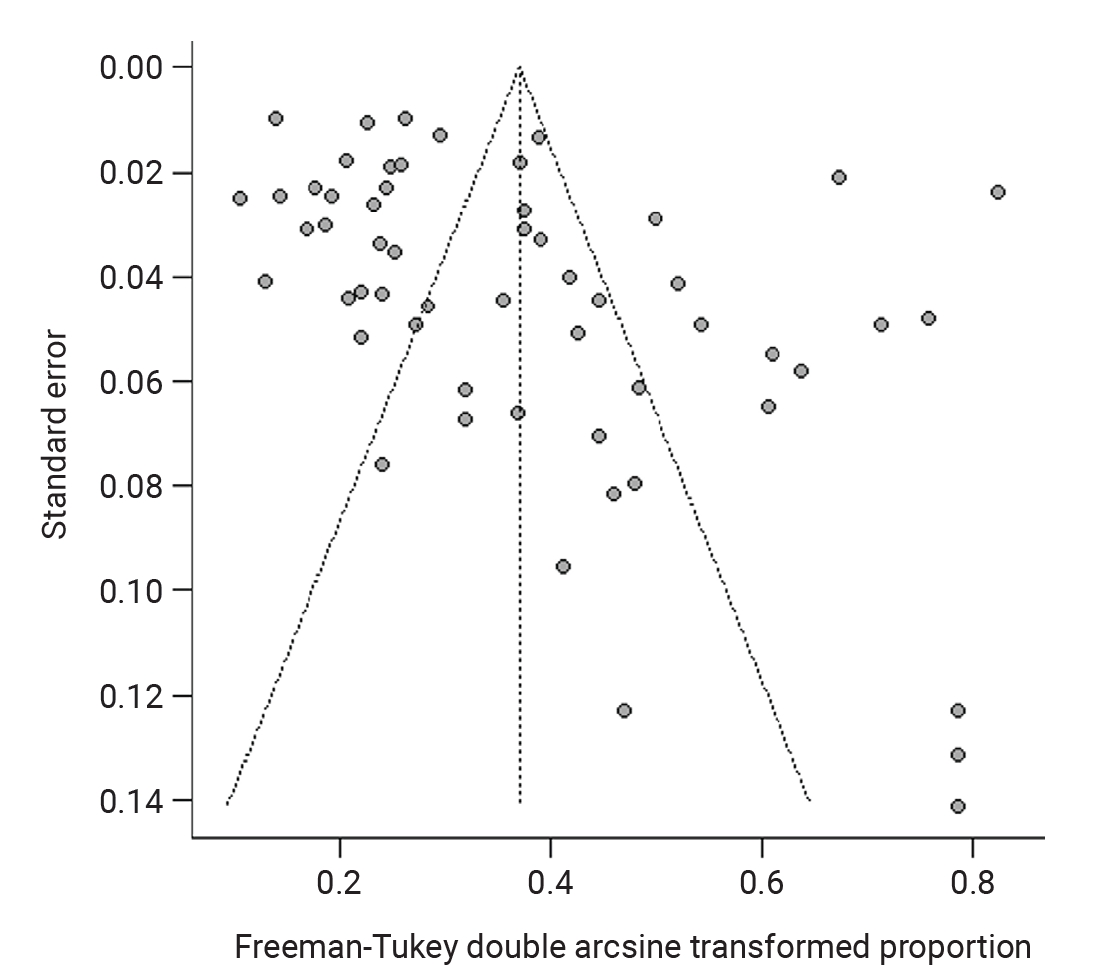
For the overall prevalence synthesis, funnel plot asymmetry and potential reporting bias were assessed by visual inspection of the funnel plot (Figure 5) and Egger’s regression test. The funnel plot showed noticeable asymmetry, with studies unevenly distributed around the pooled estimate, particularly among studies with larger standard errors. Egger’s regression test provided statistical evidence of funnel plot asymmetry (t=2.99; df=54; p=0.0043; bias estimate=3.85). These findings suggest possible small-study effects and potential reporting bias. However, given the very high between-study heterogeneity (I²=97.1%), the observed asymmetry should be interpreted cautiously and should not be considered definitive evidence of publication bias.
Certainty of Evidence
No formal certainty-of-evidence assessment was performed for the assessed outcomes.
This review synthesized evidence from 54 studies to estimate RVA prevalence and describe genotype distribution in humans, animals, and environmental water samples in West Africa. The findings indicate that RVA circulates widely across the region, with an overall pooled prevalence of 12.6%, substantial heterogeneity, and broad genotype diversity. In humans, classical genotype combinations such as G1P[8], G9P[8], and G2P[4] were among the most frequently reported and geographically widespread combinations, whereas animal studies showed broader diversity of livestock-associated strains. Although environmental water data were limited, the detection of RVA in water suggests that environmental contamination may contribute to transmission. In humans, RVA prevalence remained considerable despite vaccine introduction in several West African countries. This pattern is consistent with continued RVA circulation reported in surveillance studies among children younger than 5 years [78]. The frequent detection of G1P[8], G9P[8], and G2P[4] is also consistent with findings from other African regions [79,80]. Together, these observations suggest that vaccination may have reduced severe rotavirus disease but has not eliminated RVA transmission or genotype diversity in the region. Although relatively few animal studies were available, this review identified several genotype combinations commonly associated with animal hosts, including G5P[7], G8P[1], G1P[6], and G2P[6]. This finding is consistent with previous reports by Naseer et al. [81] and Abdou et al. [82]. The detection of both livestock-associated and human-like genotypes supports the possibility of interspecies transmission and underscores the relevance of a One Health perspective for RVA surveillance in the region [83,84].
In environmental water samples, the detection of genotype combinations such as G2P[8] and G2P[6] is consistent with a potential role of contaminated water in RVA transmission, particularly in settings with limited sanitation infrastructure, as reported by Awere-Duodu and Donkor [11]. However, the environmental evidence base remained sparse, limiting broader interpretation of genotype circulation in this source category. The very high heterogeneity observed across studies likely reflects differences in country context, sample size, study populations, laboratory methods, and surveillance approaches. Subgroup analyses showed no significant differences according to study design, or study duration, whereas significant differences were observed by sample size and country. Smaller studies tended to report higher prevalence estimates, and country-level differences indicated important geographic variation in RVA epidemiology across West Africa. This review has important strengths, particularly its One Health perspective and its integration of human, animal, and environmental water data. However, several limitations should be considered when interpreting these findings. The very high between-study heterogeneity reduces the precision of the pooled estimates and indicates that the summary prevalence should not be interpreted as a uniform regional estimate for West Africa. Uneven geographic coverage may limit the external validity and generalizability of the findings, particularly for countries with few or no eligible studies. The small number of animal studies and the availability of only 1 environmental water study also weaken source-category-specific and One Health interpretations. In addition, differences in study populations, sampling designs, and diagnostic and genotyping methods may have affected comparability across studies. Most included studies were cross-sectional, limiting inferences about temporal trends and transmission dynamics. Potential reporting bias suggested by funnel plot asymmetry and Egger’s test may also affect the reliability of the pooled estimates. Sensitivity analyses showed that the overall pooled prevalence estimate remained relatively stable after studies at high risk of bias were excluded and after leave-one-out analysis, suggesting that the main finding was not driven by any single study or by high-risk studies. However, the lower estimate obtained after exclusion of studies with fewer than 100 samples indicates that small studies may have contributed to higher prevalence estimates. Because heterogeneity remained very high, the pooled prevalence should be interpreted cautiously as a summary of heterogeneous evidence rather than as a uniform regional estimate for West Africa. Overall, these findings support stronger One Health surveillance, improved sanitation, and expanded molecular monitoring across West Africa. Future research should prioritize harmonized multicountry surveillance studies across West Africa, especially in countries with limited or no available data. Standardized protocols for sampling, RVA detection, genotyping, and reporting are needed to improve comparability between studies. Greater attention should be given to animal hosts, wastewater, surface water, and other environmental sources to better characterize potential interspecies and environmental transmission pathways. Longitudinal studies are also needed to monitor temporal changes in RVA prevalence and genotype distribution before and after vaccine introduction. Finally, whole-genome sequencing and phylogenetic analyses should be expanded to identify reassortant strains, detect possible interspecies transmission events, and clarify the regional evolution of RVA lineages within a One Health framework.
This systematic review and meta-analysis showed that RVA remains widely distributed in humans, animals, and environmental water samples in West Africa, with an overall pooled prevalence of 12.6% and marked variation in genotype patterns across source categories and countries. In humans, genotype combinations such as G1P[8], G9P[8], and G2P[4] were among the most frequently reported and geographically widespread. Livestock-associated strains were more prominent in animal studies, and RVA was also detected in environmental water samples. These findings highlight the complex epidemiology of RVA in the region and support the need for integrated One Health surveillance, continued molecular monitoring, and stronger water, sanitation, and hygiene interventions to inform prevention and control strategies.
• Fifty-four studies assessed rotavirus A in humans, animals and environmental water samples in West Africa.
• The overall pooled prevalence was 12.6%, with the highest prevalence observed in animals.
• In human studies, G1P[8], G9P[8] and G2P[4] were among the most frequently reported genotype combinations.
• Distinct genotype patterns across humans, animals and environmental water samples support integrated One Health surveillance.
Supplementary data are available at https://doi.org/10.24171/j.phrp.2026.0331.
Table S1.
Core search concepts used across all sources.
j-phrp-2026-0331-Supplementary-Table-S1.pdf
Table S2.
Source-specific search strategies.
j-phrp-2026-0331-Supplementary-Table-S2.pdf
Table S3.
Excluded full-text articles and primary reasons for exclusion.
j-phrp-2026-0331-Supplementary-Table-S3.pdf

Ethics Approval

Not applicable

Conflicts of Interest

The authors have no conflicts of interest to declare.

Funding

None.

Availability of Data

All data generated or analyzed during this study are included in this published article. Additional data may be requested from the corresponding author.

Authors’ Contributions

Conceptualization: JDM, ARMCK; Data curation: JDM, YKo, ARMCK; Formal analysis: JDM, YKo, EVA; Investigation: JDM, YKo, ARMCK; Methodology: JDM, ARMCK; Project administration: JDM; Resources: ARMCK, YKa; Software: YKo, JDM; Supervision: EVA, YKa; Validation: EVA, YKa; Visualization: JDM, YKo; Writing–original draft: JDM; Writing–review & editing: all authors. All authors read and approved the final manuscript.
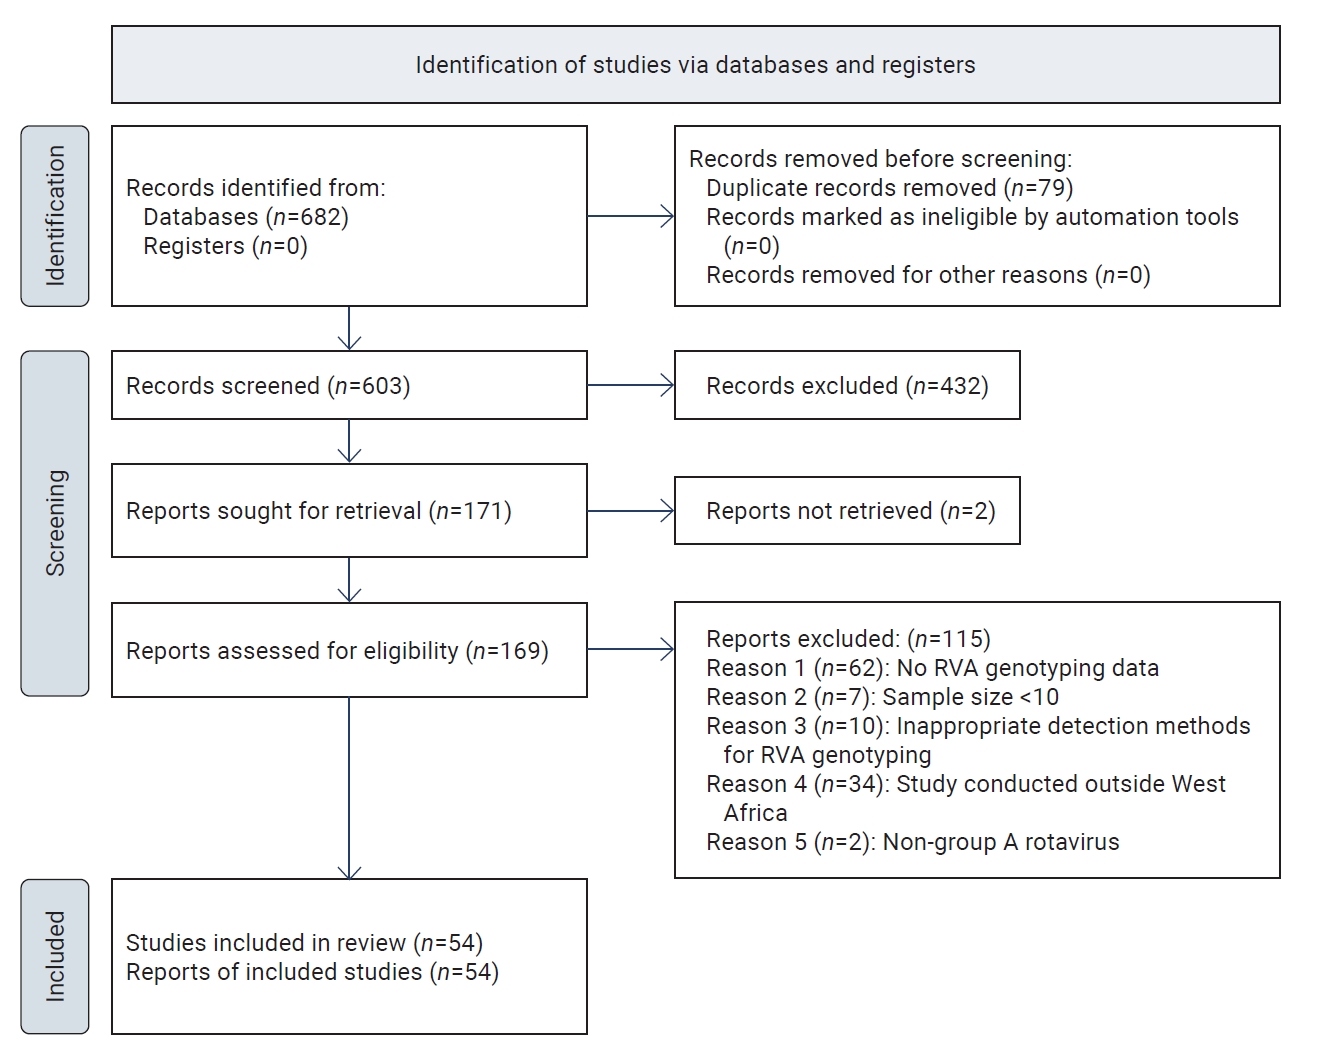
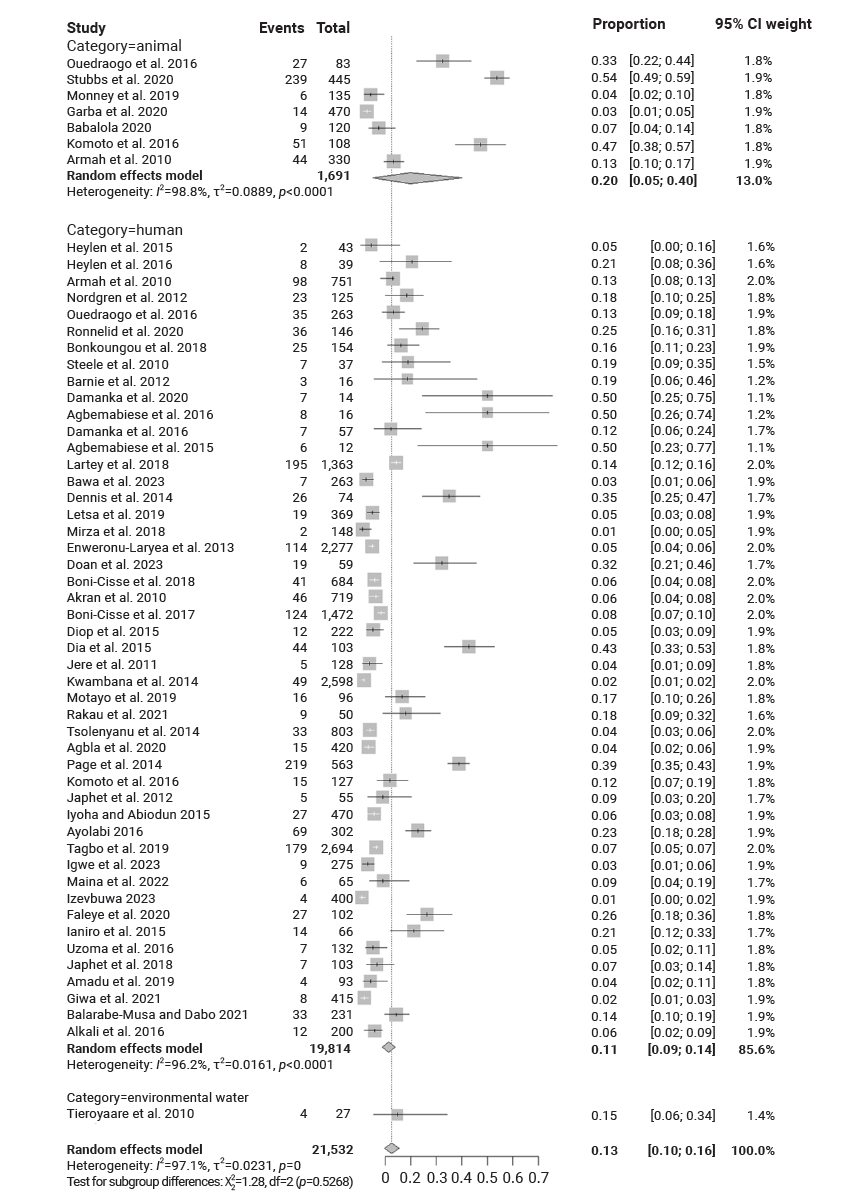
Figure 1.
Preferred Reporting Items for Systematic Reviews and Meta-Analyses 2020 flow diagram of study selection for the systematic review and meta-analysis. RVA, rotavirus A.
Objectives: To systematically review and meta-analyze the prevalence and genetic diversity of rotavirus A (RVA) in humans, animals, and environmental water samples in West Africa and to describe its geographic distribution and circulation patterns. M
Figure 2.
Forest plot of the stratified meta-analysis of rotavirus A prevalence by source category in West Africa. CI, confidence interval; df, degrees of freedom.
Objectives: To systematically review and meta-analyze the prevalence and genetic diversity of rotavirus A (RVA) in humans, animals, and environmental water samples in West Africa and to describe its geographic distribution and circulation patterns. M
Figure 3.
Prevalence of rotavirus A genotypes by source category in West Africa: (A) humans, (B) animals, and (C) environmental water.
Squares represent genotype prevalence estimates, expressed as percentages and horizontal lines represent the corresponding 95% confidence intervals (CI). In the numerical labels, the value outside parentheses indicates the estimated prevalence (%), whereas the 2 values within parentheses indicate the lower and upper limits of the corresponding 95% CI.
Objectives: To systematically review and meta-analyze the prevalence and genetic diversity of rotavirus A (RVA) in humans, animals, and environmental water samples in West Africa and to describe its geographic distribution and circulation patterns. M
Figure 4.
Geographic distribution of dominant rotavirus A genotype combinations by source category in West Africa: (A) humans and (B) animals. No separate map was produced for environmental water because only 1 study was available.
Objectives: To systematically review and meta-analyze the prevalence and genetic diversity of rotavirus A (RVA) in humans, animals, and environmental water samples in West Africa and to describe its geographic distribution and circulation patterns. M
Figure 5.
Funnel plot assessing potential reporting bias in the overall synthesis of rotavirus A prevalence in West Africa.
Objectives: To systematically review and meta-analyze the prevalence and genetic diversity of rotavirus A (RVA) in humans, animals, and environmental water samples in West Africa and to describe its geographic distribution and circulation patterns. M
Table 1.
General characteristics of studies included in the review
Table 1.
No. Study Country Study design Study duration Assay method Source category (y) Sample size
1 Heylen et al. [25] Mali Cross-sectional 2007–2013 RT-PCR Humans <5 43
2 Heylen et al. [26] Mali Cross-sectional 2007–2009 RT-PCR Humans <5 39
3 Ouedraogo et al. [27] Burkina Faso Cross-sectional 2009–2015 RT-PCR Poultry, ruminants, pigs 180, 43, 27
4 Ouedraogo et al. [28] Burkina Faso Cross-sectional 2011–2012 RT-PCR Humans <5 263
5 Ronnelid et al. [29] Burkina Faso Cross-sectional 2015–2016 RT-PCR Humans <5 146
6 Bonkoungou et al. [30] Burkina Faso Cross-sectional 2012–2013 RT-PCR Humans <5 154
7 Steele et al. [31] Burkina Faso Cross-sectional 1999–2000 RT-PCR Humans <5 37
8 Nordgren et al. [32] Burkina Faso Cross-sectional 2010–2011 RT-PCR Humans <5 125
9 Tieroyaare et al. [33] Ghana Cross-sectional 2011–2012 RT-PCR Environmental water 27
10 Stubbs et al. [34] Ghana Cross-sectional 2016–2017 RT-PCR Pigs 445
11 Amoah Barnie et al. [35] Ghana Cross-sectional 2012–2013 RT-PCR Humans <5 16
12 Armah et al. [10] Ghana Cross-sectional 1996–2000 RT-PCR Humans <5, ruminants 751, 330
13 Damanka et al. [36] Ghana Cross-sectional 2010–2011 RT-PCR Humans <5 14
14 Agbemabiese et al. [37] Ghana Cross-sectional 2008–2013 RT-PCR Humans <5 12
15 Damanka et al. [38] Ghana Cross-sectional 2016–2017 RT-PCR Humans <5 57
16 Agbemabiese et al. [39] Ghana Cross-sectional 2012–2013 RT-PCR Humans <5 12
17 Lartey et al. [40] Ghana Cross-sectional 2009–2016 RT-PCR Humans <5 1,363
18 Bawa et al. [41] Ghana Cross-sectional 2020–2021 RT-PCR Humans <5 263
19 Dennis et al. [42] Ghana Cross-sectional 2012–2013 RT-PCR Humans <5 74
20 Letsa et al. [43] Ghana Cross-sectional 2014–2016 RT-PCR Humans <5 369
21 Mirza et al. [44] Ghana Cross-sectional 2018–2019 RT-PCR Humans <5 148
22 Enweronu-Laryea et al. [45] Ghana Cross-sectional 2015–2016 RT-PCR Humans <5 2277
23 Doan et al. [46] Ghana Cross-sectional 2015–2016 RT-PCR Humans <5 59
24 Monney et al. [47] Côte d’Ivoire Cross-sectional 2015–2017 RT-PCR Ruminants 135
25 Boni-Cisse et al. [48] Côte d’Ivoire Cross-sectional 2010–2013 RT-PCR Humans <5 684
26 Akran et al. [49] Côte d’Ivoire Cross-sectional 2000–2004 RT-PCR Humans <5 719
27 Boni-Cisse et al. [50] Côte d’Ivoire Cross-sectional 2010–2016 RT-PCR Humans <5 1472
28 Diop et al. [51] Senegal Cross-sectional 2005–2011 RT-PCR Humans <5 222
29 Dia et al. [52] Senegal Cross-sectional 2011–2012 RT-PCR Humans <5 103
30 Jere et al. [53] Sierra Leone Cross-sectional 2004–2005 RT-PCR Humans <5 128
31 Kwambana et al. [[54] Gambia Cross-sectional 2008–2010 RT-PCR Humans <5 2598
32 Motayo et al. [55] Togo Cross-sectional 2008–2011 RT-PCR Humans <5 96
33 Rakau et al. [56] Togo Cross-sectional 2010–2014 RT-PCR Humans <5 50
34 Tsolenyanu et al. [57] Togo Cross-sectional 2008–2012 RT-PCR Humans <5 803
35 Agbla et al. [58] Benin Cohort 2016–2018 RT-PCR Humans <5 420
36 Page et al. [59] Niger Cross-sectional 2010–2012 RT-PCR Humans <5 563
37 Garba et al. [60] Nigeria Cross-sectional 2020–2021 RT-PCR Ruminants 470
38 Babalola [61] Nigeria Cross-sectional 2014–2015 RT-PCR Ruminants 120
39 Komoto et al. [62] Nigeria Cross-sectional 1995–1996 RT-PCR Humans <5, ruminants 127, 108
40 Oluwatoyin Japhet et al. [63] Nigeria Cross-sectional 2011–2012 RT-PCR Humans <5 55
41 Iyoha and Abiodun [64] Nigeria Cross-sectional 2015–2016 RT-PCR Humans <5 470
42 Ayolabi et al. [65] Nigeria Cross-sectional 2016–2017 RT-PCR Humans <5 302
43 Tagbo et al. [66] Nigeria Cross-sectional 2011–2016 RT-PCR Humans <5 2694
44 Igwe et al. [67] Nigeria Cross-sectional 2018–2019 RT-PCR Humans <5 275
45 Maina et al. [68] Nigeria Cross-sectional 2017–2018 RT-PCR Humans <5 65
46 Izevbuwa [69] Nigeria Cross-sectional 2023–2024 RT-PCR Humans <5 400
47 Faleye et al. [70] Nigeria Cohort 2018–2019 RT-PCR Humans <5 102
48 Ianiro et al. [71] Nigeria Cross-sectional 2013–2014 RT-PCR Humans <5 66
49 Uzoma et al. [72] Nigeria Cross-sectional 2012–2013 RT-PCR Humans <5 132
50 Japhet et al. [73] Nigeria Cohort 2012–2013 RT-PCR Humans <5 103
51 Amadu et al. [74] Nigeria Cross-sectional 2013–2014 RT-PCR Humans <5 93
52 Giwa et al. [75] Nigeria Cross-sectional 2015–2017 RT-PCR Humans <5 415
53 Balarabe-Musa and Dabo [76] Nigeria Cross-sectional 2018–2019 RT-PCR Humans <5 231
54 Alkali et al. [77] Nigeria Cross-sectional 2016–2017 RT-PCR Humans <5 200

Some studies included more than 1 source category. Therefore, a single study may appear to contribute data to multiple source categories when human, animal or environmental water samples were analyzed separately

Table 2.
Study-level risk-of-bias assessment of the included studies
Table 2.
No. Study Source category Tool Item scores Total score Ranking Overall risk of bias
1 Heylen et al. [25] Human JBI J1–J9 3/9 C High
2 Heylen et al. [26] Human JBI J1–J9 5/9 B Moderate
3 Ouedraogo et al. [27] Animal SYRCLE S1–S10 7/10 B Moderate
4 Ouedraogo et al. [28] Human JBI J1–J9 7/9 A Low
5 Ronnelid et al. [29] Human JBI J1–J9 6/9 B Moderate
6 Bonkoungou et al. [30] Human JBI J1–J9 5/9 B Moderate
7 Steele et al. [31] Human JBI J1–J9 4/9 B Moderate
8 Nordgren et al. [32] Human JBI J1–J9 6/9 B Moderate
9 Tieroyaare et al. [33] Environmental water SYRCLE S1–S10 3/10 C High
10 Stubbs et al. [34] Animal SYRCLE S1–S10 8/10 A Low
11 Amoah Barnie et al. [35] Human JBI J1–J9 3/9 C High
12 Armah et al. [10] Human/animal JBI+SYRCLE J1–J9/S1–S10 9/9; 8/10 A; A Low
13 Damanka et al. [36] Human JBI J1–J9 3/9 C High
14 Agbemabiese et al. [37] Human JBI J1–J9 3/9 C High
15 Damanka et al. [38] Human JBI J1–J9 4/9 B Moderate
16 Agbemabiese et al. [39] Human JBI J1–J9 3/9 C High
17 Lartey et al. [40] Human JBI J1–J9 7/9 A Low
18 Bawa et al. [41] Human JBI J1–J9 7/9 A Low
19 Dennis et al. [42] Human JBI J1–J9 5/9 B Moderate
20 Letsa et al. [43] Human JBI J1–J9 8/9 A Low
21 Mirza et al. [44] Human JBI J1–J9 6/9 B Moderate
22 Enweronu-Laryea et al. [45] Human JBI J1–J9 8/9 A Low
23 Doan et al. [46] Human JBI J1–J9 3/9 C High
24 Monney et al. [47] Animal SYRCLE S1–S10 7/10 B Moderate
25 Boni-Cisse et al. [48] Human JBI J1–J9 8/9 A Low
26 Akran et al. [49] Human JBI J1–J9 7/9 A Low
27 Boni-Cisse et al. [50] Human JBI J1–J9 7/9 A Low
28 Diop et al. [51] Human JBI J1–J9 6/9 B Moderate
29 Dia et al. [52] Human JBI J1–J9 5/9 B Moderate
30 Jere et al. [53] Human JBI J1–J9 6/9 B Moderate
31 Kwambana et al. [54] Human JBI J1–J9 7/9 A Low
32 Motayo et al. [55] Human JBI J1–J9 5/9 B Moderate
33 Rakau et al. [56] Human JBI J1–J9 3/9 C High
34 Tsolenyanu et al. [57] Human JBI J1–J9 8/9 A Low
35 Agbla et al. [58] Human JBI J1–J9 5/9 B Moderate
36 Page et al. [59] Human JBI J1–J9 8/9 A Low
37 Garba et al. [60] Animal SYRCLE S1–S10 8/10 A Low
38 Babalola [61] Animal SYRCLE S1–S10 6/10 B Moderate
39 Komoto et al. [62] Human/animal JBI+SYRCLE J1–J9/S1–S10 8/9; 9/10 A; A Low
40 Japhet et al. [63] Human JBI J1–J9 6/9 B Moderate
41 Iyoha and Abiodun [64] Human JBI J1–J9 6/9 B Moderate
42 Ayolabi et al. [65] Human JBI J1–J9 7/9 A Low
43 Tagbo et al. [66] Human JBI J1–J9 5/9 B Moderate
44 Igwe et al. [67] Human JBI J1–J9 8/9 A Low
45 Maina et al. [68] Human JBI J1–J9 5/9 B Moderate
46 Izevbuwa et al. [69] Human JBI J1–J9 7/9 A Low
47 Faleye et al. [70] Human JBI J1–J9 6/9 B Moderate
48 Ianiro et al. [71] Human JBI J1–J9 5/9 B Moderate
49 Uzoma et al. [72] Human JBI J1–J9 7/9 A Low
50 Japhet et al. [73] Human JBI J1–J9 5/9 B Moderate
51 Amadu et al. [74] Human JBI J1–J9 7/9 A Low
52 Giwa et al. [75] Human JBI J1–J9 6/9 B Moderate
53 Balarabe-Musa and Dabo [76] Human JBI J1–J9 6/9 B Moderate
54 Alkali et al. [77] Human JBI J1–J9 8/9 A Low

Coding: For JBI, used 1=yes and 0=no/unclear/not applicable; for SYRCLE, used 1=low risk and 0=high risk/unclear risk. Classification: For JBI, scores of 7–9=A (low risk), 4–6=B (moderate risk) and 0–3=C (high risk). For SYRCLE, scores of 8–10=A (low risk), 5–7=B (moderate risk) and 0–4=C (high risk). Important: Because the 2 tools differ in structure, raw scores are not directly comparable across tools.

JBI, Joanna Briggs Institute; SYRCLE, Systematic Review Centre for Laboratory Animal Experimentation.

Table 3.
Distribution of rotavirus A VP7 (G) and VP4 (P) genotypes across source categories and countries in West Africa
Table 3.
Genotype Animal Human Environmental water Burkina Faso Côte d’Ivoire Ghana Niger Nigeria Gambia Mali Senegal Togo Benin Sierra Leone
G1 ✔ ✔ ✔ ✔ ✔ ✔ ✔ ✔ ✔ ✔ - - - -
G2 ✔ ✔ ✔ ✔ ✔ ✔ ✔ ✔ ✔ - ✔ - - -
G3 ✔ ✔ ✔ ✔ ✔ ✔ ✔ ✔ ✔ - ✔ - - -
G4 - ✔ - - - ✔ - ✔ ✔ - - - - -
G5 ✔ - - - - - - ✔ - - - - - -
G6 - ✔ - ✔ - - ✔ - - - - - - -
G8 - ✔ - - ✔ ✔ - - ✔ ✔ ✔ - - -
G9 ✔ ✔ ✔ ✔ ✔ ✔ ✔ ✔ ✔ - ✔ - - -
G10 ✔ ✔ - ✔ ✔ ✔ - ✔ - - - - - -
G12 ✔ ✔ - ✔ ✔ ✔ ✔ ✔ - - ✔ ✔ - -
P[1] - ✔ - - - ✔ - - - - - - - -
P[4] - ✔ - ✔ - ✔ ✔ ✔ ✔ - - - - -
P[5] ✔ - - - ✔ - - - - - - - - -
P[6] ✔ ✔ ✔ ✔ ✔ ✔ ✔ ✔ ✔ ✔ ✔ - - -
P[8] ✔ ✔ ✔ ✔ ✔ ✔ ✔ ✔ ✔ - ✔ - - -
P[9] - ✔ - - - ✔ - ✔ - - - - - -
P[10] - ✔ - - ✔ - - - ✔ - - - - -
P[11] ✔ ✔ - - ✔ - - - - - ✔ - - -
P[14] - ✔ - - - ✔ - - - - - - - -

✔, genotype detected; -, not detected.
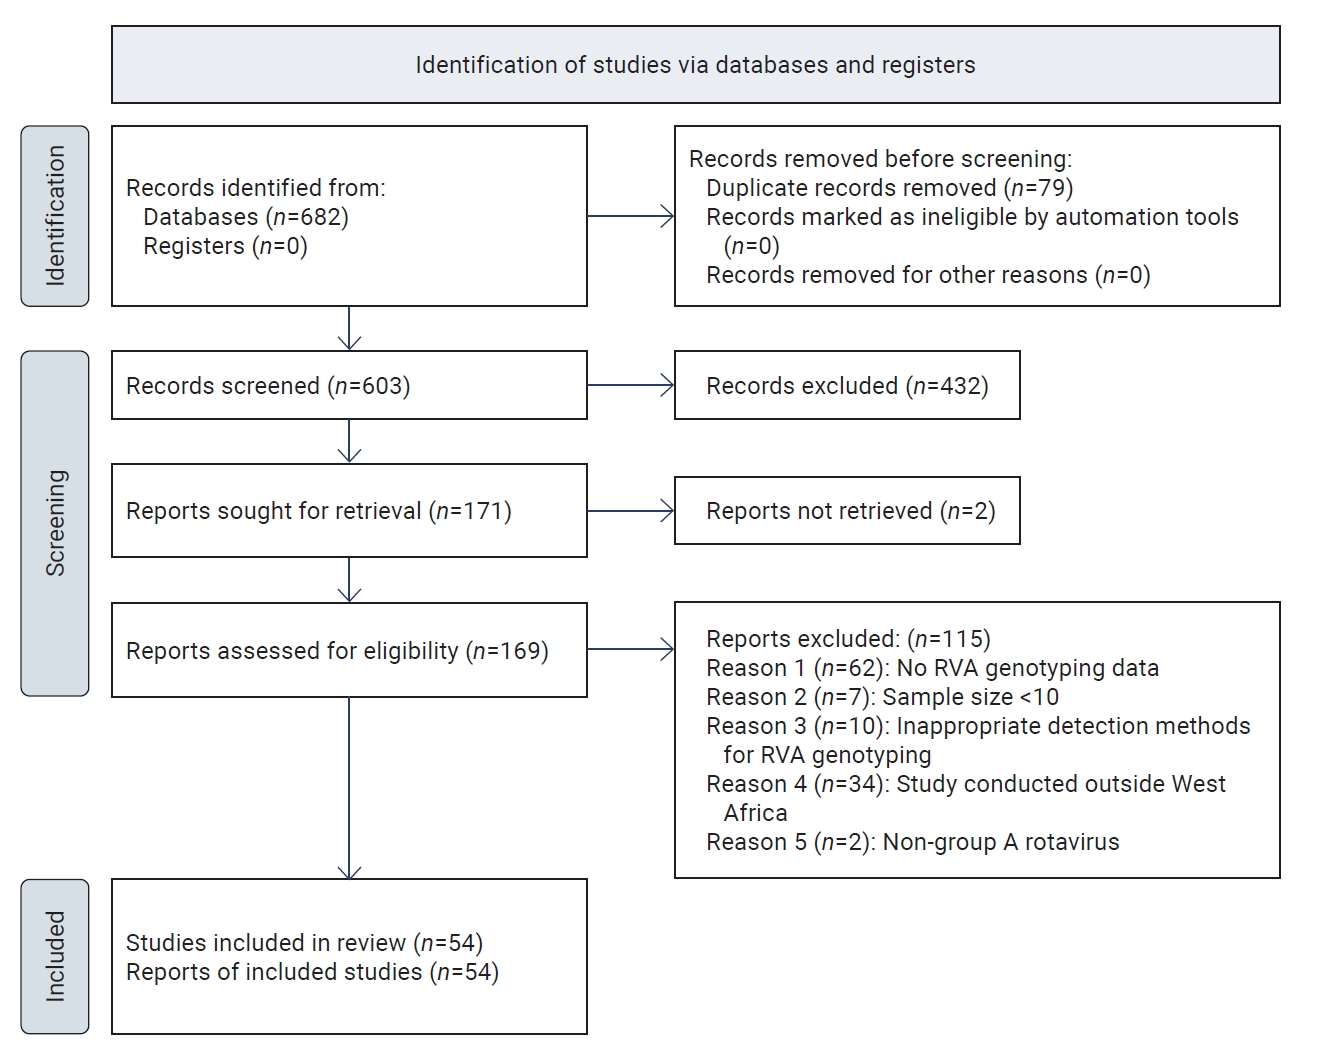
Table 4.
Distribution of rotavirus A G/P genotype combinations across source categories and countries in West Africa
Table 4.
Genotype Animal Human Environmental water Burkina Faso Côte d’Ivoire Ghana Niger Nigeria Gambia Mali Senegal Togo Benin Sierra Leone
G1P[1] - ✔ - - - - - - - - ✔ - - -
G1P[4] - ✔ - ✔ - ✔ - ✔ - - - - ✔ -
G1P[6] ✔ ✔ - - ✔ ✔ ✔ - - ✔ ✔ ✔ ✔ -
G1P[8] - ✔ - ✔ ✔ ✔ ✔ ✔ ✔ - - ✔ ✔ -
G1P[9] - ✔ - ✔ - - - - - - - - - -
G1P[10] - ✔ - - - - - - ✔ - - - - -
G2P[4] - ✔ - ✔ - ✔ ✔ ✔ ✔ - ✔ ✔ ✔ ✔
G2P[6] ✔ ✔ ✔ ✔ ✔ ✔ ✔ ✔ ✔ - - ✔ ✔ -
G8P[4] - ✔ - - - - - - - - - - - ✔
G8P[6] - ✔ - - - ✔ - - ✔ ✔ ✔ - - ✔
G8P[8] - ✔ - - - - - ✔ - - - - ✔ ✔
G9P[4] - ✔ - ✔ - ✔ - - - - - - - -
G9P[6] - ✔ - ✔ - ✔ - ✔ ✔ - - - - -
G9P[8] - ✔ - - ✔ ✔ ✔ ✔ - - ✔ - ✔ -
G10P[5] ✔ - - - ✔ - - - - - - - - -
G10P[6] ✔ ✔ - ✔ - ✔ - ✔ - - - - - -
G10P[11] ✔ - - - ✔ - - - - - - - - -
G12P[4] - ✔ - - - - - ✔ - - - - - -
G12P[8] - ✔ - ✔ ✔ ✔ ✔ ✔ - - ✔ ✔ ✔ -

✔, genotype detected; -, not detected.
  • 1. Omatola CA, Olaniran AO. Rotaviruses: from pathogenesis to disease control: a critical review. Viruses 2022;14:875.
  • 2. Sadiq A, Khan J. Rotavirus in developing countries: molecular diversity, epidemiological insights, and strategies for effective vaccination. Front Microbiol 2024;14:1297269.
  • 3. Johns Hopkins Bloomberg School of Public Health (JHBSPH) (US). Rotavirus the leading cause of diarrheal deaths among children under 5: new analysis finds [Internet]. JHBSPH; 2025 [cited 2025 Feb 12]. Available from: https://publichealth.jhu.edu/2024/rotavirus-the-leading-cause-of-diarrheal-deaths-among-children-under-5-new-analysis-finds.
  • 4. Damtie D, Melku M, Tessema B, et al. Prevalence and genetic diversity of rotaviruses among under-five children in Ethiopia: a systematic review and meta-analysis. Viruses 2020;12:62.
  • 5. Ghonaim AH, Rouby SR, Nageeb WM, et al. Insights into recent advancements in human and animal rotavirus vaccines: exploring new frontiers. Virol Sin 2025;40:1−14.
  • 6. Jampanil N, Kumthip K, Maneekarn N, et al. Genetic diversity of rotaviruses circulating in pediatric patients and domestic animals in Thailand. Trop Med Infect Dis 2023;8:347.
  • 7. Pawłuszkiewicz K, Kucharczyk E, Korgiel M, et al. Advances in the diagnosis and treatment of rotavirus infections: narrative review. Int J Mol Sci 2025;26:9175.
  • 8. Godfrey O, Zhang W, Amponsem-Boateng C, et al. Evidence of rotavirus vaccine impact in sub-Saharan Africa: systematic review and meta-analysis. PLoS One 2020;15:e0232113.
  • 9. Miranda S, Tonin FS, Pinto-Sousa C, et al. Genetic profile of rotavirus type a in children under 5 years old in Africa: a systematic review of prevalence. Viruses 2024;16:243.
  • 10. Armah GE, Steele AD, Esona MD, et al. Diversity of rotavirus strains circulating in west Africa from 1996 to 2000. J Infect Dis 2010;202 Suppl:S64−71.
  • 11. Awere-Duodu A, Donkor ES. Rotavirus in water environments: a systematic review and meta-analysis. Environ Health Insights 2024;18:11786302241276667.
  • 12. Bwogi J, Karamagi C, Byarugaba DK, et al. Co-surveillance of rotaviruses in humans and domestic animals in central Uganda reveals circulation of wide genotype diversity in the animals. Viruses 2023;15:738.
  • 13. Senica P, Zele Vengust D, Vengust G, et al. Genomic revelations: investigating rotavirus a presence in wild ruminants and its zoonotic potential. Front Vet Sci 2024;11:1429654.
  • 14. Higgins JP, Thomas J. Cochrane handbook for systematic reviews of interventions. Wiley; 2019.
  • 15. Page MJ, McKenzie JE, Bossuyt PM, et al. The PRISMA 2020 statement: an updated guideline for reporting systematic reviews. BMJ 2021;372:n71.
  • 16. JBI Evidence Synthesis (JBI) (AU). Q is for Question…[Internet]. JBI; 2015 [cited 2025 Feb 15]. Available from: https://journals.lww.com/jbisrir/fulltext/2015/13090/q_is_for_question_.1.aspx.
  • 17. Munn Z, Moola S, Lisy K, et al. Chapter 5: systematic reviews of prevalence and incidence. In: Aromataris E, Munn Z, eds. JBI manual for evidence synthesis [Internet]. JBI; 2020 [cited 2026 Aug 15]. Available from: https://doi.org/10.46658/JBIMES-20-06.
  • 18. Hooijmans CR, Rovers MM, de Vries RB, et al. SYRCLE’s risk of bias tool for animal studies. BMC Med Res Methodol 2014;14:43.
  • 19. R Core Team (AT). R: a language and environment for statistical computing. R Foundation for Statistical Computing [Internet]. R Core Team; 2025 [cited 2025 Feb 15]. Available from: https://www.r-project.org/.
  • 20. Borenstein M, Hedges LV, Higgins JP, et al. Introduction to meta‐analysis. John Wiley & Sons, Ltd; 2009.
  • 21. Schwarzer G, Carpenter JR, Rucker G. Meta-analysis with R. Springer; 2015.
  • 22. Nyaga VN, Arbyn M. Methods for meta-analysis and meta-regression of binomial data: concepts and tutorial with Stata command metapreg. Arch Public Health 2024;82:14.
  • 23. Egger M, Davey Smith G, Schneider M, et al. Bias in meta-analysis detected by a simple, graphical test. BMJ 1997;315:629−34.
  • 24. Sterne JA, Sutton AJ, Ioannidis JP, et al. Recommendations for examining and interpreting funnel plot asymmetry in meta-analyses of randomised controlled trials. BMJ 2011;343:d4002.
  • 25. Heylen E, Zeller M, Ciarlet M, et al. Comparative analysis of pentavalent rotavirus vaccine strains and G8 rotaviruses identified during vaccine trial in Africa. Sci Rep 2015;5:14658.
  • 26. Heylen E, Zeller M, Ciarlet M, et al. Human P[6] Rotaviruses from sub-Saharan Africa and Southeast Asia are closely related to those of Human P[4] and P[8] rotaviruses circulating worldwide. J Infect Dis 2016;214:1039−49.
  • 27. Ouedraogo N, Ngangas S, et al. Rotavirus in various animal species in Ouagadougou, Burkina Faso: detection of genotype G9. J Appl Biosci 2016;103:9870−6.
  • 28. Ouedraogo N, Kaplon J, Bonkoungou IJ, et al. Prevalence and genetic diversity of enteric viruses in children with diarrhea in Ouagadougou, Burkina Faso. PLoS One 2016;11:e0153652.
  • 29. Ronnelid Y, Bonkoungou IJO, Ouedraogo N, et al. Norovirus and rotavirus in children hospitalised with diarrhoea after rotavirus vaccine introduction in Burkina Faso. Epidemiol Infect 2020;148:e245.
  • 30. Bonkoungou IJ, Ouedraogo N, Tamini L, et al. Rotavirus and norovirus in children with severe diarrhea in Burkina Faso before rotavirus vaccine introduction. J Med Virol 2018;90:1453−60.
  • 31. Steele AD, Page N, de Beer M, et al. Antigenic and molecular characterization of unusual rotavirus strains in Burkina Faso in 1999. J Infect Dis 2010;202 Suppl:S225−30.
  • 32. Nordgren J, Bonkoungou IJ, Nitiema LW, et al. Rotavirus in diarrheal children in rural Burkina Faso: high prevalence of genotype G6P[6]. Infect Genet Evol 2012;12:1892−8.
  • 33. Tieroyaare D, Adjimani J, Armah GE. Detection and characterization of human rotavirus in tap water by multiplex RT-PCR. J Med Med Sci 2010;6:223−30.
  • 34. Stubbs SC, Quaye O, Acquah ME, et al. Full genomic characterization of a porcine rotavirus strain detected in an asymptomatic piglet in Accra, Ghana. BMC Vet Res 2020;16:11.
  • 35. Amoah Barnie P, Harry Asmah R, Damanka S, et al. Possible reassortment of rotaviruses in communities where humans and domestic animals live closely together in Accra, Ghana. Int J Infect Dis 2012;16:e67.
  • 36. Damanka SA, Dennis FE, Lartey BL, et al. Next-generation sequencing of a human-animal reassortant G6P[14] rotavirus A strain from a child hospitalized with diarrhoea. Arch Virol 2020;165:1003−5.
  • 37. Agbemabiese CA, Nakagomi T, Doan YH, et al. Genomic constellation and evolution of Ghanaian G2P[4] rotavirus strains from a global perspective. Infect Genet Evol 2016;45:122−31.
  • 38. Damanka S, Dennis FE, Agbemabiese C, et al. Identification of OP354-like human rotavirus strains with subtype P[8]b in Ghanaian children with diarrhoea. Virol J 2016;13:69.
  • 39. Agbemabiese CA, Nakagomi T, Suzuki Y, et al. Evolution of a G6P[6] rotavirus strain isolated from a child with acute gastroenteritis in Ghana, 2012. J Gen Virol 2015;96:2219−31.
  • 40. Lartey BL, Damanka S, Dennis FE, et al. Rotavirus strain distribution in Ghana pre- and post- rotavirus vaccine introduction. Vaccine 2018;36:7238−42.
  • 41. Bawa FK, Mutocheluh M, Dassah SD, et al. Genetic diversity of rotavirus infection among young children with diarrhoea in the Kassena-Nankana Districts of Northern Ghana: a seasonal cross-sectional survey. Pan Afr Med J 2023;44:148.
  • 42. Dennis FE, Fujii Y, Haga K, et al. Identification of novel Ghanaian G8P[6] human-bovine reassortant rotavirus strain by next generation sequencing. PLoS One 2014;9:e100699.
  • 43. Letsa V, Damanka S, Dennis F, et al. Distribution of rotavirus genotypes in the postvaccine introduction era in Ashaiman, Greater Accra Region, Ghana, 2014-2016. J Med Virol 2019;91:2025−8.
  • 44. Mirza AH, Das S, Pingle MR, et al. A multiplex PCR/LDR assay for viral agents of diarrhea with the capacity to genotype rotavirus. Sci Rep 2018;8:13215.
  • 45. Enweronu-Laryea CC, Sagoe KW, Damanka S, et al. Rotavirus genotypes associated with childhood severe acute diarrhoea in southern Ghana: a cross-sectional study. Virol J 2013;10:287.
  • 46. Doan YH, Dennis FE, Takemae N, et al. Emergence of intergenogroup reassortant G9P[4] strains following rotavirus vaccine introduction in Ghana. Viruses 2023;15:2453.
  • 47. Monney J, Adjogoua E, et al. P and G genotyping of bovine rotavirus detected from fecal samples of calves in Abidjan District, Ivory Coast (2015-2017). J Anim Health Prod 2019;7:106−12.
  • 48. Boni-Cisse C, Meite S, Mlan AB, et al. Genotypic characterization of rotavirus in children under 5 years circulating in Côte D'Ivoire from 2010 to 2013. Virol J 2018;15:78.
  • 49. Akran V, Peenze I, Akoua-Koffi C, et al. Molecular characterization and genotyping of human rotavirus strains in Abidjan, Côte d’Ivoire. J Infect Dis 2010;202 Suppl:S220−4.
  • 50. Boni-Cisse C, Meite S, Britoh MA, et al. Variability in the genotypes of rotavirus detected in Côte d’Ivoire from 2010-2016. Afr J Microbiol Res 2017;11:1663−8.
  • 51. Diop A, Dia ML, Sonko MA, et al. Molecular characterization of group A rotaviruses circulating in Senegal over a 7-year period (2005-2011). Afr J Microbiol Res 2015;9:945−51.
  • 52. Dia ML, Diop A, Sonko MA, et al. First report of gastroenteritis by genotype G12 rotavirus in Dakar, Senegal. New Microbes New Infect 2015;6:30−2.
  • 53. Jere KC, Sawyerr T, Seheri LM, et al. A first report on the characterization of rotavirus strains in Sierra Leone. J Med Virol 2011;83:540−50.
  • 54. Kwambana BA, Ikumapayi UN, Sallah N, et al. High genotypic diversity among rotavirus strains infecting Gambian children. Pediatr Infect Dis J 2014;33 Suppl 1:S69−75.
  • 55. Motayo BO, Oluwasemowo OO, Olusola BA, et al. Phylogeography and evolutionary analysis of African Rotavirus a genotype G12 reveals district genetic diversification within lineage III. Heliyon 2019;5:e02680.
  • 56. Rakau KG, Nyaga MM, Gededzha MP, et al. Genetic characterization of G12P[6] and G12P[8] rotavirus strains collected in six African countries between 2010 and 2014. BMC Infect Dis 2021;21:107.
  • 57. Tsolenyanu E, Seheri M, Dagnra A, et al. Surveillance for rotavirus gastroenteritis in children less than 5 years of age in Togo. Pediatr Infect Dis J 2014;33 Suppl 1:S14−8.
  • 58. Agbla JM, Esona MD, Agbankpe AJ, et al. Molecular characteristics of rotavirus genotypes circulating in the south of Benin, 2016-2018. BMC Res Notes 2020;13:485.
  • 59. Page AL, Jusot V, Mamaty AA, et al. Rotavirus surveillance in urban and rural areas of Niger, April 2010-March 2012. Emerg Infect Dis 2014;20:573−80.
  • 60. Garba J, Faleke OO, Magaji AA, et al. Prevalence of rotavirus A infection and the detection of type G3P[11] strain in ruminants in Yobe state, Nigeria. Trop Anim Health Prod 2020;52:2905−15.
  • 61. Babalola MO. Group A rotavirus genotypes among Calf Herds in Southwest Nigeria and implications for human rotavirus vaccines’ efficiency. OJVM 2020;10:1−13.
  • 62. Komoto S, Adah MI, Ide T, et al. Whole genomic analysis of human and bovine G8P[1] rotavirus strains isolated in Nigeria provides evidence for direct bovine-to-human interspecies transmission. Infect Genet Evol 2016;43:424−33.
  • 63. Oluwatoyin Japhet M, Adeyemi Adesina O, Famurewa O, et al. Molecular epidemiology of rotavirus and norovirus in Ile-Ife, Nigeria: high prevalence of G12P[8] rotavirus strains and detection of a rare norovirus genotype. J Med Virol 2012;84:1489−96.
  • 64. Iyoha O, Abiodun PO. Human rotavirus genotypes causing acute watery diarrhea among under-five children in Benin City, Nigeria. Niger J Clin Pract 2015;18:48−51.
  • 65. Ayolabi CI. Genetic diversity of rotavirus strains in children with diarrhea in Lagos, Nigeria. Asian Pac J Trop Dis 2016;6:517−20.
  • 66. Tagbo BN, Chukwubike C, Mwenda JM, et al. Molecular characterization of rotavirus strains circulating in Enugu Nigeria: 2011 to 2016. WJV 2019;9:22−36.
  • 67. Igwe DN, Oshun PO, Osuagwu CS, et al. Molecular characterization of human rotavirus among children with acute gastroenteritis in Ebonyi State. Int J Clin Sci Med Res 2023;3:66−73.
  • 68. Maina MM, Faneye AO, Motayo BO, et al. Human rotavirus VP4 and VP7 genetic diversity and detection of GII norovirus in Ibadan as Nigeria introduces rotavirus vaccine. J Int Med Res 2022;50:3000605221121956.
  • 69. Izevbuwa O. Sequencing and phylogenetic analysis of human group A rotavirus genotypes circulating among diarrheic children in Edo State, Nigeria. Microbes Infect Dis 2023;4:777−91.
  • 70. Faleye TO, George UE, Simsek C, et al. Reference human rotavirus a genome sequence from a previously vaccinated child with diarrhea in Nigeria. Microbiol Resour Announc 2020;9:e01352−19.
  • 71. Ianiro G, Delogu R, Baba M, et al. Molecular characterization of group A rotavirus strains detected in children with diarrhea admitted to Nigerian hospitals in 2013. Arch Virol 2015;160:1511−7.
  • 72. Uzoma EB, Chukwubuikem C, Omoyibo E, et al. Rota virus genotypes and the clinical severity of Diarrhoea among children under 5 years of age. Niger Postgrad Med J 2016;23:1−5.
  • 73. Japhet MO, Famurewa O, Iturriza-Gomara M, et al. Group A rotaviruses circulating prior to a national immunization programme in Nigeria: clinical manifestations, high G12P[8] frequency, intra-genotypic divergence of VP4 and VP7. J Med Virol 2018;90:239−49.
  • 74. Amadu DO, Abdullahi IN, Emeribe AU, et al. Molecular characterization of rotavirus genotype A in children with acute diarrhea attending a tertiary hospital in Ilorin, Nigeria. Int J Health Allied Sci 2019;8:187−92.
  • 75. Giwa FJ, Garba M, Mukhtar A, et al. Circulating rotavirus genotypes among children younger than 5 years with acute gastroenteritis in Zaria, Northwestern Nigeria. J Pediatr Infect Dis 2021;16:223−9.
  • 76. Balarabe-Musa B, Dabo NT. Rotavirus genotypes in Abuja, Nigeria. Int J Pathog Res 2021;8:19−31.
  • 77. Alkali BR, Daneji AI, Magaji AA, et al. Molecular characterization of human rotavirus from children with diarrhoeal disease in Sokoto State, Nigeria. Mol Biol Int 2016;2016:1876065.
  • 78. Cambaza E, Mongo E, Gatambire A, et al. Rotavirus A, a significant cause of infant diarrhea in Mozambique. Rev Ang de Cienc da Saude 2022;2:4−9.
  • 79. Michael F, Mirambo MM, Lyimo D, et al. Rotavirus genotype diversity in Tanzania during Rotavirus vaccine implementation between 2013 and 2018. Sci Rep 2023;13:21795.
  • 80. Dote JW, Banga Mingo V, Fandema J, et al. Rotavirus prevalence and genotypes in the Central African Republic, 2011-2021. BMC Infect Dis 2025;25:681.
  • 81. Naseer O, Jarvis MC, Ciarlet M, et al. Genotypic and epitope characteristics of group A porcine rotavirus strains circulating in Canada. Virology 2017;507:53−63.
  • 82. Abdou NM, Majeed QA, Saad AA, et al. Cross-sectional study and genotyping of rotavirus-A infections in ruminants in Kuwait. BMC Vet Res 2021;17:245.
  • 83. Joseph JM, Gerald M, George MM, et al. Prevalence of rotavirus group A and associated genotypes detected in calves in Southern Highlands and Eastern Tanzania. Afr J Microbiol Res 2023;17:114−22.
  • 84. Barbosa LC, Lima FS, Silva PA, et al. Association among the presence of rotavirus group A and types of sources located in rural communities. Water (Basel) 2023;15:1763.

Download Citation

Download a citation file in RIS format that can be imported by all major citation management software, including EndNote, ProCite, RefWorks, and Reference Manager.

Format:

Include:

Prevalence and genotype diversity of rotavirus A in humans, animals, and environmental water samples in West Africa: a systematic review and meta-analysis
Download Citation

Download a citation file in RIS format that can be imported by all major citation management software, including EndNote, ProCite, RefWorks, and Reference Manager.

Format:
Include:
Prevalence and genotype diversity of rotavirus A in humans, animals, and environmental water samples in West Africa: a systematic review and meta-analysis
Close

Figure