
Articles
- Page Path
- HOME > Osong Public Health Res Perspect > Volume 14(1); 2023 > Article
-
Original Article
Association between the empirical dietary inflammatory index and musculoskeletal pain in community-dwelling older adults: a cross-sectional study -
Mahshid Rezaei1
 , Zahra Tajary2, Zahra Esmaeily2, Atefeh Eyvazkhani2, Shahrzad Daei1, Marjan Mansouri Dara1, Mohaddeseh Rezaei1, Abolghassem Djazayeri1,2, Ahmadreza Dorosty Motlagh1,2
 -
Osong Public Health and Research Perspectives 2023;14(1):51-58.
DOI: https://doi.org/10.24171/j.phrp.2022.0194
Published online: February 20, 2023
1Department of Nutrition, Science and Research Branch, Islamic Azad University, Tehran, Iran
2Department of Community Nutrition, School of Nutrition Sciences and Dietetics, Tehran University of Medical Sciences, Tehran, Iran
- Corresponding author: Ahmadreza Dorosty Motlagh Department of Community Nutrition, School of Nutrition Sciences and Dietetics, Tehran University of Medical Sciences, Keshavarz bolivar, Hojatdost avenue, Tehran, Iran E-mail: dorostim@tums.ac.ir
© 2023 Korea Disease Control and Prevention Agency.
This is an open access article under the CC BY-NC-ND license (http://creativecommons.org/licenses/by-nc-nd/4.0/).
Abstract
-
Objectives
- Inflammation has been proposed to be one of the main causes of musculoskeletal pain. Diet is a lifestyle factor that plays an important role in managing inflammation; thus, we assessed the inflammatory potential of diets using the empirical dietary inflammatory index (EDII) to investigate the relationship between diet and musculoskeletal pain.
-
Methods
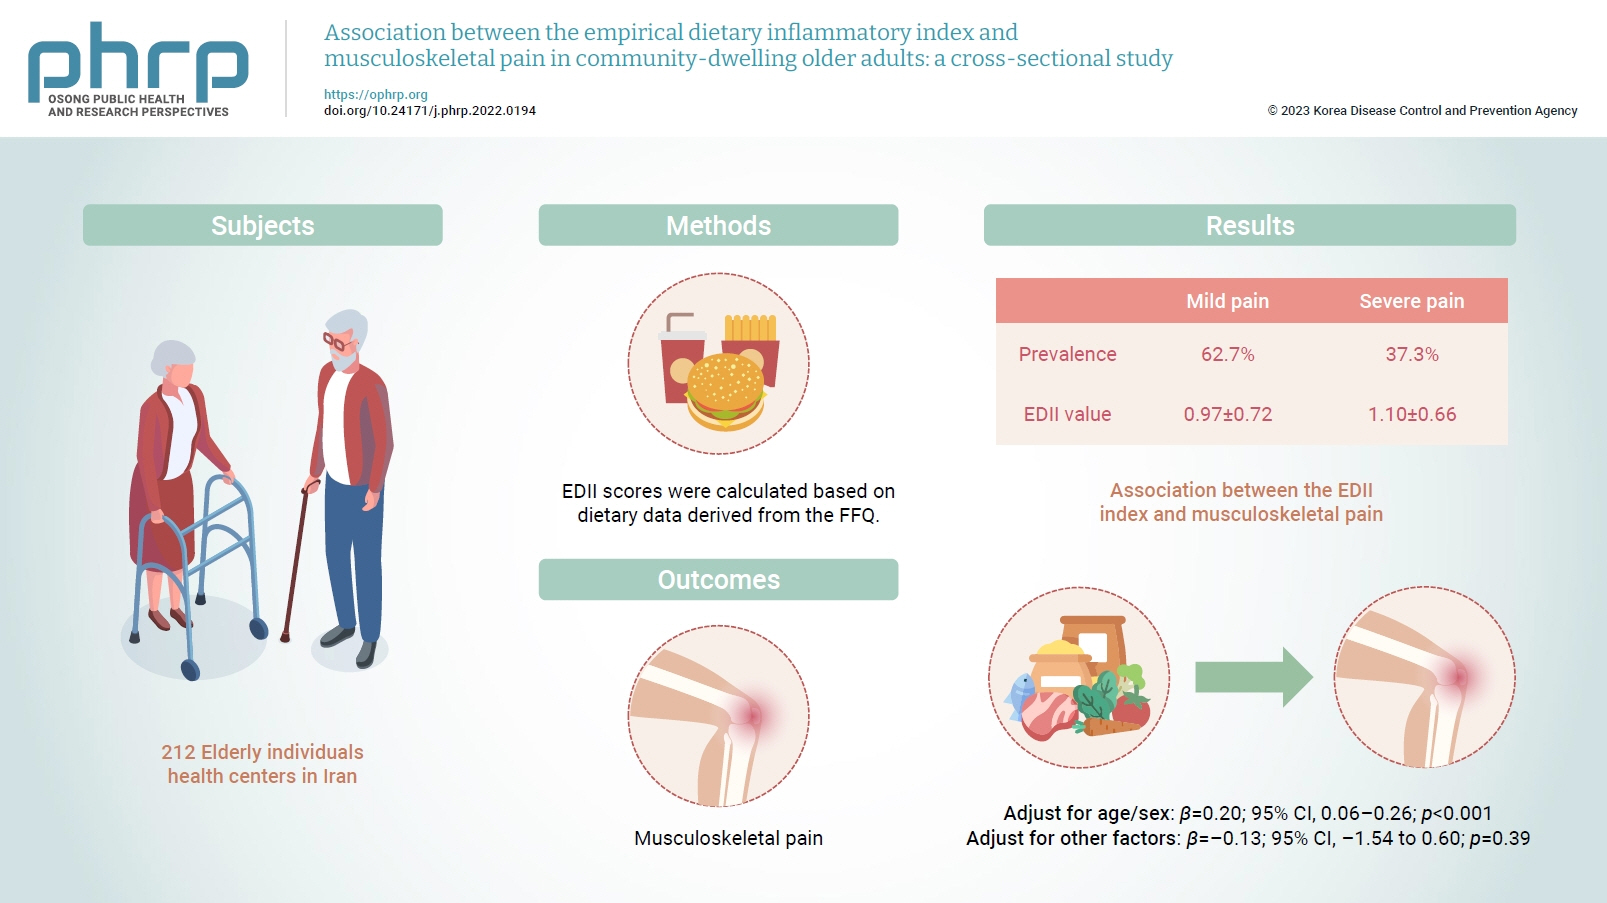
- This cross-sectional study included 212 elderly individuals who were selected from health centers in Tehran, Iran. Dietary intake was evaluated using a valid and reliable 147-item food frequency questionnaire. To measure the intensity of pain, a visual analogue scale was used. Multiple linear regression was applied to assess the association between the EDII and musculoskeletal pain.
-
Results
- In total, 62.7% and 37.3% of participants had mild and severe pain, respectively. The EDII values were 0.97±0.72 and 1.10±0.66, respectively, in those with mild and severe pain. A higher EDII score was associated with more intense musculoskeletal pain after adjusting for age and sex (β=0.20; 95% confidence interval [CI], 0.06–0.26; p<0.001), but not after adjustment for other confounders (β=–0.13; 95% CI, –1.54 to 0.60; p=0.39).
-
Conclusion
- Our findings indicated that higher dietary inflammation might not be associated with musculoskeletal pain in older adults. However, further investigations are required to confirm these findings.
- Musculoskeletal conditions affect the soft tissues, joints, and bones, are common in the elderly [1,2], and could lead to pain, a weakened locomotor system, and disability [3,4]. These conditions could also impose a heavy economic burden on society [5]. Although the exact mechanism is still not fully understood, evidence abounds associating these conditions with inflammatory diseases such as rheumatoid arthritis and osteoarthritis [6]. It has also been shown that an excessive amount of reactive oxygen species is present in individuals experiencing musculoskeletal conditions [7], along with other inflammatory markers such as tumor necrosis factor-alpha and interleukin-6 [8]. Therefore, it is reasonable to assume that managing inflammation could be an important step in mitigating musculoskeletal conditions [9]. Chronic inflammation can be significantly tackled by making lifestyle changes such as dietary interventions [10,11].
- Some dietary components such as fruits, vegetables, whole grains, and spices, have been shown to demonstrate anti-inflammatory effects due to their high antioxidant and polyphenol content [12]. Conversely, high consumption of animal proteins and fats has been indicated to induce inflammation [13,14]. However, due to the synergistic or antagonistic effects that foods have on each other, evaluating the overall dietary pattern could provide more comprehensive insights into the diet-disease association [15]. The empirical dietary inflammatory index (EDII) can be used for this purpose [16]. The EDII is a hypothesis-driven index that has been recently proposed to assess the potential pro- or anti-inflammatory effect of the diet based on the intake of various food groups [17]. Several studies have investigated associations between the EDII and chronic diseases and have shown that a higher EDII was associated with an increased risk of diabetes, metabolic syndrome, and fatty liver disease [18,19]. However, to our knowledge, the association of this dietary index with musculoskeletal pain has not been investigated yet. Given the importance of improving the quality of life in the elderly, we conducted this study to determine whether there is an association between musculoskeletal pain and the EDII in the elderly.
Introduction
- Study Design
- This cross-sectional study was conducted among a total of 213 elderly individuals who were enrolled in our study from September 2019 to August 2020 at health centers in Tehran, Iran. We divided the city of Tehran into 5 regions (north, south, east, west, and center). Then, 20 health centers that individuals attended routinely for check-ups were selected. We tried to enroll a certain amount of people from each region to attenuate the likelihood of financial gaps among our participants. The sample size was determined employing the following formula: N=[(Z1–α/2)2 P(1–P)]/d2, using P=29, d=4.06, and α=0.05 [20]. The main inclusion criterion was being elderly (≥60 years old). The remaining inclusion criteria were as follows: having a history of musculoskeletal pain for at least 2 months, having no change in the usual dietary pattern over the previous year, being able to ambulate, not having a history of trauma or injury-related accidents, and not having cancer, acute diseases, and cognitive impairment. Participants following a special diet or those whose energy intake fell outside the normal range of 800 to 4,200 kcal were excluded from our study.
- Participants’ Characteristics
- After the first screening, some participants did not meet our inclusion criteria, missed the first interview, or declined to participate; eventually, 212 older adults were enrolled in the study. Socio-demographic data, including age, sex, marital status, economic status (very bad, bad, average, good, and very good) [21], educational level (up to diploma and upper diploma), exercise, sleep duration, supplement intake, history of diseases (cardiovascular diseases, diabetes, digestive diseases, psychological diseases, and skeletal disorders) and medication use, were gathered by trained researchers.
- Dietary Assessment
- Participants’ usual dietary intake was evaluated using a validated and reliable 147-item semi-quantitative food frequency questionnaire (FFQ) that elicited information on diet during the past 12 months on a daily, weekly, and monthly basis [22]. An expert nutritionist gathered dietary data through face-to-face interviews and converted portion sizes to intake (in grams) of each food item and nutrient. The Nutritionist IV software (First Databank Division, the Hearst Corporation; modified for Iranian foods) was used.
- EDII scores were calculated based on dietary data derived from the FFQ, which has been used in previous studies [17,23]. The EDII includes 18 food groups. However, due to religious considerations, beer and wine were not included in the dietary score. Moreover, high- and low-energy beverages were considered a single food item in the FFQ. Therefore, we calculated the EDII score based on 15 food groups and 2 categorizations of inflammatory potential. The anti-inflammatory food group consisted of tea, coffee, dark yellow vegetables, leafy green vegetables, snacks, fruit juice, and pizza. Meanwhile, the pro-inflammatory group includes processed meat, red meat, organ meat, other fish (fish, or canned tuna), other vegetables (mixed vegetables, cooked mushrooms, green peppers, zucchini, eggplant, or cucumbers), refined grains, high-energy and low-energy drinks, and tomatoes. Regression coefficients were used to weigh the mean daily intake of the food groups. The obtained values were then summed and divided by 1,000. Positive scores of the EDII are an index of pro-inflammatory diets, while negative scores correspond to anti-inflammatory diets.
- Pain Evaluation
- A visual analogue scale, a valid, reliable, and responsive tool [24] with 0 to 10-cm lines, was used to measure the pain intensity of participants during the previous 3 months. Its score ranges from 0 to 10, with 0 indicating no pain, <3 denoting mild pain, and ≥3 corresponding to severe pain [25]. Participants were asked to draw a vertical mark on the lines to indicate their pain level.
- Assessment of Other Variables
- Anthropometric measurements (height, body weight, body mass index [BMI], waist circumference [WC], and hip circumference) were assessed for all participants. Height was measured in the standing shoeless position by a standard stadiometer to the nearest 0.1 cm. Body weight was assessed by a digital scale (SECA) to the nearest 0.1 kg while participants wore light clothing. BMI was calculated as weight divided by height squared (kg/m2) [26]. WC was assessed with an accuracy of 0.1 cm, at the level of the iliac crest [27], and hip circumference was recorded at the anterior superior iliac spine level [26]. Physical activity was evaluated by asking participants about their daily average time spent jogging, exercising, or engaging in other sports. The activity level was ranked into 4 categories (light, moderate, strong, and intense). Participants’ physical activity level was calculated as metabolic equivalent-hours/day [28].
- Statistical Analysis
- The characteristics of the study population are expressed as mean±standard deviation (for normally distributed data) or median (for data with a skewed distribution). The normality of the distribution of variables was assessed using the Kolmogorov-Smirnov test. The independent sample t-test and the chi-square test were used to evaluate the qualitative and quantitative variables, respectively.
- The dietary intake of study participants across animal and plant protein tertiles was compared using analysis of covariance. All values were adjusted for energy intake. We used multiple linear regression analysis to estimate odds ratios (ORs) and 95% confidence intervals (CIs) for musculoskeletal pain across EDII tertiles in crude and multivariable-adjusted models. Age, sex, education, economic status, physical activity, BMI, energy intake, and economic status were adjusted in the control model. IBM SPSS ver. 24.0 (IBM Corp.) was used to perform the statistical analysis. A p-value <0.05 was considered to indicate statistical significance.
- Ethics Statement
- All patients were informed about the characteristics of the study and signed a written informed consent form. The study protocol was reviewed and approved by the local ethical committee of Islamic Azad University, Tehran, Iran (Code: 1397.174.IR.IAU.SRB.REC).
Materials and Methods
- The demographics, lifestyle, work-related, and health characteristics of the participants are described in Tables 1 and 2, according to the intensity of pain. We evaluated 212 participants, of whom 48 were men (22.6%) and 164 were women (77.4%), with an average age of 66 years. The pain assessment showed that 62.7% and 37.3% of the participants experienced mild and severe pain, respectively. The BMI was 28.43±3.76 kg/m2 and 29.15±4.22 kg/m2 in those with mild and severe pain, respectively. The EDII values were 0.97±0.72 and 1.10±0.66 in participants with mild and severe pain, respectively; this difference was not statistically significant. Furthermore, 67.5% and 32.5% of participants with mild and severe pain were married. A comparison between the 2 pain groups indicated remarkable differences between them in terms of the head of the family, educational level, economic status, and psychological disorders (p=0.01, p=0.01, p=0.001, p=0.004, and p=0.003, respectively). Additionally, gastrointestinal, cardiovascular, and psychological medication intake, and vitamin D supplement usage were significantly different between the mild and severe pain groups (p=0.01, p=0.02, p=0.002, and p=0.03, respectively).
- The dietary intake of participants by tertile of EDII scores is presented in Table 3. People in the third tertile of the EDII consumed higher amounts of total energy, protein, total fat, saturated fat, monounsaturated fat, polyunsaturated fat, fiber, processed meat, red meat, other fish, other vegetables, refined grains, and tomatoes (p<0.05). The intake of other dietary components such as carbohydrates, tea, coffee, dark yellow vegetables, leafy green vegetables, snacks, fruit juice, pizza, organ meat, and beverages did not differ according to the tertile of the EDII score.
- Table 4 demonstrates the association between the EDII and musculoskeletal pain shown by multiple linear regression (Table 5). In the crude model, the EDII did not have a significant association with musculoskeletal pain (β=0.07; 95% CI, –1.40 to 4.17; p=0.32). After adjusting for covariates including age and sex, the association became significant (β=0.20; 95% CI, 0.06–0.26; p<0.001). However, the fully adjusted model did not show statistical significance (β=–0.13; 95% CI, –1.54 to 0.60; p=0.39).
Results
- The present study investigated the association between the EDII and musculoskeletal pain in older adults. A higher EDII was significantly associated with differences in nutrient and food intake Furthermore, there was a significant positive association between EDII and musculoskeletal pain after adjusting for age and sex.
- Our study showed a significant association between the EDII and intake of total energy, protein, total fat, saturated fat, monounsaturated fat, polyunsaturated fat, fiber, processed meat, red meat, other fish and vegetables, refined grains, and tomatoes. As Phillips et al. [29] indicated in their study, the consumption of red and processed meats and refined cereals/grains was higher and the intake of whole grains, fish, and low-fat dairy products was lower in participants with higher pro-inflammatory scores. Similarly, Bagheri et al. [30] reported that there was a significant association between the food-based inflammatory potential of the diet and greater consumption of refined grains, red meats, high-fat dairy, soft drinks, and potatoes. In addition, different fatty acids can stimulate inflammatory processes, or anti-inflammatory cell function through various mechanisms [31]. For instance, although monounsaturated and polyunsaturated fatty acids have anti-inflammatory properties, the n-6/n-3 ratio has been shown to be associated with the inflammatory response and coagulation [32]. Since the relationship between chronic conditions and inflammation is widely recognized, it is important to pay attention to the content and the inflammation score of individuals’ diets.
- Our findings showed no direct association between the EDII and musculoskeletal pain. Although studies on this topic are limited, Enrico [33] examined the relationship between the DII and chronic pain in adults, and the results showed that dietary inflammatory index (DII) scores were significantly related to the presence of neck and back pain. In addition, DII scores have been associated with pain lasting longer than 24 hours and 3 months. Similarly, Toopchizadeh et al. [34] revealed that the DII score was directly linked to pain intensity in knee osteoarthritis patients, and a higher DII score was associated with higher odds of having severe pain. In contrast, Correa-Rodriguez et al. [35] reported no association between the DII score and clinical symptoms in women with fibromyalgia. Nevertheless, they found that the DII score was associated with lower pressure pain thresholds.
- Various studies have emphasized the anti-inflammatory properties of foods, which have been reported to reduce chronic pain, osteoarthritis-related pain, and neurogenic pain [36−38]. Anti-inflammatory diets can reduce pain via several putative mechanisms. Anti-inflammatory components such as flavonoids, curcuminoids, omega-3 polyunsaturated fatty acids, trombone, and taurine could have analgesic effects by preventing inflammatory signaling, regulating cyclooxygenase 2 activity, interacting with neuromodulator pathways (including the opiate receptors and the gamma-aminobutyric acid receptor signaling), targeting L-arginine/nitric oxide signaling, and reducing the production of prostaglandin E2 [37,39−41].
- Although the present study was relatively novel and could further expand our knowledge of the detrimental effects of a pro-inflammatory diet, there are some limitations that should be considered. Firstly, because of the cross-sectional nature of the study, we could not infer causality. Another limitation was the small sample size. Moreover, when using an FFQ, the risk of recall bias is substantial. Additionally, since our study population only included the elderly, our results cannot be extended to other populations. Finally, due to financial constraints, we were unable to assess inflammatory blood markers, although doing so could have provided better insights into this topic.
Discussion
- In conclusion, our findings indicated no association between a higher EDII and musculoskeletal pain in older adults. However, further investigations with a larger sample size, longitudinal and interventional design, and different populations are required to deepen our knowledge of the association between dietary indices and musculoskeletal pain.
Conclusion
-
Ethics Approval
All patients were informed about the characteristics of the study and signed a written informed consent form. The study protocol was reviewed and approved by the local ethical committee of Islamic Azad University, Tehran, Iran (Code: 1397.174.IR.IAU.SRB.REC).
-
Conflicts of Interest
The authors have no conflicts of interest to declare.
-
Funding
None.
-
Availability of Data
All data generated or analyzed during this study are included in this published article. Other data may be requested from the corresponding author.
-
Authors’ Contributions
Conceptualization: MaR, ADM, AD; Formal Analysis: MaR, ZT; Investigation: MaR, ZT, ZE, SD, AE, MMD, MoR; Methodology: MaR, ADM, AD; Resources: MaR, ZT, ZE, SD, AE; Project administration: ADM, AD; Supervision: ADM, AD; Writing–original draft: MaR; Writing–review & editing: all authors. All authors read and approved the final manuscript.
Article information
Figure andTables
| Variable | Mild pain (n=133, 62.7%) | Severe pain (n=79, 37.3%) | p |
|---|---|---|---|
| Age (y) | 66.57±5.74 | 66.11±5.63 | 0.55 |
| No. of family members | 4.77±1.28 | 5.44±1.78 | 0.05* |
| No. of household members | 2.42±1.20 | 2.76±1.15 | 0.13 |
| Postmenopausal age (y) | 47.12±5.51 | 47.58±5.51 | 0.75 |
| Physical activity (min) | 39.63±28.25 | 34.76±41.15 | 0.52 |
| Sleep duration (min) | 431.14±86.39 | 415.03±114.36 | 0.44 |
| Study duration (min) | 61.59±85.16 | 51.92±65.50 | 0.46 |
| Weight (kg) | 74.67±8.71 | 73.02±11.65 | 0.45 |
| Height (cm) | 162.46±9.25 | 158.26±8.08 | 0.01* |
| WC (cm) | 96.57±8.06 | 97.90±11.12 | 0.52 |
| WHR (cm) | 0.86±0.07 | 0.88±0.07 | 0.17 |
| WHtR (cm) | 0.59±0.06 | 0.61±0.07 | 0.09 |
| BMI (kg/m2) | 0.36±4.22 | 29.15±3.76 | 28.43 |
| EDII | 0.15±0.66 | 1.10±0.72 | 0.97 |
| Sex | 0.01* | ||
| Male | 37 (77.1) | 11 (22.9) | |
| Female | 96 (58.5) | 68 (41.5) | |
| Marital status | 0.02* | ||
| Married | 104 (67.5) | 50 (32.5) | |
| Other | 29 (50.0) | 29 (50.0) | |
| Head of the family | 0.01* | ||
| Father | 23 (47.9) | 25 (52.1) | |
| Mother | 105 (66.9) | 52 (33.1) | |
| Education | 0.01* | ||
| Diploma or lower | 87 (57.6) | 64 (42.4) | |
| Upper diploma | 46 (75.4) | 15 (24.6) | |
| Spouse education | 0.001* | ||
| Diploma or lower | 74 (54.8) | 61 (45.2) | |
| Upper diploma | 57 (77.0) | 17 (23.0) | |
| Economic status | 0.004* | ||
| Very bad | 4 (44.4) | 5 (55.6) | |
| Bad | 14 (45.2) | 17 (54.8) | |
| Average | 45 (55.6) | 36 (44.4) | |
| Good | 12 (66.7) | 6 (33.3) | |
| Very good | 57 (79.2) | 15 (20.8) |
Data are presented as mean±standard deviation or n (%).
WC, waist circumference; WHR, waist-to-hip ratio; WHtR, waist-to-height ratio; BMI, body mass index; EDII, empirical dietary inflammatory index.
* Considered significant. p<0.05, the Student t-test was used to compare mean differences of quantitative variables, and the chi-square test was used for qualitative variables.
| Variable | Severe pain (n=79, 37.3%) | Mild pain (n=133, 62.7%) | p |
|---|---|---|---|
| Medication | |||
| Gastrointestinal | 27 (60.0) | 18 (40.0) | 0.01* |
| Diabetes | 54 (54.5) | 45 (45.5) | 0.40 |
| Cardiovascular | 10 (35.7) | 18 (64.3) | 0.02* |
| Psychological | 26 (48.1) | 28 (51.9) | 0.002* |
| Supplements | |||
| Vitamin D | 86 (58.5) | 61 (41.5) | 0.03* |
| Multivitamins | 50 (62.5) | 30 (37.5) | 0.54 |
| Minerals | 64 (60.4) | 62 (39.6) | 0.32 |
| BMI status | 0.71 | ||
| Underweight | 8 (72.7) | 3 (27.3) | |
| Normal | 86 (63.2) | 50 (36.8) | |
| Overweight | 39 (60.0) | 26 (40.0) | |
| WC status | 0.37 | ||
| Normal | 22 (66.7) | 11 (33.3) | |
| Abdominal obesity | 110 (61.8) | 68 (38.2) | |
| WHR status | 0.27 | ||
| Normal | 71 (65.1) | 38 (34.9) | |
| Abdominal obesity | 62 (60.2) | 41 (39.8) | |
| WHtR status | 0.36 | ||
| Normal | 57 (64.8) | 31 (35.2) | |
| Abdominal obesity | 76 (61.3) | 48 (38.7) |
Data are presented as n (%).
BMI, body mass index; WC, waist circumference; WHR, waist-to-hip ratio; WHtR, waist-to-height ratio.
* Considered significant. p<0.05, the Student t-test was used to compare mean differences of quantitative variables, and the chi-square test was used for qualitative variables.
| Nutrients and food group T |
EDII score |
|||
|---|---|---|---|---|
| p | T3 (n=68) | T2 (n=68) | T1 (n=65) | |
| Total energy (kcal/day) | 0.01* | 2,623.42±1,525.00 | 1,972.34±193.98 | 2,074.55±1,435.33 |
| Carbohydrate (% of energy) | 0.09 | 91.03±57.32 | 70.91±35.48 | 78.34±58.61 |
| Protein (% of energy) | 0.04* | 408.37±286.76 | 303.49±130.84 | 320.08±272.28 |
| Total fat (% of energy) | 0.001* | 78.86±31.90 | 60.81±22.10 | 64.19±28.72 |
| Saturated fat (% of energy) | 0.01* | 23.58±10.27 | 19.46±7.96 | 19.13±8.19 |
| Monounsaturated fat (% of energy) | 0.04* | 24.53±10.57 | 20.20±8.01 | 20.96±10.59 |
| Polyunsaturated fat (% of energy) | 0.01* | 15.81±7.93 | 12.17±5.26 | 13.21±7.65 |
| Fiber (g/1,000 kcal) | 0.01* | 64.29±74.53 | 37.42±18.71 | 40.54±42.79 |
| Food groups (serving/day) | ||||
| Tea | 0.30 | 2.15±1.58 | 2.23±2.01 | 2.71±3.00 |
| Coffee | 0.41 | 0.07±0.19 | 0.05±0.13 | 0.11±0.41 |
| Dark yellow vegetables | 0.85 | 0.22±0.20 | 0.20±0.22 | 0.20±0.28 |
| Leafy green vegetables | 0.26 | 0.49±0.87 | 0.47±0.40 | 0.34±0.25 |
| Snacks | 0.43 | 0.15±0.95 | 0.05±0.13 | 0.02±0.08 |
| Fruit juice | 0.24 | 0.09±0.27 | 0.04±0.09 | 0.14±0.50 |
| Pizza | 0.10 | 0.02±0.04 | 0.02±0.03 | 0.04±0.08 |
| Processed meat | 0.03* | 0.09±0.17 | 0.03±0.08 | 0.05±0.10 |
| Red meat | 0.01* | 0.60±0.54 | 0.57±0.46 | 0.38±0.36 |
| Organ meat | 0.36 | 0.01±0.04 | 0.02±0.04 | 0.01±0.02 |
| Other fish | 0.03* | 0.21±0.26 | 0.13±0.15 | 0.12±0.20 |
| Other vegetables | 0.001* | 2.14±1.35 | 1.15±0.64 | 0.83±0.52 |
| Refined grains | 0.001* | 5.65±5.69 | 2.42±1.57 | 1.63±1.37 |
| Tomatoes | 0.001* | 1.39±0.99 | 0.93±0.66 | 0.52±0.37 |
| Beverages | 0.24 | 2.22±1.58 | 2.28±2.01 | 2.83±3.03 |
| Variable | Severe pain (32.3%) | Mild pain (62.7%) | p |
|---|---|---|---|
| EDII | 0.01* (2-sided tail: 0.006)* | ||
| 1st tertile (n=71) (≤0.69) | 47 (66.2) | 24 (33.8) | |
| 2nd tertile (n=72) (0.70−1.14) | 49 (68.1) | 23 (31.9) | |
| 3rd tertile (n=69) (≥1.15) | 37 (53.6) | 32 (46.4) | |
| EDII | 0.28 | ||
| 1st tertile | 47 (66.2) | 24 (33.8) | |
| Other tertiles | 86 (61.0) | 55 (39.0) | |
| EDII | 0.04* | ||
| Other tertiles | 96 (67.1) | 47 (32.9) | |
| 3rd tertile | 37 (53.6) | 32 (46.4) | |
| EDII | 0.09 | ||
| 1st tertile | 47 (66.2) | 24 (33.8) | |
| 3rd tertile | 37 (53.6) | 32 (46.4) |
| Variable | R | R2 | AR2 | B | Beta | 95% CI | p |
|---|---|---|---|---|---|---|---|
| Crude | 0.07 | 0.01 | 0.00 | 1.39 (1.41) | 0.07 | −1.40 to 4.17 | 0.32 |
| Model 1 | 0.38 | 0.15 | 0.14 | 2.94 (1.59) | 0.20 | 0.06 to 0.26 | <0.001* |
| Model 2 | 0.43 | 0.19 | 0.17 | 3.25 (1.59) | −0.13 | −2.09 to −0.03 | 0.05 |
| Model 3 | 0.39 | 0.15 | 0.11 | −0.47 (0.54) | −0.06 | −1.54 to 0.60 | 0.39 |
EDII, empirical dietary inflammatory index; model 1, adjusted for age and sex; model 2, adjusted for age, sex, education, and economic status; model 3, adjusted for age, sex, education, economic status, physical activity, body mass index, energy intake, and economic status.
* Considered significant.
- 1. Macfarlane GJ, Beasley M, Jones EA, et al. The prevalence and management of low back pain across adulthood: results from a population-based cross-sectional study (the MUSICIAN study). Pain 2012;153:27−32.ArticlePubMed
- 2. Blyth FM, Briggs AM, Schneider CH, et al. The global burden of musculoskeletal pain: where to from here? Am J Public Health 2019;109:35−40.ArticlePubMedPMC
- 3. Tuzun EH. Quality of life in chronic musculoskeletal pain. Best Pract Res Clin Rheumatol 2007;21:567−79.ArticlePubMed
- 4. van Schaardenburg D, Van den Brande KJ, Ligthart GJ, et al. Musculoskeletal disorders and disability in persons aged 85 and over: a community survey. Ann Rheum Dis 1994;53:807−11.ArticlePubMedPMC
- 5. Cote P, van der Velde G, Cassidy JD, et al. The burden and determinants of neck pain in workers: results of the Bone and Joint Decade 2000-2010 Task Force on Neck Pain and Its Associated Disorders. Spine (Phila Pa 1976) 2008;33(4 Suppl):S60−74.
- 6. Woolf AD, Pfleger B. Burden of major musculoskeletal conditions. Bull World Health Organ 2003;81:646−56.PubMedPMC
- 7. Richards RS, Roberts TK, McGregor NR, et al. Blood parameters indicative of oxidative stress are associated with symptom expression in chronic fatigue syndrome. Redox Rep 2000;5:35−41.ArticlePubMed
- 8. Generaal E, Vogelzangs N, Macfarlane GJ, et al. Basal inflammation and innate immune response in chronic multisite musculoskeletal pain. Pain 2014;155:1605−12.ArticlePubMed
- 9. Kirsch Micheletti J, Blafoss R, Sundstrup E, et al. Association between lifestyle and musculoskeletal pain: cross-sectional study among 10,000 adults from the general working population. BMC Musculoskelet Disord 2019;20:609. PubMedPMC
- 10. Galland L. Diet and inflammation. Nutr Clin Pract 2010;25:634−40.ArticlePubMedPDF
- 11. Dai J, Jones DP, Goldberg J, et al. Association between adherence to the Mediterranean diet and oxidative stress. Am J Clin Nutr 2008;88:1364−70.PubMed
- 12. Zhang H, Tsao R. Dietary polyphenols, oxidative stress and antioxidant and anti-inflammatory effects. Curr Opin Food Sci 2016;8:33−42.Article
- 13. Macphail K. C-reactive protein, chronic low back pain and, diet and lifestyle. Int Musculoskelet Med 2015;37:29−32.Article
- 14. Sutliffe JT, Wilson LD, de Heer HD, et al. C-reactive protein response to a vegan lifestyle intervention. Complement Ther Med 2015;23:32−7.ArticlePubMed
- 15. Hu FB. Dietary pattern analysis: a new direction in nutritional epidemiology. Curr Opin Lipidol 2002;13:3−9.ArticlePubMed
- 16. Kanauchi M, Shibata M, Iwamura M. A novel dietary inflammatory index reflecting for inflammatory ageing: technical note. Ann Med Surg (Lond) 2019;47:44−6.ArticlePubMedPMC
- 17. Tabung FK, Smith-Warner SA, Chavarro JE, et al. Development and validation of an empirical dietary inflammatory index. J Nutr 2016;146:1560−70.ArticlePubMedPMC
- 18. Lee DH, Li J, Li Y, et al. Dietary inflammatory and insulinemic potential and risk of type 2 diabetes: results from three prospective U.S. cohort studies. Diabetes Care 2020;43:2675−83.ArticlePubMedPMCPDF
- 19. Farhadnejad H, Tehrani AN, Jahromi MK, et al. The association between dietary inflammation scores and non-alcoholic fatty liver diseases in Iranian adults. BMC Gastroenterol 2022;22:267. ArticlePubMedPMCPDF
- 20. Valipour G, Esmaillzadeh A, Azadbakht L, et al. Adherence to the DASH diet in relation to psychological profile of Iranian adults. Eur J Nutr 2017;56:309−20.ArticlePubMedPDF
- 21. Safarpour M, Dorosty Motlagh A, Hosseini SM, et al. Prevalence and outcomes of food insecurity and its relationship with some socioeconomic factors. Knowl Health 2014;8:193−8.
- 22. Farhangi MA, Jahangiry L. Dietary diversity score is associated with cardiovascular risk factors and serum adiponectin concentrations in patients with metabolic syndrome. BMC Cardiovasc Disord 2018;18:68. ArticlePubMedPMCPDF
- 23. Shakeri Z, Mirmiran P, Khalili-Moghadam S, et al. Empirical dietary inflammatory pattern and risk of metabolic syndrome and its components: Tehran Lipid and Glucose Study. Diabetol Metab Syndr 2019;11:16. ArticlePubMedPMCPDF
- 24. Alghadir AH, Anwer S, Iqbal A, et al. Test-retest reliability, validity, and minimum detectable change of visual analog, numerical rating, and verbal rating scales for measurement of osteoarthritic knee pain. J Pain Res 2018;11:851−6.PubMedPMC
- 25. Idvall E, Brudin L. Do health care professionals underestimate severe pain more often than mild pain? Statistical pitfalls using a data simulation model. J Eval Clin Pract 2005;11:438−43.ArticlePubMed
- 26. Wang Z, Hoy WE. Waist circumference, body mass index, hip circumference and waist-to-hip ratio as predictors of cardiovascular disease in Aboriginal people. Eur J Clin Nutr 2004;58:888−93.ArticlePubMedPDF
- 27. Janssen I, Katzmarzyk PT, Ross R. Waist circumference and not body mass index explains obesity-related health risk. Am J Clin Nutr 2004;79:379−84.ArticlePubMed
- 28. Ainsworth BE, Haskell WL, Whitt MC, et al. Compendium of physical activities: an update of activity codes and MET intensities. Med Sci Sports Exerc 2000;32(9 Suppl):S498−504.Article
- 29. Phillips CM, Shivappa N, Hebert JR, et al. Dietary inflammatory index and biomarkers of lipoprotein metabolism, inflammation and glucose homeostasis in adults. Nutrients 2018;10:1033. ArticlePubMedPMC
- 30. Bagheri A, Hashemi R, Soltani S, et al. The relationship between food-based pro-inflammatory diet and sarcopenia: findings from a cross-sectional study in Iranian elderly people. Front Med (Lausanne) 2021;8:649907. ArticlePubMedPMC
- 31. Calder PC. Fatty acids and inflammation: the cutting edge between food and pharma. Eur J Pharmacol 2011;668 Suppl 1:S50−8.ArticlePubMed
- 32. Kalogeropoulos N, Panagiotakos DB, Pitsavos C, et al. Unsaturated fatty acids are inversely associated and n-6/n-3 ratios are positively related to inflammation and coagulation markers in plasma of apparently healthy adults. Clin Chim Acta 2010;411:584−91.ArticlePubMed
- 33. Enrico VT. Dietary inflammatory index and chronic pain in an adult, non-institutionalized civilian population of the US. Memorial University of Newfoundland; 2017.
- 34. Toopchizadeh V, Dolatkhah N, Aghamohammadi D, et al. Dietary inflammatory index is associated with pain intensity and some components of quality of life in patients with knee osteoarthritis. BMC Res Notes 2020;13:448. ArticlePubMedPMCPDF
- 35. Correa-Rodriguez M, Casas-Barragan A, Gonzalez-Jimenez E, et al. Dietary inflammatory index scores are associated with pressure pain hypersensitivity in women with fibromyalgia. Pain Med 2020;21:586−94.ArticlePubMedPDF
- 36. Lakhan SE, Ford CT, Tepper D. Zingiberaceae extracts for pain: a systematic review and meta-analysis. Nutr J 2015;14:50. ArticlePubMedPMCPDF
- 37. Xu Q, Zhang ZF, Sun WX. Effect of naringin on monosodium iodoacetate-induced osteoarthritis pain in rats. Med Sci Monit 2017;23:3746−51.ArticlePubMedPMC
- 38. Filho AW, Filho VC, Olinger L, et al. Quercetin: further investigation of its antinociceptive properties and mechanisms of action. Arch Pharm Res 2008;31:713−21.ArticlePubMedPDF
- 39. Wang W, Chen J, Mao J, et al. Genistein ameliorates non-alcoholic fatty liver disease by targeting the thromboxane A2 pathway. J Agric Food Chem 2018;66:5853−9.PubMed
- 40. Al-Sayed E, Abdel-Daim MM. Analgesic and anti-inflammatory activities of epicatechin gallate from Bauhinia hookeri. Drug Dev Res 2018;79:157−64.ArticlePubMedPDF
- 41. Bjorklund G, Aaseth J, Dosa MD, et al. Does diet play a role in reducing nociception related to inflammation and chronic pain? Nutrition 2019;66:153−65.ArticlePubMed
References
Figure & Data
References
Citations
- Association between dietary inflammatory index and musculoskeletal disorders in adults
Firoozeh Khamoushi, Davood Soleimani, Farid Najafi, Neshat Ahmadi, Neda Heidarzadeh-Esfahani, Bita Anvari, Ebrahim Shakiba, Yahya Pasdar
Scientific Reports.2023;[Epub] CrossRef
 Cite
Cite
