
Articles
- Page Path
- HOME > Osong Public Health Res Perspect > Volume 12(5); 2021 > Article
-
Original Article
Analysis of risk factors affecting suicidal ideation in South Korea by life cycle stage -
Ji-Young Hwang1
 , Il-Su Park2
 -
Osong Public Health and Research Perspectives 2021;12(5):314-323.
DOI: https://doi.org/10.24171/j.phrp.2021.0208
Published online: October 26, 2021
1Community Health Survey Team, Dongguk University, Gyeongju, Korea
2Department of Healthcare Management, Dong-eui University, Busan, Korea
- Corresponding author: Il-Su Park Department of Healthcare Management, Dong-eui University, 176 Eomgwang-ro, Busan 47340, Korea E-mail: ispark@deu.ac.kr
- This paper is a revised and supplemented version of the first author’s master’s thesis from Uiduk University.
• Received: July 29, 2021 • Revised: September 15, 2021 • Accepted: October 12, 2021
© 2021 Korea Disease Control and Prevention Agency.
This is an open access article under the CC BY-NC-ND license (http://creativecommons.org/licenses/by-nc-nd/4.0/).
Abstract
-
Objectives
- This study analyzed risk factors for suicidal ideation in South Koreans from a life cycle perspective.
-
Methods
- A secondary analysis was conducted of data collected in 2015 as part of the 6th Korea National Health and Nutrition Examination Survey (KNHANES). The participants comprised 5,935 individuals aged 12 years or older. The statistical analysis reflected the complex sampling design of the KNHANES, and the Rao-Scott chi-square test and multiple logistic regression analysis were performed.
-
Results
- The prevalence of suicidal ideation was 5.7% in adolescents, 3.7% in young adults, 5.4% in middle-aged adults, and 7.0% in older adults. Depression and stress were risk factors in every stage of the life cycle. In those aged 12 to 19 years, activity restrictions were significantly associated with suicidal ideation. Education and subjective health status were risk factors in adults aged 20 to 39 years, and education, activity restrictions, and quality of life were the major risk factors in those aged 40 to 64 years. For adults 65 years of age or older, the risk of suicidal ideation was higher among those with inappropriate sleep time.
-
Conclusion
- The risk factors for suicidal ideation were found to be different across stages of the life cycle. This suggests a need for individualized suicide prevention plans and specific government policies that reflect the characteristics of each life cycle stage.
- Keywords: Life cycle stages; Risk factors; Suicidal ideation
- The death rate due to suicide in South Korea is 24.6 per 100,000 persons, ranking first among Organization for Economic Cooperation and Development (OECD) countries [1]. Suicide is among the top 5 causes of death in South Korea according to national statistics [2]. In 2017, it ranked first among causes of death in 10s, 20s and 30s, second in aged 40s and 50s, and fourth in aged 60 or older [2]. Therefore, recognizing suicide as a serious social problem (i.e., not just a personal problem), identifying the main factors associated with suicide, and preparing measures to prevent suicide are important policy issues in South Korea. Research on suicide is actively underway. Because it is impossible to enroll people who have actually committed suicide as participants in studies, researchers have analyzed suicide notes or conduct research among people who survived suicide attempts [3−5], but it is difficult to obtain representative results using these methods [6].
- Suicidal ideation, which is used as the primary indicator for predicting suicide, is a decisive factor that leads to actual suicide by functioning as a prerequisite for suicide planning and suicide attempts [7,8]. A study of risk factors for suicidal thoughts, suicide plans, and suicide attempts in 17 countries reported that participants with suicidal ideation were at high risk of planning and attempting suicide within a year [9]. Therefore, if a study aims to identify risk factors for suicide with the goal of applying the results for suicide prevention, it may be more effective to study those who have considered suicide rather than focusing only on those who have attempted suicide [10].
- In 2010, Japan had the second-highest suicide rate among OECD countries, but its suicide rate thereafter declined for 6 years, and it ranked fifth in 2017 [1]. It has been reported that Japan's government-wide suicide program had a significant impact on the continuing decline in the suicide rate. In particular, this anti-suicide program implemented generation-specific measures to prevent suicide beyond efforts targeting national and regional levels [11]. Japan's systematic suicide prevention strategy has substantial implications for suicide prevention measures and related policies in South Korea. In order to establish an anti-suicide policy, it is necessary to select a clear and specific target and develop and implement a program accordingly. Most previous studies on suicide-related factors in South Korea were conducted in specific age groups, and some previous studies were limited to certain stages of the life cycle, such as adolescence, adulthood, and old age [12−16]. Thus, the range of selection of subjects for research has been quite limited.
- Suicide is an extreme act stemming from various motives, negative life events, or stress. It is difficult to explain suicide in terms of any single specific reason, biological, psychological, or socioeconomic cause, or cultural values [17]. Developmental characteristics, developmental tasks to be achieved, and experiences of the surrounding environment vary throughout the life cycle [18]. Therefore, individuals also face different psychological, social, economic, and cultural issues at various stages in life. For this reason, studies aiming to identify risk factors for suicidal ideation should analyze this phenomenon with more subdivided from a life cycle perspective, instead of limiting the analysis to specific regions and age groups.
- This study analyzed risk factors for suicidal ideation among adolescents (12−19 years), young adults (20−39 years), middle-aged adults (40−64 years), and older adults (65 years or older) from a life cycle perspective. Based on the results of this study, we discuss the necessity of establishing policies for life cycle–specific suicide prevention measures and present directions for future initiatives.
Introduction
- Study Design
- This study is a secondary analysis of data collected in the 6th Korea National Health and Nutrition Examination Survey (KNHANES), which was conducted in 2015. The KNHANES is a nationally representative cross-sectional and population-based survey, conducted by the Korea Centers for Disease Control and Prevention (now known as the Korea Disease Control and Prevention Agency).
- Participants
- The potential participants in the present study comprised 7,380 individuals aged 12 years or older who took part in the survey in 2015. After the exclusion of individuals who did not respond to the question on suicidal ideation, 5,935 participants were included in our analysis.
- Research Variables
- The dependent variable, suicidal ideation, was measured by responses (yes or no) to the following question: “Have you ever seriously thought about committing suicide in the past year?” The independent variables were demographic, socioeconomic, and health-related factors. Demographic factors included sex (male or female), family structure (single person or cohabitation of 2 or more persons), residential area (urban area or rural area). Socioeconomic factors included household income (low, middle, or high), education level (less than primary school graduate, middle school graduate, or high school graduate or higher). Health-related factors included the presence or absence of depressed mood, stress level (low or high), subjective health status (poor or good), and the presence or absence of activity restrictions. Quality of life was divided into percentiles based on answers to the EQ-5D Questionnaire (≤0.70, 0.71−0.90, or >0.90). Sleep time was evaluated using answers to a question about the average number of sleep hours per day; based on those responses, the participants were categorized based on the recommended time by age group [19]. Physical activity was categorized based on whether participants indicated that they had engaged in medium-intensity activity for more than 10 minutes in the last week.
- Statistical Analysis
- Data were analyzed using SAS ver. 9.4 (SAS Institute, Cary, NC, USA). The statistical analysis reflected the complex sampling design, and all analyzes used survey sample weights to derive unbiased estimates for data analysis. The Rao-Scott chi-square test was performed to analyze differences in suicidal ideation according to demographic, socioeconomic, and health-related factors by life cycle stage. Multiple logistic regression analysis was used to identify the factors influencing suicidal ideation according to life cycle stage. The model's predictive accuracy was identified using C-statistics. The overall framework of the study is shown in Figure 1.
Materials and Methods
- Participant Characteristics by Life Cycle
- The number of participants was 5,935 among those aged 12 and older who took part in the 6th KNHANES, which was conducted in 2015, after the exclusion of those who did not answer the suicidal ideation question. By life cycle stage, 10.3% of participants were adolescents (12−19 years), 22.7% were young adults (20−39 years), 43.7% were middle-aged (40−64 years), and 23.3% were older adults (over 65 years).
- In all age groups except for those aged 65 and older, the number of male participants exceeded the number of female participants. There were more households where 2 or more people lived together than single households, and most participants lived in cities. These demographic characteristics differed significantly by life cycle (p<0.001). The most common household income level was middle, followed in descending order by low and high, with the exception of those aged 65 and older. The most common education level in the young and middle-aged group was high school graduation or higher, whereas elementary school graduation or lower was the most common in older adults (p<0.001). Those aged 65 or older were most likely to experience depression, have poor subjective health status, have restrictions on activity, and not engage in exercise. Stress was highest in the 20 to 39 age group, and in the 12 to 19 age group, sleep was the most inadequate and participants were most likely to perceive themselves as having a low quality of life (p<0.001) (Table 1).
- Prevalence of Suicidal Ideation by Life Cycle Stage
- The prevalence of suicidal ideation was the highest among older adults. The rate of suicidal ideation was 5.7% in participants who were 12 to 19 years old, 3.7% in those aged 20 to 39 years, 5.4% in those aged 40 to 64 years, and 7.0% in those who were 65 years and older (p=0.012) (Figure 2).
- Table 2 presents a comparison of the prevalence of suicidal ideation by participants’ characteristics. In the 12 to 19 age group, the prevalence of suicidal ideation was higher in female participants (χ2=4.68, p=0.031), people with depression (χ2=49.64, p<0.001), high levels of stress (χ2=35.67, p<0.001), poor perceived health status (χ2=17.56, p<0.001), and activity restrictions (χ2=26.89, p<0.001). The percentage of participants with suicidal ideation was also significantly higher among people with a quality-of-life score of 0.71 to 0.90 (χ2=73.83, p<0.001). In the 20 to 39 age group, the prevalence of suicidal ideation differed significantly depending on participants’ level of education (χ2=22.32, p<0.001). Suicidal ideation was also more prevalent among those with depression (χ2=178.88, p<0.001), high levels of stress (χ2=45.58, p<0.001), and poor perceived health status (χ2=56.68, p<0.001). The percentage of participants with suicidal ideation was also significantly higher among people with a quality-of-life score of 0.71 to 0.90 (χ2=20.92, p<0.001) and inappropriate sleep time (χ2=4.89, p=0.027). In the middle-aged group (40−64 years), suicidal ideation was more prevalent among those living alone (χ2=9.28, p=0.002) and participants with a low household income (χ2=50.82, p<0.001) and low education level (χ2=49.07, p<0.001). The prevalence of suicidal ideation was significantly higher in participants with depression (χ2=310.84, p<0.001), high levels of stress (χ2=85.15, p<0.001), poor perceived health status (χ2=43.18, p<0.001), and activity restrictions (χ2=60.01, p<0.001). Significantly higher rates of suicidal ideation were found among people with a quality-of-life score of 0.71 to 0.90 (χ2=42.60, p<0.001), inappropriate sleep time (χ2=18.89, p<0.001), and no medium-intensity physical activity (χ2=4.30, p=0.038). In older adults (over 65 years), the prevalence of suicidal ideation was significantly higher in women (χ2=4.28, p=0.039), participants who lived alone (χ2=11.65, p=0.001), and those who lived in rural areas (χ2=6.23, p=0.013). Suicidal ideation was more prevalent among those with depression (χ2=130.43, p<0.001), high levels of stress (χ2=86.97, p<0.001), poor perceived health status (χ2=25.82, p<0.001), and activity restrictions (χ2=12.63, p<0.001). The rate of suicidal ideation was significantly higher among people with a quality-of-life score lower than 0.7 (χ2=13.74, p=0.001), inappropriate sleep time (χ2=14.41, p<0.001), and no medium-intensity physical activity (χ2=5.82, p=0.016).
- Factors Contributing to Suicidal Ideation by Life Cycle Stage
- Multiple logistic regression analysis showed that the factors contributing to suicidal ideation were different for each life cycle stage (Table 3). The first model was developed to identify factors affecting suicidal ideation in adolescents (12−19 years). The model's predictive accuracy was 88.2%, and suicidal ideation was 10.98 times more common among those who had depression than among those who did not (95% confidence interval [CI], 2.98–40.40). The risk of suicidal ideation was 5.33 times higher among participants with high levels of stress than among those with low levels of stress (95% CI, 1.51–18.85) and 5.91 times greater among those with activity limitations than among those who did not (95% CI, 1.60–21.84). In other words, the factors affecting suicidal ideation at the age of 12 to 19 were depression, stress, and activity restrictions.
- The second model was developed to identify factors contributing to suicidal ideation in young adults (20–39 years), and the model's predictive accuracy was 90.4%. Suicidal ideation risk was 6.56 times higher in those with a middle school education than in the high school graduation or higher group (95% CI, 1.33–32.32). Suicidal ideation was more common among those who reported depression (odds ratio [OR], 17.99; 95% CI, 6.51–49.68), high levels of stress (OR, 4.41; 95% CI, 1.65–11.79), and poor health status (OR, 2.75; 95% CI, 1.24–6.09).
- The predictive accuracy of the third model, which was constructed to predict the risk of suicidal ideation in middle-aged adults, was 87.5%. In this group (40–64 years), suicidal ideation risk was 2.76 times higher in those with an elementary school or lower education than in the high school graduation or higher group (95% CI, 1.46–5.20). The risk for suicidal ideation was 10.98 times higher among those who had depression than those who did not (95% CI, 6.30–19.16) and was 2.11 times greater among those with high levels of stress than among those with low levels of stress (95% CI, 1.14–3.87). Activity restrictions (OR, 1.86; 95% CI, 1.00–3.45) and low perceived quality of life (OR, 2.77; 95% CI, 1.01–7.59) also significantly affected the likelihood of suicidal ideation.
- The final model was developed to show factors affecting suicidal ideation in older adults (65 years and older). Suicidal ideation among older people was found to be affected by depression (OR, 5.98; 95% CI, 3.39–10.54), stress (OR, 3.25; 95% CI, 1.69–6.24), and sleep time (OR, 2.01; 95% CI, 1.08–3.73), with 82.9% predictive accuracy.
Results
- This study aimed to contribute to the development of suicide prevention and suicide management programs and the generation of basic data for policy establishment by identifying factors that affect suicidal ideation from a life cycle perspective. Statistically significant differences in suicidal ideation were found across life cycle stages. Suicidal ideation was most common (7.0%) in older adults, followed by adolescents (5.7%), middle-aged adults (5.4%), and young adults (3.7%). These results are similar to the findings of previous studies that above the age of 20 years, suicidal ideation increased with age. A previous study using Korean Health Panel data reported that the prevalence of suicidal ideation was 4.4% in the 19 to 39 years group and 5.6% in the 40 to 64 years group [20]. Lee’s study [8] using Korean Psycho-Social Anxiety Survey data reported that the prevalence of suicidal ideation was 4.5% in the 19 to 39 years group, 6.7% in the 40 to 64 years group and 10.5% in the 65 years and older group. This shows that policies to prevent suicide in older adults should be prioritized. The results of this study are different from those of a previous study that reported suicidal ideation in 12.8% of adolescents [21]. This discrepancy is thought to have been caused by differences in the method and time of sampling.
- The analysis in the present study of factors affecting suicidal ideation by life cycle stage showed that suicidal ideation was higher among those who were depressed or stressed in all age groups. Suicide reflects an individual's internal psychological state, and depression and stress are representative variables that indicate this psychological state. The effects of depression and stress on suicidal ideation have already been demonstrated in several previous studies [8,12,13,21]. Depression refers to the results of negative perceptions of oneself and emotional problems such as anxiety, depression, failure, loss, lethargy, and worthlessness [22], which are very closely related to suicide, as studies have shown that about 50% to 87% of people who commit suicide have depression at the time of suicide. In addition, stress refers to the psychological and physical tension a person feels when he or she is in an environment to which adaptation is difficult. If stress accumulates, people experience anxiety and tension, and long-term stress can lead to serious thoughts of suicide [23].
- The impact of activity restrictions on suicidal ideation was significant in adolescents. These results are consistent with the findings of a prior study reporting that activity-restricted adolescents were 3.86 times more likely to consider suicide than their counterparts [21]. In a study of protective factors against youth suicide, the result that physical and mental health were the personal health characteristics with the most important impact on suicide supports the finding of this study that activity-restricted adolescents had a high risk of suicidal ideation [24]. This finding suggests the need for suicide prevention programs aiming to improve the physical health of adolescents and policies that can support adolescents with activity restrictions.
- In the 20 to 39 age group, the factors influencing suicidal ideation were education level and subjective health status, and in the 40 to 64 age group, significant relationships were found for education level, activity restrictions, and quality of life. These results are consistent with the findings of a previous study, which found that educational level was a risk factor for suicidal ideation in young and middle-aged adults [8]. In general, education helps people achieve their life goals [25], and it can be inferred that low education levels among young and middle-aged adults may have affected suicidal ideation because of the potential link between low education levels and low social status and a vulnerable working environment. The previous finding that 84.2% of those who attempted suicide were high school graduates or below suggests the need to pay close attention to the possibility of suicidal ideation in people with low education levels [26]. In previous studies, subjective health status has been reported as a risk factor for suicidal ideation [27,28]. Subjective health status refers to an individual's judgment of one's health, which may differ from the individual’s actual health status. Not only does this individual judgment affect physical and psychological health, daily life, and quality of life [29,30], but dissatisfaction with health conditions can also cause problems in social interaction, potentially contributing to suicidal ideation. Activity restrictions in middle-aged women were found to have a significant impact on health-related quality of life [31], and low quality of life functioned as a mediating factor in suicidal behavior in people with depression [32]. Therefore, health policies for middle-aged adults should aim not only to prevent and manage diseases, but also to enhance physical functionality, thereby preventing activity restrictions and promoting the maintenance of high quality of life.
- Sleep time significantly affected suicidal ideation in those aged 65 years or older. In a study of adults in Taiwan, a U-shaped curve was proposed for the relationship between sleep time and suicide, with both short sleep time and sleep times of more than 8 hours associated with an increased risk of suicide, supporting this study [33]. This finding also partially aligns with previous studies that shorter sleep times in older adults can significantly increase the likelihood of suicidal ideation [34]. It remains unclear whether sleep problems are a symptom of depression or whether sleep problems themselves can lead to suicide, but several studies have established that sleep has a significant association with suicide [35]. Sleep patterns can be changed; therefore, identifying and implementing ways to improve sleep problems could make an important contribution to reducing the risk of suicide. Insomnia is triggered by various causes such as biological factors (e.g., a genetic predisposition), environmental factors (e.g., economic difficulties), and psychological causes (e.g., death of children and family members). When a clinician encounters an older adult who complains of insomnia, the focus should not be limited to insomnia symptoms; instead, the clinician should try to listen to and empathize with the psychological phenomena that underlie insomnia symptoms [36].
- Suicidal ideation is caused by a combination of factors. Thus, it is necessary to identify risk factors specific to each generation and adopt a multifaceted approach to prevent suicide. The conclusions based on the results of this study are as follows. First, establishing a suicide prevention plan requires the development and implementation of individualized programs for each stage of the life cycle. The results of Japan's generational suicide prevention measures support the need to implement such a policy [11]. Second, it is necessary for the state to prepare depression and stress management measures to prevent suicide and to actively put them into practice. Third, sleep time should be monitored and managed in older adults, and efforts should be made to identify the causes and effects of both excessive and insufficient sleep. In this study, KNHANES data were used to comprehensively identify the prevalence of suicidal ideation and related factors by life cycle. However, the data used in this study should not be compared on a yearly basis, as the wording of questions about suicide has varied across waves of the KNHANES. As a result, a limitation of this study is that it only used data from the 2015 KNHANES. Another limitation of this study is that it only analyzed suicidal ideation as a predictor of suicide because few participants reported suicide plans and suicide attempts. Therefore, follow-up research should identify variations in suicidal ideation over time and analyze suicide plans, suicide attempts, and factors that lead to suicide. Furthermore, to support the development of more specific and efficient policies, in-depth research should be conducted from a life cycle perspective that considers regional characteristics.
Discussion
-
Ethics Approval
Not applicable.
-
Conflicts of Interest
The authors have no conflicts of interest to declare.
-
Funding
None.
-
Availability of Data
All data generated or analyzed during this study are included in this published article. For other data, these may be requested through the corresponding author.
Article information
Figure 1.
Framework of the study.
KNHANES, Korea National Health and Nutrition Examination Survey; N, weighted n; QOL, quality of life.
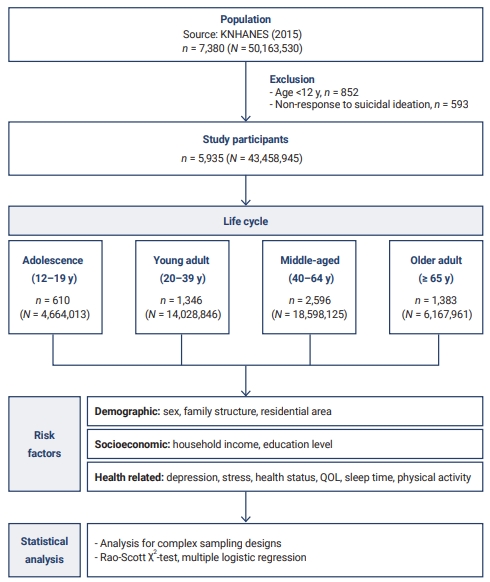
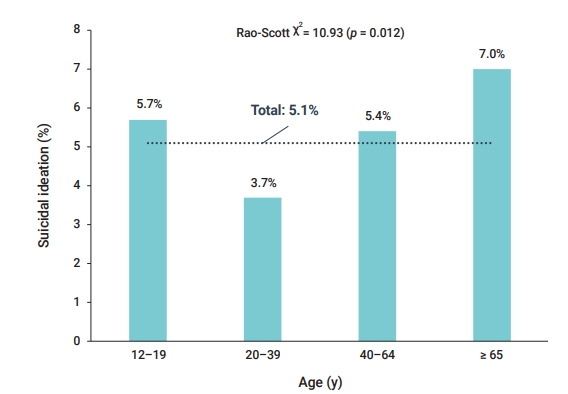
Table 1.General characteristics of the study population (n=5,935)
Table 2.Prevalence of suicidal ideation based on general characteristics by life cycle stage (n=5,935)
Table 3.Factors contributing to suicidal ideation by life cycle (n=5,935)
| Characteristic | Category | 12–19 y | 20–39 y | 40–64 y | ≥ 65 y |
|---|---|---|---|---|---|
| Demographic factor | |||||
| Sex | Male | 0.39 (0.13–1.15) | 0.99 (0.43–2.30) | 0.83 (0.49–1.42) | 1.27 (0.69–2.34) |
| Female | 1.00 | 1.00 | 1.00 | 1.00 | |
| Family structure | Single person | 0.74 (0.35–1.56) | 1.54 (0.83–2.84) | ||
| ≥Two persons | 1.00 | 1.00 | |||
| Residential area | Rural area | 1.56 (0.83–2.94) | |||
| Urban area | 1.00 | ||||
| Socioeconomic factor | |||||
| Household income | Low | 1.86 (0.81–4.25) | |||
| Middle | 1.26 (0.66–2.40) | ||||
| High | 1.00 | ||||
| Education level | ≤Primary school | 2.51 (0.45–14.00) | 2.76 (1.46–5.20)* | ||
| Middle school | 6.56 (1.33–32.32)* | 1.85 (0.95–3.63) | |||
| ≥High school | 1.00 | 1.00 | |||
| Health-related factor | |||||
| Depressive mood | Yes | 10.98 (2.98–40.40)* | 17.99 (6.51–49.68)* | 10.98 (6.30–19.16)* | 5.98 (3.39–10.54)* |
| No | 1.00 | 1.00 | 1.00 | 1.00 | |
| Stress level | High | 5.33 (1.51–18.85)* | 4.41 (1.65–11.79)* | 2.11 (1.14–3.87)* | 3.25 (1.69–6.24)* |
| Low | 1.00 | 1.00 | 1.00 | 1.00 | |
| Subjective health status | Poor | 2.87 (0.71–11.62) | 2.75 (1.24–6.09)* | 1.34 (0.81–2.22) | 1.45 (0.78–2.67) |
| Good | 1.00 | 1.00 | 1.00 | 1.00 | |
| Activity restriction | Yes | 5.91 (1.60–21.84)* | 1.86 (1.00–3.45)* | 1.35 (0.67–2.70) | |
| No | 1.00 | 1.00 | 1.00 | ||
| Quality of life | ≤0.70 | 1.57 (0.42–5.92) | 2.77 (1.01–7.59)* | 0.96 (0.32–2.85) | |
| 0.71–0.90 | 1.08 (0.42–2.77) | 0.98 (0.55–1.75) | 0.80 (0.40–1.60) | ||
| >0.90 | 1.00 | 1.00 | 1.00 | ||
| Sleep time | Inappropriate | 1.32 (0.53–3.29) | 1.27 (0.68–2.39) | 2.01 (1.08–3.73)* | |
| Appropriate | 1.00 | 1.00 | 1.00 | ||
| Medium-intensity physical activity | No | 0.94 (0.44–2.01) | 0.48 (0.20–1.19) | ||
| Yes | 1.00 | 1.00 | |||
| C-statistics | 0.882 | 0.904 | 0.875 | 0.829 |
- 1. Organization for Economic Cooperation and Development (OECD). Health at a glance 2017: OECD indicators. Paris: OECD Publishing; 2017 [cited 2020 Dec 20]. Available from: https://dx.doi.org/10.1787/health_glance-2017-en.
- 2. Statistics Korea. Cause of morbidity [Internet]. Seoul: Statistics Korea; 2017 [cited 2018 Sep 30]. Available from: https://kosis.kr/publication/publicationThema.do. Korean.
- 3. Park HM. [Suicide, choice of evil: reflection of suicide and communication orientation]. Seoul: Ehaksa; 2010. Korean.
- 4. Park JH, No YH, Wi DH. Clinical analysis of attempted suicide in the elderly. J Korean Soc Emerg Med 2001;12:135−42. Korean.
- 5. Fontalba A, Barrigon M, Anguita M. Suicide attempts in over 60 years old patients. Eur Psychiatry 2007;22:S337. Article
- 6. Lee MA, Kim SH, Park JH, et al. Factors of suicidal ideation and behavior: social relationships and family. Korea J Popul Stud 2010;33:61−84. Korean.
- 7. Han B, Compton WM, Gfroerer J, et al. Prevalence and correlates of past 12-month suicide attempt among adults with past-year suicidal ideation in the United States. J Clin Psychiatry 2015;76:295−302.ArticlePubMed
- 8. Lee SE. Risk factors for suicidal ideation across the life cycle among Korean adults: Korean psycho-social anxiety survey. Korean J Adult Nurs 2017;29:109−18. Korean.Article
- 9. Nock MK, Borges G, Bromet EJ, et al. Cross-national prevalence and risk factors for suicidal ideation, plans and attempts. Br J Psychiatry 2008;192:98−105.ArticlePubMedPMC
- 10. Ha JH, An SH. The verification of a structural relationship model of suicidal ideation to stress, coping styles, perfectionism, depression, and impulsivity. Korean J Couns Psychother 2008;20:1149−71. Korean.
- 11. Jung JW. Suicide prevention measures in Japan. Glob Soc Secur Rev 2018;4:16−26. Korean.
- 12. Park YS, Kwon Y. Validation of a path model for adolescents' suicidal ideation. J Korean Acad Community Health Nurs 2013;24:255−63.Article
- 13. Koo CY, Kim JS, Yu J. A study on factors influencing elders' suicidal ideation: focused on comparison of gender differences. J Korean Acad Community Health Nurs 2014;25:24−32.Article
- 14. Jung J, Park J. Qualitative research of the adolescent suicide attempt experience. Korean J Youth Stud 2015;7:275−305. Korean.
- 15. Choi KS. A research on the relationship between the socio-economic factors of the regions and suicidal ideation of the elderly: by utilizing the multi-level analyses. J Korea Acad-Ind Coop Soc 2016;17:584−94. Korean.Article
- 16. Kim YJ. Risk and protection factor related to suicide ideation in each life course based on an ecological-system perspective. Korean J Community Living Sci 2011;22:429−44. Korean.Article
- 17. Lee SY, Jung JW, Kim YT, et al. Suicide risk factors in various regional contexts. Seoul: Korea Institute for Health and Social Affairs; 2014. Korean.
- 18. Kwak S, Jo H, Yoon H. The perceived experiences of gender-role development and conflicts at each life stage. J Korean Women’s Stud 2005;21:147−79. Korean.
- 19. Hirshkowitz M, Whiton K, Albert SM, et al. National Sleep Foundation's sleep time duration recommendations: methodology and results summary. Sleep Health 2015;1:40−3.ArticlePubMed
- 20. Jo A, Jeon M, Oh H. Age-differentiated risk factors of suicidal ideation among young and middle-aged Korean adults. Osong Public Health Res Perspect 2017;8:201−10.ArticlePubMedPMC
- 21. Kim JS. Suicidal ideation and associated factors by sex in adolescents. J Korea Contents Assoc 2012;12:261−8. Korean.Article
- 22. Friedman RJ, Katz MM. The psychology of depression: contemporary theory and research. Washington: John Wiley & Sons; 1974.
- 23. Holkup PA. Evidence-based protocol elderly suicide: secondary prevention. J Gerontol Nurs 2003;29:6−17.Article
- 24. Kim BY, Lee CS. A meta-analysis of variables related to suicidal ideation in adolescents. J Korean Acad Nurs 2009;39:651−61. Korean.ArticlePubMed
- 25. Um HJ, Jun HJ. Predictive factors for mid-aged male and female adults’ suicidal ideation. Ment Health Soc Work 2014;42:35−62. Korean.
- 26. Ministry of Health and Welfare. 2013 National survey on suicide: policy report. Sejong, KR: Ministry of Health and Welfare; 2014.
- 27. Jung ES, Shim MS. Factors influencing suicidal ideation by age group in adults. J Korean Public Health Nurs 2016;30:326−36. Korean.Article
- 28. Jeon HG, Sim JM, Lee KC. An empirical analysis of effects of depression on suicidal ideation of Korean adults: emphasis on 2008~2012 KNHANES dataset. J Korea Contents Assoc 2015;15:264−81. Korean.Article
- 29. Lee G, Ma RW. A study on the perceived health status among the elderly in local communities. J Korean Gerontol Soc 2013;33:881−93. Korean.
- 30. Oh YH, Bae HO, Kim YS. A study on physical and mental function affecting self-perceived health of older persons in Korea. J Korean Gerontol Soc 2006;26:461−76. Korean.
- 31. Kim MA, Choi SE, Moon JH. Effect of heath behavior, physical health and mental health on heath-related quality of life in middle aged women: by using the 2014 Korea Health Panel Data. J Korean Acad Soc Home Care Nurs 2019;26:72−80. Korean.
- 32. Park SK, Lee SW, Park YJ. Depression experience and suicidal behavior among menopausal middle-aged women in Korea: mediating effects of health related quality of life and moderating effects of income. J Korea Contents Assoc 2017;17:110−22. Korean.
- 33. Gunnell D, Chang SS, Tsai MK, et al. Sleep and suicide: an analysis of a cohort of 394,000 Taiwanese adults. Soc Psychiatry Psychiatr Epidemiol 2013;48:1457−65.ArticlePubMed
- 34. Won J, Yi H. Factors affecting the suicidal ideation of the elderly living in the community: focused on sleep and depression. J Converg Cult Technol 2019;5:287−97. Korean.Article
- 35. Yoon HK. Sleep and suicide. Sleep Med Psychophysiol 2016;23:5−9. Korean.Article
- 36. Han EK, Kim DR, Suh YJ, et al. Experience of insomnia symptoms in the elderly living alone in the community. J Korean Acad Psychiatr Ment Health Nurs 2020;29:207−17. Korean.Article
References
Figure & Data
References
Citations
Citations to this article as recorded by 
- Association between long working hours and the development of suicidal ideation among female workers: An 8-year population-based study using the Korean Longitudinal Survey of Women & Family (2012–2020)
Seong-Uk Baek, Yu-Min Lee, Jin-Ha Yoon
Psychiatry Research.2024; 333: 115731. CrossRef - Alcohol Consumption and Quality of Life in Middle-aged Men
Jeong-Sook Lee
International Journal of High Risk Behaviors and A.2023;[Epub] CrossRef - Factors Related to Suicidal Ideation by Gender and Age Group in Korean Adults
Eun Young Kim, Yong Whi Jeong, Jihye Lim, Dae Ryong Kang
Journal of Korean Medical Science.2023;[Epub] CrossRef - Association between Sleep Duration and Symptoms of Depression Aged between 18 and 49: The Korea National Health and Nutrition Examination Survey (KNHANES Ⅶ) from 2016 to 2018
Sung-Yong Choi, Ji-Eun Han, Jiae Choi, Minjung Park, Soo-Hyun Sung, Angela Dong-Min Sung
Healthcare.2022; 10(11): 2324. CrossRef
 PubReader
 ePub Link
 Cite
Cite

