
Articles
- Page Path
- HOME > Osong Public Health Res Perspect > Volume 12(4); 2021 > Article
-
Original Article
Perceptions of the COVID-19 vaccine and willingness to receive vaccination among health workers in Nigeria -
Oluseyi Ademola Adejumo1
 , Olorunfemi Akinbode Ogundele2, Cynthia Roli Madubuko3, Rosena Olubanke Oluwafemi4, Ogochukwu Chinedum Okoye5, Kenechukwu Chukwuemeka Okonkwo1, Sunday Samson Owolade1, Oladimeji Adedeji Junaid1, Olutoyin Morenike Lawal1, Adenike Christianah Enikuomehin1, Maureen Iru Ntaji6, Aisha Sokunbi3, Aina Omodele Timothy3, Olatunji Sunday Abolarin1, Emmanuel Olalekan Ali1, John Oghenevwirhe Ohaju-Obodo5
 -
Osong Public Health and Research Perspectives 2021;12(4):236-243.
DOI: https://doi.org/10.24171/j.phrp.2021.0023
Published online: July 19, 2021
1Department of Internal Medicine, University of Medical Sciences, Ondo City, Nigeria
2Department of Community Medicine, University of Medical Sciences, Ondo City, Nigeria
3Department of Internal Medicine, University of Benin Teaching Hospital, Benin City, Nigeria
4Department of Paediatrics, University of Medical Sciences, Ondo City, Nigeria
5Department of Internal Medicine, Delta State University, Abraka, Nigeria
6Department of Community Medicine, Delta State University, Abraka, Nigeria
- Corresponding author: Olorunfemi Akinbode Ogundele Department of Community Medicine, University of Medical Sciences, Laje Road, PMB 536 Ondo City, Ondo State, Nigeria E-mail: femidele@gmail.com
© 2021 Korea Disease Control and Prevention Agency
This is an open access article under the CC BY-NC-ND license (http://creativecommons.org/licenses/by-nc-nd/4.0/).
Abstract
-
Objectives
- The study aimed to examine health workers’ perceptions of the coronavirus disease 2019 vaccine in Nigeria and their willingness to receive the vaccine when it becomes available.
-
Methods
- This multi-center cross-sectional study used non-probability convenience sampling to enroll 1,470 hospital workers aged 18 and above from 4 specialized hospitals. A structured and validated self-administered questionnaire was used for data collection. Data entry and analysis were conducted using IBM SPSS ver. 22.0.
-
Results
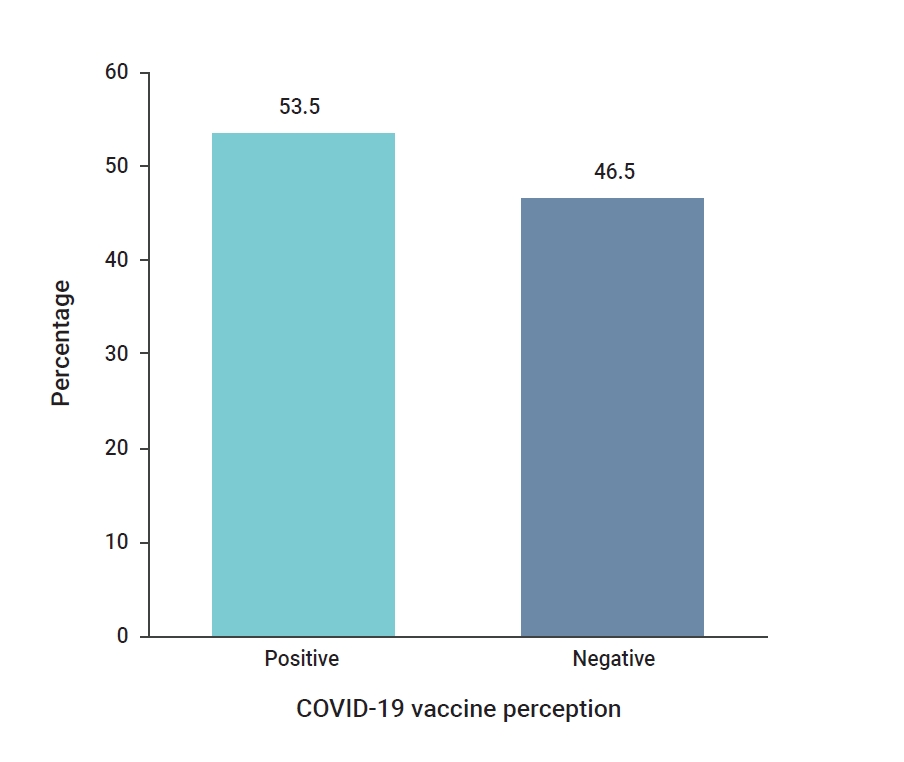
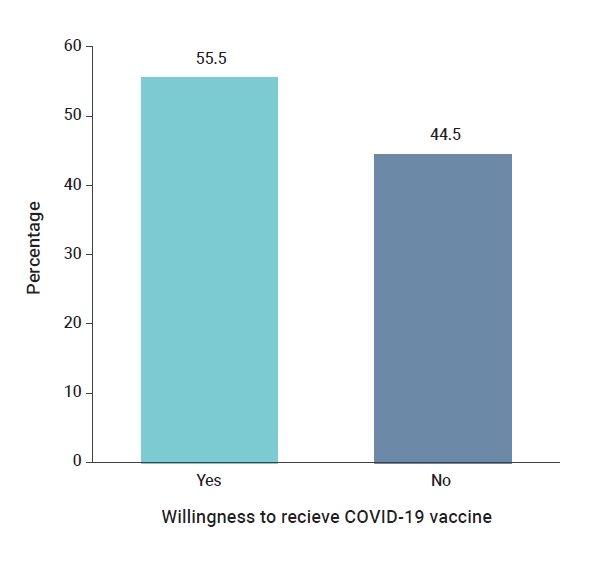
- The mean age of respondents was 40±6 years. Only 53.5% of the health workers had positive perceptions of the COVID-19 vaccine, and only slightly more than half (55.5%) were willing to receive vaccination. Predictors of willingness to receive the COVID-19 vaccine included having a positive perception of the vaccine (adjusted odds ratio [AOR], 4.55; 95% confidence interval [CI], 3.50−5.69), perceiving a risk of contracting COVID-19 (AOR, 1.50; 95% CI, 1.25–3.98), having received tertiary education (AOR, 3.50; 95% CI, 1.40−6.86), and being a clinical health worker (AOR, 1.25; 95% CI, 1.01−1.68).
-
Conclusion
- Perceptions of the COVID-19 vaccine and willingness to receive the vaccine were sub-optimal among this group. Educational interventions to improve health workers' perceptions and attitudes toward the COVID-19 vaccine are needed.
- The coronavirus disease 2019 (COVID-19) outbreak, which originated in Wuhan, China, in December 2019, has gradually spread to over 215 countries [1]. It was declared a pandemic by the World Health Organization in March 2020 [2]. Since the onset of the COVID-19 pandemic, more than 79 million cases and over 1.7 million deaths have been recorded globally as of December 29, 2020 [3].
- The COVID-19 pandemic has had a devastating effect on many countries’ economies, health systems, education systems, and infrastructure [4-6]. The disease presently has no cure, and disease management is mainly supportive. Regular hand washing, use of facemasks, social distancing, and cough etiquette are vigorously recommended to limit community transmission of the virus.
- Researchers across the world have been working assiduously to develop vaccines against the highly contagious virus. Approximately 60 COVID-19 candidate vaccines are undergoing clinical evaluations, and another 172 COVID-19 candidate vaccines are at the preclinical evaluation stage as of December 29, 2020 [7]. It is believed that some of these vaccines will be ready for use by early 2021. However, there are widespread skepticism and divergent views regarding the legitimacy of various COVID-19 vaccines among people across the globe.
- The effectiveness of vaccination programs and the global objective of eradicating the pandemic require optimal acceptance of the vaccine across all countries. The success of any vaccination program is largely dependent on how well the vaccines are accepted among the population and the willingness of people to be vaccinated. Vaccine hesitancy—a continuum that encompasses delay, reluctance, or refusal to receive a vaccine despite its availability [8]—has been found to be a major obstacle to vaccination among the general population and among health workers, and widely held perceptions of the safety of vaccines may contribute significantly to this phenomenon. COVID-19 vaccination programs, which are already ongoing in some countries, may face any of the aforementioned challenges, especially due to the novelty of the disease, perceived controversies related to its origin, and the fast-tracked development of vaccines. In tropical countries like Nigeria, some people still outrightly deny the existence of the disease due to the misconception that the virus does not thrive in hot climates. Beliefs such as this may pose additional barriers to vaccine acceptance. Health workers perceptions and willingness to receive vaccination have been documented as essential for improving vaccination rates among patients and the general population. Health workers play a key role in changing patients’ behaviors and are among the first people to understand the magnitude of the problem and are in the right position to recommend vaccination [9,10]. Thus, this study aimed to examine perceptions of the COVID-19 vaccine among health workers in Nigeria and their willingness to receive the vaccine when it becomes available. It is believed that this study will help to identify potential barriers to the success of a COVID-19 vaccination program and inform subsequent planning and implementation of such a program.
Introduction
- Study Area
- The study was conducted in October 2020 across 4 specialized hospitals located in southern Nigeria. The hospitals were the University of Medical Sciences Teaching Hospital Complex, Mother and Child Hospital (both located in Ondo State in Southwest Nigeria), University of Benin Teaching Hospital (in Edo State in South-South Nigeria), and the Delta State University Teaching Hospital (in Oghara, Delta State, located in South-South Nigeria). All the hospitals included in the study were specialized health facilities that offered a wide range of preventive and curative health services.
- Study Design and Participants
- The survey adopted a health facility-based, cross-sectional study design. We used non-probability convenience sampling to enroll 1,470 hospital workers aged 18 and above from 4 specialized hospitals included in the study. The study participants included both clinical and non-clinical health workers who were fully employed and willing to participate. We excluded trainees on attachment in the hospital and any non-consenting individuals.
- Data Collection Instrument
- A structured and validated self-administered questionnaire was used for data collection. The questionnaire was designed to meet the objective of the study and went through several drafts and reviews. We pretested the final draft of the questionnaire with 30 health workers at another health facility and made necessary modifications afterwards. The final questionnaire used in the study had 3 sections. The first section was related to the participants’ socio-demographic characteristics such as age, sex, education level, occupation in the medical field, marital status, and religion. The second section assessed their perceived risk of contracting COVID-19, and the third section assessed perceptions of the COVID-19 vaccine and respondents’ willingness to receive a potential COVID-19 vaccine. Perceptions about the COVID-19 vaccine were evaluated using 10 items that were combined into a single composite variable for analysis. The items were a mix of directly-worded and reverse-worded questions. Each item was assigned a score on a 5-point Likert scale (strongly disagree, 1; disagree, 2; undecided, 3; agree, 4; and strongly agree, 5) to capture the full range of opinions. Some of the items were reverse-coded so that higher values indicated positive perceptions of the COVID-19 vaccine. A higher score indicated that the participant had positive perceptions of the COVID-19 vaccine. The total score was determined by adding the points from all 10 items, with a maximum possible score of 50 points. The mean score was 34 points, which was used as the cutoff for classifying the participants [11]. The participants were considered to have positive perceptions of the COVID-19 vaccine if their scores were ≥34 points, while participants whose scores were <34 points were considered to have negative perceptions of the vaccine. Participants’ willingness to receive the COVID-19 vaccine and their perceived risk of contracting COVID-19 were each assessed using 1-item questions with ‘yes’ or ‘no’ responses.
- Data Analysis and Scale Assessment
- Data entry and analysis were conducted using IBM SPSS ver. 22.0 (IBM Corp., Armonk, NY, USA). Frequency and percentage distributions were used to indicate socio-demographic variables. Perceptions of the COVID-19 vaccine and willingness to receive the vaccine were presented as bar graphs. In addition, associations between socio-demographic variables, perceptions of the vaccine, and willingness to receive the COVID-19 vaccine were examined using the chi-square test. To determine the reliability of the questionnaire, Cronbach’s α reliability coefficient was used. The 10-item scale had high reliability, with a Cronbach’s α of 0.836. Multivariate logistic regression analysis was used to determine adjusted odds ratios (AORs) and 95% confidence intervals (CIs) in order to identify the predictors of participants’ willingness to receive the vaccine. The outcome variable for the multivariate analyses was willingness to receive the COVID-19 vaccine, which was classified as a dichotomous variable (‘yes’ or ‘no’). The independent variables (age, marital status, occupation within the medical field, work experience, etc.) were recategorized into dichotomous variables for bivariate and multivariate analyses. Variables with p-values <0.3 at the bivariate level were entered into the multivariable analysis [12]. The level of significance for each test was set at p<0.05.
Materials and Methods
- A total of 1,470 health workers were involved in the study. As shown in Table 1, approximately 38.2% of the participants were between 31 and 40 years old, with a mean age of 40±6 years. The majority (64.3%) were male, 61.5% were married, and 88.2% had a tertiary education. A majority of the respondents (65.2%) had fewer than 10 years of work experience (Table 1).
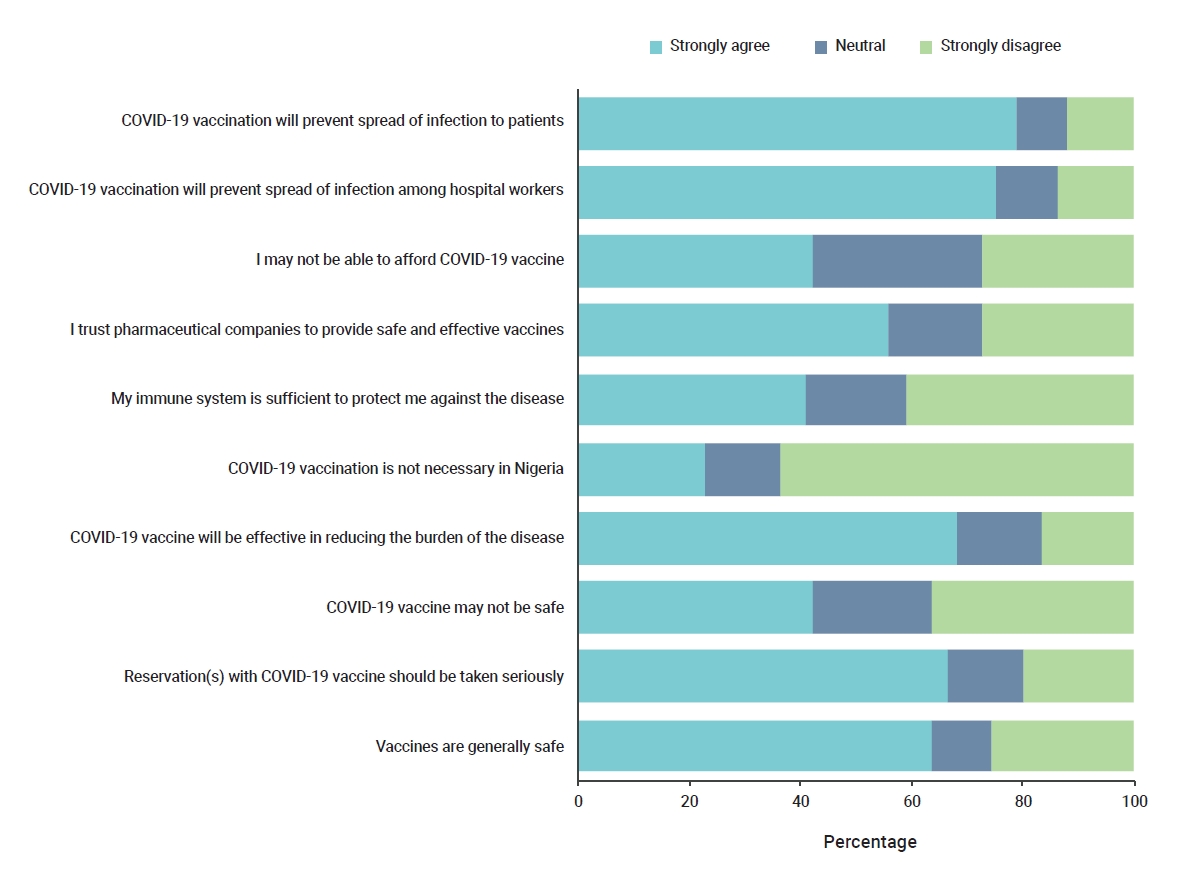
- Overall, 53.5% of the health workers had positive perceptions of the COVID-19 vaccine, while 46.5% had negative perceptions of the vaccine (Figure 1). After analyzing some of the specific items from the questionnaire, more than 80% of the health workers agreed that the vaccine would prevent the spread of infection to patients and other health workers; however, 45% felt that they might not be able to afford to obtain the vaccine. Approximately 2/3 (66.7%) of the participants had reservations regarding the vaccine, and 43% felt that the vaccine might not be safe (Figure 2), although a majority of the health workers (91.4%) perceived themselves to be at risk of contracting COVID-19. In total, only 55.5% of the health workers expressed willingness to receive the COVID-19 vaccine (Figure 3). Bivariate analysis to determine the factors associated with willingness to receive the COVID-19 vaccine revealed that health workers who had positive perceptions of the COVID-19 vaccine (72.3%) were more willing to receive COVID-19 vaccination than health workers with negative perceptions of the vaccine (p<0.001). In addition, a high percentage (57.1%) of those who perceived themselves to be at risk of contracting COVID-19 were also willing to receive the vaccine (p<0.001) (Table 2). Other factors significantly associated with willingness to receive the COVID-19 vaccine included education level (p=0.022), years of work experience (p=0.016), and one’s occupation within the medical field (p=0.013). However, age (p=0.052), marital status (p=0.290), religion (p=0.702), and sex (p=0.301) were not significantly associated with willingness to receive the COVID-19 vaccine (Table 2).
- Multivariate logistic regression analysis was used to determine the predictors of willingness to receive the COVID-19 vaccine (Table 3). Based on the analysis, predictors included having positive perceptions of the COVID-19 vaccine (AOR, 4.55; 95% CI, 3.50−5.69), perceiving a risk of COVID-19 infection (AOR, 1.50; 95% CI, 1.25–3.98), and being a clinical health worker (AOR, 1.25; 95% CI, 1.01–1.68). Having a tertiary education (AOR, 3.50; 95% CI, 1.40–6.86) and 10 or more years of work experience (AOR, 1.25; 95% CI, 1.11–3.93) were also predictors of willingness to receive the vaccine.
Results
- Our study assessed perceptions of the COVID-19 vaccine among health workers and their willingness to receive the vaccine. In this study, we found that slightly more than half (53.5%) of the health workers had positive perceptions of the COVID-19 vaccine. This finding is quite revealing, as it is often assumed that the attitudes of health workers toward vaccination will be positive due to their knowledge and training. This, however, was not the case in this study, which gives insight into the need to address this challenge which could be a major barrier to widespread acceptance of the vaccine among health workers. It has been found that perceptions of vaccines among health workers and their perceived risk of infection influence vaccination decisions [13]. The study also found that approximately 4 in 10 health workers believed that they might not be able to afford the vaccine. This finding is significant since prior studies have documented the cost of vaccines as a primary reason health workers hesitate to receive them [10].
- Notably, more than 2/3 of the health workers had reservations about receiving the vaccine even though only 43% of the participants specifically expressed safety concerns about the vaccine itself. Widespread conspiracy theories associated with the pandemic and a psychological need to understand various events surrounding the pandemic are possible explanations for this finding [14]. This finding is significant since psychosocial factors such as perceptions, emotions, trust in vaccines, and trust in vaccine providers have been found to contribute to vaccine hesitancy and refusal [15,16] and may have played a role in vaccine acceptance among these health workers.
- In this study, we also found that only slightly more than half (55.5%) of the health workers were willing to receive the COVID-19 vaccine. This finding is surprising but explainable, as it has been found that public perceptions of the risks and benefits of vaccination constitute major obstacles to vaccine acceptance [17]. Health workers, as part of the general population, are also prone to subjective judgments that impact their behaviors and vaccination decisions, which may be the case in this study despite their medical knowledge. The acceptance rate in our study is similar to the 53.5% acceptance rate among United States residents [18], but lower than the 86% acceptance rate reported by Williams et al. [19]. The higher acceptance rate reported by Williams et al. [19] may be due to their study participants’ high perceived susceptibility to COVID-19 infection since the participants in their study all had chronic respiratory illnesses. The proportion of those willing to receive the COVID-19 vaccine in our study fell short of the minimum rate of 75% required to reach herd immunity and stop the spread of the coronavirus epidemic [20]. This is alarming since our study was conducted among health workers who were expected to have a higher likelihood of being willing to receive the vaccine than the general population because of their medical knowledge. Willingness to receive the COVID-19 vaccine among our respondents was significantly associated with their perceptions of the COVID-19 vaccine, how many years of work experience they had, and their perceived risk of contracting COVID-19, which is a similar finding to previous studies [13,18,21-23]. Education level was also significantly associated with the participants’ willingness to receive the COVID-19 vaccine in this study, which is consistent with the findings of similar studies on the COVID-19 vaccine [18,24,25]. Perceptions about vaccines and their safety are important factors that have been found to affect public uptake of vaccines [18,21]. These factors may be useful for educational interventions designed to improve health workers’ perceptions and attitudes about the COVID-19 vaccine.
- In our study, perceptions of the COVID-19 vaccine and one’s perceived risk of contracting COVID-19 were strong predictors of vaccine acceptance, which is consistent with a similar study from Saudi Arabia [26]. Likewise, having a high education level was also a significant predictor of vaccine acceptance. Education and knowledge about vaccination have been found to help build trust and confidence about vaccination and may explain this finding [23]. The study also found that the occupations of health workers within the medical field and their length of work experience were predictors of willingness to receive the COVID-19 vaccine.
- This study’s strength is that it gives new insight into the perceptions of health workers regarding the COVID-19 vaccine in Nigeria, health workers’ willingness to receive the vaccine, and possible factors that may influence acceptance of the vaccine. Another strength is the large sample size and multi-center design. However, the study has some limitations. The data were cross-sectional and therefore limited when it came to inferring causal relationships between variables. Some respondents may also have given responses to some questions in the questionnaire that were widely socially accepted at the time but which may change by the time the vaccine becomes available. This was minimized, however, by explaining and reassuring participants about the study’s purpose.
- In conclusion, our findings suggest that willingness to receive COVID-19 vaccination was sub-optimal among this group of health workers and was associated with perceptions of the vaccine, the perceived risk of contracting COVID-19, education level, occupation within the medical field, and work experience. Vaccination of health workers is essential for protecting them against infectious diseases, and, considering their vital role in public health as major stakeholders in the fight against the COVID-19 pandemic and other major infectious diseases, improving vaccine acceptance among this group when it becomes available is critical. In addition, clear, well-articulated policies related to the COVID-19 vaccine are needed to combat the challenges that may arise from negative perceptions of the vaccine, concerns about affordability, and other reasons health workers cite for not obtaining vaccines.
Discussion
-
Ethics Approval
Ethical approval was obtained from the ethics and research committees of the various health institutions where the study was conducted; the University of Medical Sciences Teaching Hospital Complex, Ondo City and University of Benin Teaching Hospital, Benin City. Written informed consent was obtained from each participant. The study protocol number was ADM/E22/A/VOL.VII/1483093.
-
Conflicts of Interest
The authors have no conflicts of interest to declare.
-
Funding
None.
-
Availability of Data
The datasets that were used for the analysis and preparation of this manuscript are available upon request. Interested persons can contact (femidele@gmail.com) or (oluseyiadejumo02017@gmail.com).
-
Authors’ Contributions
Conceptualization: OAA, OAO; Methodology: all authors; Data curation: OAA, OAO; Investigation: OAA, CRM, ROO, OCO, KCO, SSO, OAJ, OML, ACE, MIN, AS, AOT, OSA, EOA, JOO; Formal analysis: OAO; Project administration: OAA; Resources: CRM, ROO, OCO, KCO, SSO, OAJ, OML, ACE, MIN, AS, AOT, OSA, EOA, JOO; Validation: OAA, CRM, ROO, OCO, KCO, SSO; Writing–original draft: OAO; Writing-review & editing: all authors.
Article information

| Category of variables | AOR (95% CI) | pa) |
|---|---|---|
| Perceptions about the COVID-19 vaccine | ||
| Negative (Ref) | 1 | |
| Positive | 4.55 (3.50–5.69) | <0.001 |
| Perceived risk for COVID-19 | ||
| ≤No (Ref) | 1 | |
| ≥Yes | 1.50 (1.25– 3.98) | 0.002 |
| Occupation within the medical field | ||
| Non-clinical (Ref) | 1 | |
| Clinical health workers | 1.25 (1.01–1.68) | 0.005 |
| Education level | ||
| Secondary and below (Ref) | 1 | |
| Tertiary | 3.50 (1.40–6.86) | 0.034 |
| Sex | ||
| Female (Ref) | 1 | |
| Male | 0.92 (0.60–2.68) | 0.512 |
| Marital status | ||
| Not married (Ref) | 1 | |
| Married | 1.02 (0.60–2.48) | 0.563 |
| Work experience (y) | ||
| ≤9 (Ref) | 1 | |
| ≥10 | 1.25 (1.11–3.93) | 0.042 |
| Age group (y) | ||
| 18–40 (Ref) | 1 | |
| ≥41 | 0.89 (0.64–1.26) | 0.527 |
- 1. World Health Organization (WHO). Coronavirus disease (COVID-19) weekly epidemiological update and weekly operational update [Internet]. Geneva: WHO; 2020 [cited 2020 Dec 29]. Available from: https://www.who.int/emergencies/diseases/novel-coronavirus-2019/situation-reports.
- 2. World Health Organization (WHO). WHO Director-General's opening remarks at the media briefing on COVID-19-11 March 2020 [Internet]. Geneva: WHO; 2020 [cited 2020 Oct 12]. Available from: https://www.who.int/dg/speeches/detail/who-director-general-s-opening-remarks-at-the-media-briefing-on-covid-19---11-march-2020.
- 3. European Centre for Disease Prevention and Control (ECDC). COVID-19 situation updates [Internet]. Solna; ECDC; Year [cited 2021Jan 7]. Available from: https://www.ecdc.europa.eu/en/geographical-distribution-2019-ncov-cases.
- 4. The World Bank. COVID-19 to plunge global economy into worst recession since World War II [Internet]. Washington, DC: The World Bank; 2020 Jun 8 [cited 2020 Oct 12]. Available from: https://www.worldbank.org/en/news/press-release/2020/06/08/covid-19-to-plunge-global-economy-into-worst-recession-since-world-war-ii.
- 5. Li C, Lalani F. The COVID-19 pandemic has changed education forever. This is how [Internet]. World Economic Forum; 2020 Apr 29 [cited 2020 Oct 12]. Available from: https://www.weforum.org/agenda/2020/04/coronavirus-education-global-covid19-online-digital-learning/.
- 6. World Health Organization (WHO). COVID-19 significantly impacts health services for noncommunicable diseases [Internet]. Geneva: WHO; 2020 [cited 2020 Nov 8]. Available from: https://www.who.int/news-room/detail/01-06-2020-covid-19-significantly-impacts-health-services-for-noncommunicable-diseases.
- 7. World Health Organization (WHO). Draft landscape of COVID-19 candidate vaccines [Internet]. Geneva: WHO; 2020 [cited 2020 Dec 29]. Available from: https://www.who.int/docs/default-source/a-future-for-children/novel-coronavirus_landscape_covid-19.pdf?sfvrsn=4d8bd201_1.
- 8. World Health Organization (WHO). Ten threats to global health in 2019 [Internet]. Geneva: WHO; 2019 [cited 2020 Dec 20]. Available from: https://www.who.int/news-room/spotlight/ten-threats-to-global-health-in-2019.
- 9. Blank PR, Schwenkglenks M, Szucs TD. Disparities in influenza vaccination coverage rates by target group in five European countries: trends over seven consecutive seasons. Infection 2009;37:390−400.ArticlePubMed
- 10. Ogundele OA, Omotosho AA. Vaccination of healthcare workers in Nigeria: a review of barriers, policies and level of implementation. Libyan J Med Sci 2020;4:9−15.
- 11. Kempe A, Saville AW, Albertin C, et al. Parental hesitancy about routine childhood and influenza vaccinations: a national survey. Pediatrics 2020;146:e20193852.ArticlePubMed
- 12. Hosmer DW, Lemeshow S. Applied logistic regression. 2nd ed. New York: John Wiley & Sons; 2000.
- 13. Betsch C. Overcoming healthcare workers vaccine refusal: competition between egoism and altruism. Euro Surveill 2014;19:20979. ArticlePubMed
- 14. van Prooijen JW, Douglas KM. Conspiracy theories as part of history: the role of societal crisis situations. Mem Stud 2017;10:323−33.ArticlePubMedPMC
- 15. Dube E, MacDonald NE. Managing the risks of vaccine hesitancy and refusals. Lancet Infect Dis 2016;16:518−9.ArticlePubMed
- 16. Ogundele OA, Ogundele T, Beloved O. Vaccine hesitancy in Nigeria: contributing factors–way forward. Niger J Gen Pract 2020;18:1−4.Article
- 17. Harmsen IA, Mollema L, Ruiter RA, et al. Why parents refuse childhood vaccination: a qualitative study using online focus groups. BMC Public Health 2013;13:1183. ArticlePubMedPMC
- 18. Guidry JPD, Laestadius LI, Vraga EK, et al. Willingness to get the COVID-19 vaccine with and without emergency use authorization. Am J Infect Control 2021;49:137−42.ArticlePubMed
- 19. Williams L, Gallant AJ, Rasmussen S, et al. Towards intervention development to increase the uptake of COVID-19 vaccination among those at high risk: Outlining evidence-based and theoretically informed future intervention content. Br J Health Psychol 2020;25:1039−54.ArticlePubMed
- 20. Bartsch SM, O'Shea KJ, Ferguson MC, et al. Vaccine efficacy needed for a COVID-19 coronavirus vaccine to prevent or stop an epidemic as the sole intervention. Am J Prev Med 2020;59:493−503.ArticlePubMedPMC
- 21. Larson HJ, de Figueiredo A, Xiahong Z, et al. The state of vaccine confidence 2016: global insights through a 67-country survey. EBioMedicine 2016;12:295−301.ArticlePubMedPMC
- 22. Wang J, Jing R, Lai X, et al. Acceptance of COVID-19 vaccination during the COVID-19 pandemic in China. Vaccines (Basel) 2020;8:482. ArticlePubMedPMC
- 23. Betsch C, Wicker S. E-health use, vaccination knowledge and perception of own risk: drivers of vaccination uptake in medical students. Vaccine 2012;30:1143−8.ArticlePubMed
- 24. Lazarus JV, Ratzan SC, Palayew A, et al. A global survey of potential acceptance of a COVID-19 vaccine. Nat Med 2021;27:225−8.ArticlePubMed
- 25. Daly M, Robinson E. Psychological distress and adaptation to the COVID-19 crisis in the United States. J Psychiatr Res 2021;136:603−9.ArticlePubMed
- 26. Magadmi RM, Kamel FO. Beliefs and barriers associated with COVID-19 vaccination among the general population in Saudi Arabia [Preprint]. Posted 2020 Aug 18. BMC Public Health 2020. https://doi.org/10.21203/rs.3.rs-48955/v1.Article
References
Figure & Data
References
Citations
- Nigerians’ attitudes and perceptions towards vaccine acceptance during and after the COVID-19 pandemic
Jonas Lotanna Ibekwe, Victor Oluwafemi Femi-Lawal, Jolly Akor Thomas, Faith Uzoamaka Okei, Moses Ojomakpenen Ojile, Oluwatobiloba Oladipupo Akingbulugbe
Journal of Medicine, Surgery, and Public Health.2024; 2: 100066. CrossRef - Knowledge, attitudes, and factors determining the willingness for COVID-19 vaccination among students in Bangladesh: An online-based cross-sectional study
Ashis Talukder, Soheli Sharmin, Chuton Deb Nath, Iqramul Haq, Md. Ismail Hossain, Md. Jakaria Habib, Sabiha Shirin Sara
Journal of Public Health.2024; 32(4): 663. CrossRef - Healthcare professionals’ perception and COVID-19 vaccination attitudes in North-Western Ghana: A multi-center analysis
Augustine Ngmenemandel Balegha, Suburu Abdul-Aziz, Louis Mornah, Pracheth Raghuveer
PLOS ONE.2024; 19(2): e0298810. CrossRef - Behavioral Insights from Vaccine Adoption in Nigeria: Cross-Sectional Survey Findings
Sohail Agha, Ifeanyi Nsofor, Drew Bernard, Sarah Francis, Nandan Rao
Interactive Journal of Medical Research.2024; 13: e47817. CrossRef - COVID-19 vaccine hesitancy in Latin America and Africa: a scoping review
Bruna Aparecida Gonçalves, Camila Carvalho de Souza Amorim Matos, Jonathan Vicente dos Santos Ferreira, Renata Fortes Itagyba, Vinicius Rocha Moço, Marcia Thereza Couto
Cadernos de Saúde Pública.2023;[Epub] CrossRef - Suspecting the Figures: What Church Leaders Think About Government’s Commitment to Combating COVID-19 in Nigeria
Uchechukwu M. Agbo, George C. Nche
Journal of Asian and African Studies.2023; 58(5): 725. CrossRef - Access to COVID-19 vaccines and testing in Africa: the importance of COVAX - Nigeria as a case study
Rafaella Fortini Queiroz Grenfell, Oyetunde Timothy Oyeyemi
Pathogens and Global Health.2023; 117(2): 152. CrossRef - COVID-19 vaccine acceptance prediction: The roles of students’ attitude towards science and mathematics and knowledge of COVID-19 pandemic
Sunday Ogbu, Ogochukwu Ebere Emenike, Amaka Loretta Nwankwo
Electronic Journal of Medical and Educational Tech.2023; 16(2): em2304. CrossRef - Factors associated with COVID-19 vaccine hesitancy among healthcare workers in Cameroon and Nigeria: a web-based cross-sectional study
Jerry Brown Aseneh, Valirie Ndip Agbor, Benjamin Momo Kadia, Elvis Anyaehiechukwu Okolie, Chinelo Janefrances Ofomata, Christie Linonge Etombi, Domin Sone M Ekaney, Yvonne Walburga Joko Fru
International Health.2023; 15(6): 702. CrossRef - Willingness to COVID-19 vaccination: Empirical evidence from EU
Imran Ur Rahman, Arslan Austin, Naveed Nelson
Heliyon.2023; 9(5): e15776. CrossRef - Radiographers’ knowledge, attitude and adherence to standard COVID-19 precautions and the policy implications: a national cross-sectional study in Nigeria
Charles Ikechukwu Ezema, Okechukwu Felix Erondu, Ogochukwu Kelechi Onyeso, Chiedozie James Alumona, Andrew Wueseter Ijever, Charity Ndidiamaka Amarachukwu, Amaeze Augustine Amaeze
Annals of Medicine.2023;[Epub] CrossRef - Declining trends in vaccine confidence across sub-Saharan Africa: A large-scale cross-sectional modeling study
A. de Figueiredo, E. Temfack, R. Tajudeen, H. J. Larson
Human Vaccines & Immunotherapeutics.2023;[Epub] CrossRef - Knowledge and acceptance of COVID-19 vaccine among healthcare workers in Enugu metropolis, Enugu state, Nigeria
Kelechi U. Imediegwu, Jude C. Abor, Chiamaka Q. Onyebuchukwu, Hilary I. Ugwu, Ogechi I. Ugwu, Udo Ego Anyaehie, Oluchi A. Onyia
Frontiers in Public Health.2023;[Epub] CrossRef - COVID-19 vaccination acceptance (uptake, hesitancy, intention to receive and timeliness of the intention to receive) and the determinants among health workers in Ebonyi state, Nigeria: an analytical cross-sectional study
Ugwu I Omale, Onyinyechukwu U Oka, Chidinma I Amuzie, Victor U Uduma, Azuka S Adeke, Cordis O Ikegwuonu, Glory E Nkwo, Ugochi I A Nwali, Osarhiemen Iyare, Richard L Ewah, Olaedo O Nnachi, Okechukwu O Ukpabi, Ifeyinwa M Okeke
BMJ Open.2023; 13(7): e068668. CrossRef - Hesitação vacinal contra a COVID-19 na América Latina e África: uma revisão de escopo
Bruna Aparecida Gonçalves, Camila Carvalho de Souza Amorim Matos, Jonathan Vicente dos Santos Ferreira, Renata Fortes Itagyba, Vinicius Rocha Moço, Marcia Thereza Couto
Cadernos de Saúde Pública.2023;[Epub] CrossRef - The Social Ecological Model: A Framework for Understanding COVID-19 Vaccine Uptake among Healthcare Workers—A Scoping Review
Damian Naidoo, Anna Meyer-Weitz, Kaymarlin Govender
Vaccines.2023; 11(9): 1491. CrossRef - Health service factors affecting the COVID-19 vaccination campaign in a Ghanaian metropolis: A qualitative exploratory study
Susanna Aba Aba Abraham, John Oti Amoah, Dorcas Frempomaa Agyare, Deogratias Kaheeru Sekimpi, Diana Bosomtwe-Duker, Andrews Adjei Druye, Gifty Osei Berchie, Dorcas Obiri-Yeboah
BMJ Open.2023; 13(12): e076184. CrossRef - ‘Why Should I Take the COVID-19 Vaccine after Recovering from the Disease?’ A Mixed-methods Study of Correlates of COVID-19 Vaccine Acceptability among Health Workers in Northern Nigeria
Zubairu Iliyasu, Muhammad R. Garba, Auwalu U. Gajida, Taiwo G. Amole, Amina A. Umar, Hadiza M. Abdullahi, Aminatu A. Kwaku, Hamisu M. Salihu, Muktar H. Aliyu
Pathogens and Global Health.2022; 116(4): 254. CrossRef - A Global Map of COVID-19 Vaccine Acceptance Rates per Country: An Updated Concise Narrative Review
Malik Sallam, Mariam Al-Sanafi, Mohammed Sallam
Journal of Multidisciplinary Healthcare.2022; Volume 15: 21. CrossRef - Knowledge, Attitudes, and Perception towards COVID-19 Vaccination among the Adult Population: A Cross-Sectional Study in Turkey
Meliha Cagla Sonmezer, Taha Koray Sahin, Enes Erul, Furkan Sacit Ceylan, Muhammed Yusuf Hamurcu, Nihal Morova, Ipek Rudvan Al, Serhat Unal
Vaccines.2022; 10(2): 278. CrossRef - Factors influencing COVID-19 vaccine uptake among adults in Nigeria
Halimat Adedeji-Adenola, Olubusola A. Olugbake, Shakirat A. Adeosun, Ismaeel Yunusa
PLOS ONE.2022; 17(2): e0264371. CrossRef - Perception and Prevention Practices Relating to Covid 19 Infection Among Elderly in Ogun State, Nigeria
Adenitire G., Agbede C.O.
International Journal of Public Health and Pharmac.2022; 2(1): 29. CrossRef - Predicting nursing students' intention to attend face‐to‐face classes on school reopening: A theory of planned behavior application
Ryan Michael F. Oducado, Jerome V. Cleofas, Gil P. Soriano
Nursing Forum.2022; 57(5): 733. CrossRef - COVID-19 vaccination in Nigeria: A rapid review of vaccine acceptance rate and the associated factors
Oluwatosin Olu-Abiodun, Olumide Abiodun, Ngozi Okafor, Nusirat Elelu
PLOS ONE.2022; 17(5): e0267691. CrossRef - COVID-19 vaccine acceptance among health care workers in Africa: A systematic review and meta-analysis
Martin Ackah, Louise Ameyaw, Mohammed Gazali Salifu, Delali Pearl Afi Asubonteng, Cynthia Osei Yeboah, Eugene Narkotey Annor, Eunice Abena Kwartemaa Ankapong, Hosea Boakye, Muhammad Shahzad Aslam
PLOS ONE.2022; 17(5): e0268711. CrossRef - A national survey of COVID-19 vaccine acceptance in Nigeria
Ahmad Ibrahim Al-Mustapha, Ochulor Okechukwu, Ademola Olayinka, Oyeniyi Rasheed Muhammed, Muftau Oyewo, Samuel A. Owoicho, Ahmed Tijani Abubakar, Abdulsalam Olabisi, Aliyu Jibril, Simon Ereh, Oluwatosin Enoch Fakayode, Oluwaseun Adeolu Ogundijo, Nusirat E
Vaccine.2022; 40(33): 4726. CrossRef - COVID-19 vaccine hesitancy in Africa: a scoping review
Betty B. B. Ackah, Michael Woo, Lisa Stallwood, Zahra A. Fazal, Arnold Okpani, Ugochinyere Vivian Ukah, Prince A. Adu
Global Health Research and Policy.2022;[Epub] CrossRef - COVID-19 Vaccine Acceptance and Associated Factors Among College Students in Dessie City, Northeastern Ethiopia
Gete Berihun, Zebader Walle, Daniel Teshome, Leykun Berhanu, Mohammed Derso
Journal of Multidisciplinary Healthcare.2022; Volume 15: 1735. CrossRef - Career Aspiration Fulfillment and COVID-19 Vaccination Intention among Nigerian Youth: An Instrumental Variable Approach
Abayomi Samuel Oyekale
International Journal of Environmental Research an.2022; 19(16): 9813. CrossRef - COVID-19 Vaccine Attitude and Its Predictors Among People Living With Chronic Health Conditions in Ibadan, Nigeria
Lucia Yetunde Ojewale, Rotimi Felix Afolabi, Adesola Ogunniyi
International Journal of Public Health.2022;[Epub] CrossRef - Associations between COVID-19 vaccine hesitancy and the experience of violence among women and girls living with and at risk of HIV in Nigeria
Morenike Oluwatoyin Folayan, Olujide Arije, Amaka Enemo, Aaron Sunday, Amira Muhammad, Hasiya Yunusa Nyako, Rilwan Mohammed Abdullah, Henry Okiwu, Erik Lamontagne
African Journal of AIDS Research.2022; 21(4): 306. CrossRef - Willingness to receive COVID-19 vaccine: A survey among medical radiation workers in Nigeria
Grace Ben Inah, Samuel Archibong Efanga, Ekaete Vincent Ukpong, Christiana Ifeyinwa Obiora
Calabar Journal of Health Sciences.2022; 6: 80. CrossRef - Acceptance of COVID-19 vaccine among healthcare workers in Africa, systematic review and meta-analysis
Zerihun Figa, Tesfaye Temesgen, Addisu Getnet Zemeskel, Moges Ganta, Asrat Alemu, Mesfin Abebe, Zemachu Ashuro
Public Health in Practice.2022; 4: 100343. CrossRef - Perception and willingness to accept COVID-19 Vaccines: A cross-sectional survey of the general population of Sokoto State, Nigeria
Oche Mansur Oche, Habibullah Adamu, Musa Yahaya, Hudu Garba Illo, Abdulaziz Mohammad Danmadami, Adamu Ijapa, Asmau Mohammad Wali, Hamza Yusuf, Hafsat Muhammad, Abba Aji, Harapan Harapan
PLOS ONE.2022; 17(12): e0278332. CrossRef - COVID-19 vaccination acceptance among community members and health workers in Ebonyi state, Nigeria: study protocol for a concurrent-independent mixed method analyses of intention to receive, timeliness of the intention to receive, uptake and hesitancy to
Ugwu I Omale, Osarhiemen Iyare, Richard L Ewah, Chidinma I Amuzie, Onyinyechukwu U Oka, Victor U Uduma, Azuka S Adeke, Cordis O Ikegwuonu, Olaedo O Nnachi, Okechukwu O Ukpabi, Ifeyinwa M Okeke, Glory E Nkwo, Ugochi IA Nwali
BMJ Open.2022; 12(12): e061732. CrossRef - Drivers of COVID-19 Vaccine Uptake amongst Healthcare Workers (HCWs) in Nigeria
Sohail Agha, Adaobi Chine, Mathias Lalika, Samikshya Pandey, Aparna Seth, Alison Wiyeh, Alyssa Seng, Nandan Rao, Akhtar Badshah
Vaccines.2021; 9(10): 1162. CrossRef
 PubReader
 ePub Link
 Cite
Cite


