
Articles
- Page Path
- HOME > Osong Public Health Res Perspect > Volume 5(2); 2014 > Article
-
Original Article
Exposure–Response Relationship Between Aircraft Noise and Sleep Quality: A Community-based Cross-sectional Study - Soo Jeong Kima, Sang Kug Chaib, Keou Won Leec, Jae-Beom Parkb, Kyoung-Bok Minb, Hyun Gwon Kild, Chan Leed, Kyung Jong Leeb
-
Osong Public Health and Research Perspectives 2014;5(2):108-114.
DOI: https://doi.org/10.1016/j.phrp.2014.03.004
Published online: April 16, 2014
aDepartment of Preventive Medicine and Public Health, Ajou University School of Medicine, Suwon, Korea
bDepartment of Occupational and Environmental Medicine, Ajou University School of Medicine, Suwon, Korea
cHealth Promotion Center, Ajou University Medical Center, Suwon, Korea
dDepartment of Mechanical Engineering, University of Suwon, Hwaseong, Korea
- ∗Corresponding author. leekj@ajou.ac.kr
- 1S.J. Kim and S.K. Chai equally contributed to this paper.
© 2014 Published by Elsevier B.V. on behalf of Korea Centers for Disease Control and Prevention.
This is an Open Access article distributed under the terms of the Creative Commons Attribution Non-Commercial License (http://creativecommons.org/licenses/by-nc/3.0) which permits unrestricted non-commercial use, distribution, and reproduction in any medium, provided the original work is properly cited.
Abstract
-
Objectives
- Exposure to aircraft noise has been shown to have adverse health effects, causing annoyance and affecting the health-related quality of life, sleep, and mental states of those exposed to it. This study aimed to determine sleep quality in participants residing near an airfield and to evaluate the relationship between the levels of aircraft noise and sleep quality.
-
Methods
- Neighboring regions of a military airfield were divided into three groups: a high exposure group, a low exposure group, and a control group. A total of 1082 participants (aged 30–79 years) completed a comprehensive self-administered questionnaire requesting information about demographics, medical history, lifestyle, and the Pittsburgh Sleep Quality Index.
-
Results
- Of the 1082 participants, 1005 qualified for this study. The prevalence of sleep disturbance was 45.5% in the control group, 71.8% in the low exposure group, and 77.1% in the high exposure group (p for trend < 0.001). After adjusting for potential confounding factors, we determined the exposure–response relationship between the degree of aircraft noise and sleep quality. Of the participants with a normal mental status, the prevalence of sleep disturbance was 2.61-fold higher in the low exposure group and 3.52-fold higher in the high exposure group than in the control group.
-
Conclusion
- The relationship between aircraft noise and health should be further evaluated through a large-scale follow-up study.
- Recent research has shown that aircraft noise is associated with a number of health problems, such as hearing loss, poor self-rated health, a poor quality of life, and an increased risk of cardiovascular disease, hypertension, annoyance, and psychiatric disorders [1–4].
- Prolonged exposure to an environmental stressor such as aircraft noise may affect sleep [5]. Exposure to aircraft noise leads to an increased frequency of awakening, decreased slow wave sleep, changes to sleep stage 1, use of sleep drugs or sedatives, and a poor quality of sleep [1]. Poor sleep quality also has secondary effects, such as excessive daytime fatigue, a low capacity for work, and an increased accident rate [5]. Exposure to noise is also associated with negative emotions such as depression, anxiety, and stress [6]. A survey in Japan found that exposure to noise reaching a 95 weighted equivalent continuous perceived noise level (WECPNL) or more is associated with increased depression and perceived psychological disorders [6].
- Although several studies have investigated the association between noise and noise-induced sleep disturbance, large-scale epidemiological studies are still insufficient to explain clearly the relationship between exposure to aircraft noise and sleep quality affecting mental disorders. We assessed the relationship between noise levels and sleep quality after adjusting for mental disorders such as depression, anxiety, stress, and other covariates.
Introduction
- 2.1 Study location and noise mapping
- A community-based cross-sectional survey was carried out to study residents of the Oksumyun, Nechodong, and Okguup districts, rural areas in the vicinity of Kunsan Airport, Republic of Korea. Kunsan Airport is a large military airport, located on the west coast of Korea and used by United States and Korean air forces. Kunsan Airport carries out regular tactical training during the day (08:00–19:00) and night (19:00–22:00) from Monday to Friday. The maximum number of aircraft per day was 150, with an average of about 40.
- Aircraft noise radiated down to rural areas in Kunsan was measured as a maximum sound pressure level by using NL-20 and NL-21 sound meters (Rion Co., Ltd. (Kokubunji, Tokyo, Japan)) according to the national standard specified by the Korea Ministry of Environment [7]. Aircraft noise measurements were recorded for 7 days (from June 23, 2009 to July 1, 2009) at four different locations representing the most severely noise-influenced regions of Kunsan City; these locations did not have any obstacles to the radiation of aircraft noise. After the noise measurements, we calculated the maximum noise intensity
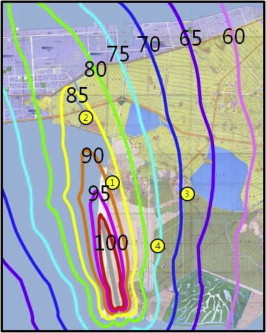
- To investigate the influence of aircraft noise on the entire region of Kunsan City, we created a noise map using the Integrated Noise Model (INM), which was developed by the Federal Aviation Agency and is now being considered as a worldwide standard tool for mapping aircraft noise in most countries [8]. The noise simulation was created using the INM code with input data of aircraft specifications, flight patterns, flight paths, average number of aircraft passages, and geological information for the Kunsan area. The noise map of the Kunsan area is shown in Figure 1 with iso-WECPNL contours. The noise map predicted through the INM simulation was compared with the measurement data and its prediction accuracy was verified within a few per cent relative error in WECPNL.
- Using the noise map, the regions neighboring Kunsan airfield were divided into three groups: a high exposure group (HEG, >80 WECPNL), a low exposure group (LEG, 60–80 WECPNL), and a control group (CTL, <60 WECPNL).
- 2.2 Study population
- Of a total of 4788 male and female residents aged 20–79 years, 2116 potential participants (1075 high exposure, 750 low exposure, and 291 controls) were selected using stratified random sampling. All the potential participants selected were initially contacted by a letter describing the purpose, participation, and support related to the study. Finally, 1082 volunteers participated in a comprehensive health examination and on-site interviews from August 4, 2009 to August 22, 2009. All participants completed interviewer-based questionnaires requesting information on demographics, medical history, the Pittsburg Sleep Quality Index (PSQI) [9], and the Depression Anxiety Stress Scale (DASS) [10]. Of the 1082 participants, 55 participants aged in their 20s and 80s were excluded due to a small sample size. After excluding an additional 22 participants who did not have PSQI information, 1005 participants were included in the study. Written informed consent was obtained from all participants. The study protocol was approved by the Ajou University Medical Center Ethical Committee, Suwon, Korea.
- 2.3 Subjective sleep quality
- Sleep quality in the past month was assessed with the PSQI, which is a self-administered questionnaire comprising seven components, such as subjective sleep quality, sleep latency, sleep duration, sleep efficiency, sleep disturbances, use of sleeping drugs, and daytime dysfunction. Each component is given a score from 0 to 3 and the sum of all items produces a global PSQI score between 0 and 21 [9]. We used a global PSQI score ≥6 as the definition of sleep disturbance because the test has 98.7% sensitivity and 84.4% specificity with this criterion [11].
- 2.4 Mental disorders
- We used the DASS to measure depression, anxiety, and stress. DASS-Depression is characterized by low positive affects, loss of self-esteem and incentive, and a sense of hopelessness (absence of positive affect). DASS-Anxiety is characterized by autonomic arousal and fearfulness (psychological hyperarousal). DASS-Stress is characterized by persistent tension, irritability, and a low threshold for becoming upset or frustrated (negative affects). DASS has been primarily applied to nonclinical participants, which has provided strong support for the internal consistency and convergent and divergent validity of its three scales [10]. Each DASS category contains 14 items. Participants use four-point severity scales to rate the extent to which they have experienced each state over the past week. Scores for each DASS category are calculated by summing the scores for the relevant items.
- 2.5 Statistical analysis
- Mean differences in age, years of residence, DASS score, and PSQI global score were tested according to the noise level using analysis of variance. The comparison of sex, occupational class, current smoking status, and doctor-diagnosed chronic disease with noise level was tested using a Chi-square test. To evaluate the impact of aircraft noise on sleep disturbance, multiple logistic regressions were conducted. All p values are two-tailed, with p < 0.05 considered to be statistically significant. All statistical analyses were conducted using PASW Statistics 17.0 (SPSS Korea DataSolution, Chicago, IL, USA).
Materials and methods
- Table 1 gives the general characteristics of the participants. The mean age of the CTL group was significantly higher than the other groups. There was no significant difference in sex by group. The proportion of manual workers in the CTL group was significantly higher than in the other groups. The years of residence of the CTL group was slightly longer than the other groups. The percentage of patients with doctor-diagnosed chronic disease was low in the HEG and it appeared to increase with the decrease in noise levels (p for trend = 0.008). All the DASS scores and PSQI global scores were increased in the order of noise level with statistical significance.
- The prevalence of sleep disturbance was high in the order of noise level (p for trend < 0.001). The mean scores of the PSQI subscale were high, increasing with the level of noise, except in the case of sleep latency and use of sleeping drugs (Table 2). Participants with sleep disturbance had a higher global score of depression, anxiety, and stress than those of normal participants across all levels of noise (p < 0.01; Table 3).
- The odds ratios of the LEG and HEG on sleep disturbance compared with the CTL in the normal and abnormal groups (depression, anxiety, or stress) in mental health are given in Table 4. In the normal group, the LEG and HEG had a 2.61 and 3.52 increase in odds ratio compared with the CTL group after adjusting for covariates. The LEG had a 5.71 higher risk of sleep disturbance compared with the CTL group in participants with mental health problems, whereas the HEG was not significant. The odds ratios of general characteristics such as age and sex were not significant in all models (Table 4).
Results
- This study identifies three key findings. Firstly, the prevalence of sleep disturbance significantly differed according to the noise level (p for trend < 0.001). Secondly, participants with mental disorders had a higher prevalence of sleep disturbance (p < 0.001). Finally, after adjustment of covariates, exposure–response relationships between noise level and sleep disturbance were observed in participants without mental health problems.
- In this community-based cross-sectional study, we observed that exposure to noise was positively associated with sleep disturbance and the exposure–response relationship was determined after controlling for depression, anxiety, and stress.
- Over the past 30 years, several workers have studied the relationship between noise and sleep. These studies indicate that, although aircraft noise is possibly associated with sleep loss and an increased frequency of wakening, further evidence outlining a clear exposure–response relationship is required to associate aircraft noise with a reduced quality of sleep and electroencephalography (EEG) changes [5,12,13]. It has previously been established that increased noise exposure leads to sleep disturbance [14–16]. This study, which was conducted with Korean adults, also showed that aircraft noise interfered with sleep, including sleep quality, sleep latency, sleep duration, sleep efficiency, sleep disturbance, use of sleeping drugs, and daytime dysfunction as subscales, with an obvious exposure–response relationship by noise level (p for trend < 0.001).
- Although there have been many studies on the association between environmental noise and mental health, the results have so far been inconsistent [2,4,6,17]. Among 6000 people living near Heathrow Airport (London, England), those living in higher noise areas were found to have a higher prevalence of depression than those living in average noise areas [4]. An exposure–response relationship was found between exposure to higher levels of military aircraft noise around Kadena Airport in Japan and depressiveness and nervousness [6]. Road traffic was not associated with mental health symptoms after adjusting for socio-demographic factors in a longitudinal analysis [17].
- Our data show a positive association between the prevalence of depression disorder, anxiety disorder, and stress disorder, which increased with the level of noise. The prevalence of depression disorder in the CTL group, LEG, and HEG was 5.2%, 47.0%, and 47.8% (p for trend < 0.001), respectively. The prevalence of anxiety disorder in the CTL group, LEG, and HEG was 20.8%, 27.2%, and 33.5% (p for trend < 0.01), respectively. The prevalence of stress disorder in the CTL group, LEG, and HEG was 4.6%, 10.0%, and 15.3% (p for trend < 0.001), respectively (data not shown).
- In many clinical and community settings, mental disorders accompany sleep disturbances [18,19]. Japanese women with depression have a 1.2-fold higher chance of developing insomnia [19]. In a community-based cross-sectional study involving 33,051 men aged 67 years and older, depressed men had a 3.7-fold higher risk of poor sleep quality [20]. Therefore these results suggest that mental disorders should be considered as a controlling factor in studies evaluating sleep. This has been reported in previous studies and it is also treated as an important issue in this study, as follows. (1) Aircraft noise affects sleep disorders. Noise as a biological stressor can influence both the sympathetic nervous system and the autonomic nervous system, including the hypothalamus-pituitary-adrenal axis and the adrenal medulla of the neuroendocrine system; as a result, stress hormones such as adrenaline, noradrenaline, and cortisol are released [14,21,22]. (2) Aircraft noise affects mental disorders such as depression, anxiety, and stress. Chronic exposure to noise can influence central autonomic arousal, resulting in an increased psychiatric syndrome such as depression, anxiety, and stress [2]. (3) Socio-economic factors, health-related factors, and health behavioral factors may mediate sleep disorders. (4) Poor sleep quality and depression are linked. As the results of studies on sleep in depression using polysomnographic recordings have shown, sleep disturbance produces decreased sleep efficiency, decreased slow-wave sleep, reduced rapid eye movement latency, and increased rapid eye movement intensity. In addition to the direct relationship between sleep disturbance and depression, disturbed sleep is associated with alterations in glucose metabolism and may represent a risk factor for the development of obesity. Sleep architecture is also influenced by sex and age [23]. As a result, mental disorders and socio-economic factors may need to be well controlled to be able to assess the independent effect that aircraft noise has on sleep disorders. This study cannot provide an accurate cause-and-effect relationship as it is not a prospective cohort study.
- Previous studies on the association between noise and sleep disturbance did not consider pre-existing mental disorders, whereas we analyzed groups with or without a mental health problem (depression, anxiety, or stress) to identify the independent effect of noise on sleep disturbance. A remarkably strong association between the degree of noise and sleep disturbance was observed.
- Our study has several limitations. Firstly, we cannot exclude the possibility of the misclassification of exposure. However, areas not affected by noise other than aircraft noise (ambient background noise, traffic noise, rail noise) were selected for measuring noise. In other words, areas where other noise is at least 20 dB lower than aircraft noise and can thus be ignored were chosen for measurements. In addition, when processing the noise measurement results, data affected by unexpected traffic noise or night-time noise were excluded and only pure aircraft noise was assessed. Furthermore, to take into consideration the effect of the night when assessing the WECPNL for this study, the WECPNL for night-time aircraft noise was calculated with about three times the weight compared with daytime noise. By comparing the difference between the noise levels predicted using the noise map and the actual noise levels measured, the research team confirmed that the results were highly reliable with a difference of 3.6 dB or less. Additionally, Kunsan, the test area for this study, is an agricultural region located near narrow farm roads rather than roads for cars. There is a low possibility of exposure misclassification, because Korea's agricultural towns show hardly any activity after 07:00 PM. Secondly, previous studies on the effects of noise on sleep have measured brain activity and sleep quality using objective measures of sleep assessment, such as EEG or polysomnography [24]. However, due to constraints of time and cost in using an objective method to conduct an epidemiological study of a population group, most researchers have chosen the subjective method [14,15,25]. In terms of the prevalence of sleep disturbance, the CTL group is assessed to be high (45.5%) and both the LEG (71.8%) and the HEG (77.8%) very high. Ohayon and Hong [26] reported that the prevalence of subjective insomnia occurring at least three times a week in an average Korean is 17.0%. Such a discrepancy between these two figures may be attributed mainly to the difference in the research method (face-to-face interview and telephone interview) and survey tools (PSQI and Sleep-EVAL) used in the two studies. In a recent study, subjective sleep disturbance was assessed using the question “How much have you been disturbed in your sleep by railway noise (or road traffic noise) at night when you are sleeping in your house over the last 12 months?” On a scale of 0 to 10, those who answered 8 or higher were defined as a highly sleep-disturbed population and those who answered 6 or higher were considered to be a sleep-disturbed population. As a result, exposures to 60 dB and 80 dB of railway noise resulted in a sleep-disturbed prevalence of about 40% and 90%, respectively. Those exposed to road traffic noise showed a lower prevalence than those exposed to railway noise [27]. Such large differences in the prevalence in each study can be explained by the difference in the research methods, including the survey tools. Thirdly, noise sensitivity, noise annoyance, and coffee consumption are variables related to sleep, but they have not been surveyed. In the previous research, a high noise sensitivity score was related to a high level of noise annoyance [28] and there was a positive association between noise sensitivity and self-reported mental health [29].
- Given that all participants in this study were volunteers, there is a possibility that the participants in the experimental group are those who are highly stressed in daily life, particularly due to aircraft noise, or who have health issues including sleep disturbance. In addition, even though trained investigators tried to obtain truthful answers from the participants during the course of this study, it is possible that, due to psychological effects, participants in the experimental group who did not actually have sleep disturbances or health issues responded that they did have such problems. As a result, we cannot rule out the possibility that there was an overestimation of the prevalence of sleep disturbance or of mental disorders in the experimental group compared with the control group not exposed to aircraft noise. Finally, we did not measure the levels of noise inside dwellings, the types of windows in the dwelling, the bedroom window position, nor window opening behaviors, which may be noise exposure moderators. A total of 96% of participants were living in houses and Korea's houses and installations in rural areas are similar. As there is a sufficient number of participants, it is assumed that the opening and closing of windows will not have a significant effect on the study results as the participants would have opened and closed their windows a relatively equivalent number of times.
Discussion
- None to declare.
Conflicts of interest
-
Acknowledgements
- This study was financially supported by Kunsan City, Project No. 20090441320-00. We thank officials at Kunsan City Hall for their help in obtaining the data and the participants for their time and effort.
Acknowledgments
-
This is an Open Access article distributed under the terms of the Creative Commons Attribution Non-Commercial License (http://creativecommons.org/licenses/by-nc/3.0) which permits unrestricted non-commercial use, distribution, and reproduction in any medium, provided the original work is properly cited.
Article information
- 1. Franssen E.A., van Wiechen C.M., Nagelkerke N.J.. Aircraft noise around a large international airport and its impact on general health and medication use. Occup Environ Med 61(5). 2004 May;405−413. PMID: 15090660.ArticlePubMed
- 2. Hardoy M.C., Carta M.G., Marci A.R.. Exposure to aircraft noise and risk of psychiatric disorders: the Elmas survey. Soc Psychiatry Psychiatr Epidemiol 40(1). 2005 Jan;24−26. PMID: 15624071.ArticlePubMed
- 3. Miyakita T., Yoza T., Matsui T.. An epidemiological study regarding the hearing acuity of residents in the area with high level of aircraft noise: results of hearing tests conducted in the vicinity of Kadena Air Base. Nihon Eiseigaku Zasshi 56(3). 2001 Oct;577−587. [in Japanese]. PMID: 11692623.ArticlePubMed
- 4. Tarnopolsky A., Watkins G., Hand D.J.. Aircraft noise and mental health: I. Prevalence of individual symptoms. Psychol Med 10(4). 1980 Nov;683−698. PMID: 7208727.ArticlePubMed
- 5. Muzet A.. Environmental noise, sleep and health. Sleep Med Rev 11(2). 2007 Apr;135−142. PMID: 17317241.ArticlePubMed
- 6. Hiramatsu K., Yamamoto T., Taira K.. A survey on health effects due to aircraft noise on residents living around Kadena air base in the Ryukyus. J Sound Vibration 205(4). 1997 Aug;451−460.Article
- 7. Ministry of Environment . The method of test for noise and vibration process. Ministry of Environment Bulletin 2003-221. 2003. Ministry of Environment; Gwacheon: [in Korean].
- 8. United States. Federal Aviation Administration. Office of Environment and Energy, ATAC Corporation, John A. Volpe National Transportation Systems Center (U.S.). Integrated Noise Model (INM) Version. 6.0. User's guide. 1999. Federal Aviation Administration, Office of Environment and Energy.
- 9. Buysse D.J., Reynolds C.F. 3rd, Monk T.H.. The Pittsburgh Sleep Quality Index: a new instrument for psychiatric practice and research. Psychiatry Res 28(2). 1989 May;193−213. PMID: 2748771.ArticlePubMed
- 10. Brown T.A., Chorpita B.F., Korotitsch W.. Psychometric properties of the Depression Anxiety Stress Scales (DASS) in clinical samples. Behav Res Ther 35(1). 1997 Jan;79−89. PMID: 9009048.ArticlePubMed
- 11. Backhaus J., Junghanns K., Broocks A.. Test-retest reliability and validity of the Pittsburgh Sleep Quality Index in primary insomnia. J Psychosom Res 53(3). 2002 Sep;737−740. PMID: 12217446.ArticlePubMed
- 12. Borchgrevink H.M.. Does health promotion work in relation to noise? Noise Health 5(18). 2003 Jan–Mar;25−30. PMID: 12631433.PubMed
- 13. Morrell S., Taylor R., Lyle D.. A review of health effects of aircraft noise. Aust N Z J Public Health 21(2). 1997 Apr;221−236. PMID: 9161085.ArticlePubMed
- 14. Jakovljević B., Belojević G., Paunović K.. Road traffic noise and sleep disturbance in an urban population: cross-sectional study. Croat Med J 47(1). 2006 Feb;125−133. PMID: 16489705.PubMed
- 15. Marks A., Griefahn B.. Associations between noise sensitivity and sleep, subjectively evaluated sleep quality, annoyance and performance after exposure to nocturnal traffic noise. Noise Health 9(34). 2007 Jan–Mar;1−7. PMID: 17851221.ArticlePubMed
- 16. Öhrström E.. Longitudinal surveys on effects of changes in road traffic noise-annoyance, activity disturbances, and psycho-social well-being. J Acoust Soc Am 115(2). 2004 Feb;719−729. PMID: 15000184.ArticlePubMed
- 17. Stansfeld S., Gallacher J., Babisch W.. Road traffic noise and psychiatric disorder: prospective findings from the Caerphilly study. BMJ 313(7052). 1996 Aug;266−267. PMID: 8704537.ArticlePubMed
- 18. Chung K.F., Tso K.C.. Relationship between insomnia and pain in major depressive disorder: a sleep diary and actigraphy study. Sleep Med 11(8). 2010 Sep;752−758. PMID: 20133187.ArticlePubMed
- 19. Kawada T., Yosiaki S., Yasuo K.. Population study on the prevalence of insomnia and insomnia-related factors among Japanese women. Sleep Med 4(6). 2003 Nov;563−567. PMID: 14607351.ArticlePubMed
- 20. Paudel M.L., Taylor B.C., Diem S.J.; Osteoporotic Fractures in Men Study Group. Association between depressive symptoms and sleep disturbances in community-dwelling older men. J Am Geriatr Soc 56(7). 2008 Jul;1228−1235. PMID: 18482297.ArticlePubMed
- 21. Maschke C., Hecht K.. Stress hormones and sleep disturbances–electrophysiological and hormonal aspects. Noise Health 6(22). 2004 Jan–Mar;49−54. PMID: 15070528.PubMed
- 22. Miyakita T., Matsui T., Ito A.. Population-based questionnaire survey on health effects of aircraft noise on residents living around U.S. airfields in the Ryukyus–Part I: an analysis of 12 scale scores. J Sound Vibrat 250(1). 2002 Feb;129−137.Article
- 23. Thase M.E.. Depression and sleep: pathophysiology and treatment. Dialogues Clin Neurosci 8(2). 2006;217−226. PMID: 16889107.ArticlePubMedPMC
- 24. Pirrera S., De Valck E., Cluydts R.. Nocturnal road traffic noise: a review on its assessment and consequences on sleep and health. Environ Int 36(5). 2010 Jul;492−498. PMID: 20406712.ArticlePubMed
- 25. Miedema H.M., Vos H.. Associations between self-reported sleep disturbance and environmental noise based on reanalyses of pooled data from 24 studies. Behav Sleep Med 5(1). 2007;1−20. PMID: 17313321.ArticlePubMed
- 26. Ohayon M.M., Hong S.C.. Prevalence of insomnia and associated factors in South Korea. J Psychosom Res 53(1). 2002 Jul;593−600. PMID: 12127177.ArticlePubMed
- 27. Hong J., Kim J., Lim C.. The effects of long-term exposure to railway and road traffic noise on subjective sleep disturbance. J Acoust Soc Am 128(5). 2010 Nov;2829−2835. PMID: 21110578.Article
- 28. Jakovljevic B., Paunovic K., Belojevic G.. Road-traffic noise and factors influencing noise annoyance in an urban population. Environ Int 35(3). 2009 Apr;552−556. PMID: 19007991.ArticlePubMed
- 29. Stansfeld S.A.. Noise, noise sensitivity and psychiatric disorder: epidemiological and psychophysiological studies. Psychol Med 22(Suppl.). 1992;1−44. PMID: 1488472.ArticlePubMed
References
| CTL (n = 134) | LEG (n = 517) | HEG (n = 354) | p or p for trend* | |
|---|---|---|---|---|
| Age (y) | 65.0 ± 10.1 | 61.9 ± 12.1 | 59.7 ± 12.5 | <0.001 |
| Male sex | 44.8 | 40.2 | 43.2 | 0.522 |
| Residence time (y) | 48.1 ± 18.4 | 45.3 ± 18.5 | 42.7 ± 18.9 | 0.011 |
| Participants with doctor-diagnosed chronic diseasea | 40.3 | 38.5 | 29.9 | 0.008* |
| Participants with doctor-diagnosed mental diseaseb | 1.5 | 1.9 | 1.7 | 0.929 |
| DASS score | ||||
| Depression | 8.7 ± 8.3 | 10.6 ± 9.4 | 12.1 ± 9.9 | 0.001 |
| Anxiety | 7.6 ± 7.0 | 9.8 ± 8.5 | 11.6 ± 9.1 | <0.001 |
| Stress | 9.5 ± 8.8 | 11.8 ± 9.5 | 14.1 ± 9.9 | <0.001 |
| Global PSQI score | 5.8 ± 2.8 | 7.6 ± 3.1 | 8.1 ± 3.2 | <0.001 |
Data are presented as mean ± SD or %.
CTL = control group; DASS = Depression Anxiety Stress Scale; HEG = high exposure group; LEG = low exposure group; PSQI = Pittsburgh Sleep Quality Index.
|
Mental health |
||||
|---|---|---|---|---|
|
Normal |
Abnormal |
|||
| Age- and sex-adjusted OR (95% CI) (n = 672) | Fully adjusted OR (95% CI) (n = 595) | Age- and sex-adjusted OR (95% CI) (n = 293) | Fully adjusted OR (95% CI) (n = 243) | |
| Noise exposure (reference control) | ||||
| Low | 2.74 (1.74–4.32) | 2.61 (1.58–4.32) | 4.18 (1.62–10.78) | 5.71 (1.66–19.67) |
| High | 3.89 (2.36–6.41) | 3.52 (2.03–6.10) | 3.26 (1.26–8.41) | 3.31 (0.99–11.10) |
| Age | 0.99 (0.98–1.01) | 0.99 (0.96–1.01) | 0.97 (0.94–1.01) | 1.02 (0.96–1.07) |
| Sex (reference male) | 0.89 (0.64–1.22) | 1.10 (0.68–1.78) | 0.84 (0.42–1.68) | 0.77 (0.25–2.40) |
| Marital status (reference single) | ||||
| Married | 1.57 (0.68–3.67) | NA | ||
| Separated, divorced, bereaved | 2.32 (0.88–6.11) | NA | ||
| Educational level (reference ≤11 y) | ||||
| ≥12 y | 1.08 (0.70–1.66) | 1.62 (0.39–6.80) | ||
| Occupational class (reference manual) | ||||
| Non-manual | 0.55 (0.30–1.02) | 4.46 (0.49–40.93) | ||
| Other | 1.08 (0.70–1.66) | 0.82 (0.35–1.92) | ||
| Annual household income (reference <$20,000) | ||||
| ≥$20,000 | 1.20 (0.74–1.93) | 1.81 (0.34–9.67) | ||
| Residence time (y) | 0.99 (0.98–1.01) | 0.98 (0.95–1.01) | ||
| Body mass index | 0.97 (0.92–1.03) | 0.92 (0.82–1.04) | ||
| Current smoking (reference “no”) | 0.84 (0.50–1.41) | 1.44 (0.40–5.23) | ||
| Current alcohol drinking (reference “no”) | 1.11 (0.75–1.64) | 0.41 (0.17–0.99) | ||
| Regular exercise (reference “no”) | 1.07 (0.75–1.52) | 2.18 (0.92–5.15) | ||
| Doctor-diagnosed chronic diseasea (reference “no”) | 0.99 (0.68–1.45) | 1.08 (0.44–2.66) | ||
| Doctor-diagnosed mental diseaseb (reference “no”) | 1.26 (0.11–15.01) | 1.63 (0.17–15.82) | ||
Figure & Data
References
Citations
- Aircraft Noise Reduction Strategies and Analysis of the Effects
Jinlong Xie, Lei Zhu, Hsiao Mun Lee
International Journal of Environmental Research an.2023; 20(2): 1352. CrossRef - Review of the potential impacts of freight rail corridors on livestock welfare and production
Tellisa R. Kearton, Amelia Almeida, Frances C. Cowley, L. Amy Tait, Dana Campbell
Animal Production Science.2023;[Epub] CrossRef - A study on road traffic noise exposure and prevalence of insomnia
Towseef Ahmed Gilani, Mohammad Shafi Mir
Environmental Science and Pollution Research.2022; 29(27): 41065. CrossRef - Sleep Deprivation and Disruptors of Sleep among Secondary Schoolchildren and Adolescents from Mumbai City
Ashok Vaidya, Sharvari R Desai, Rama A Vaidya, Shobha A Udipi, Pallavi S Ullal, Sangeeta A Chokhani, Abha Dharam Pal
Indian Journal of Sleep Medicine.2021; 16(2): 33. CrossRef - Urban Noise and Psychological Distress: A Systematic Review
Nicola Mucci, Veronica Traversini, Chiara Lorini, Simone De Sio, Raymond P. Galea, Guglielmo Bonaccorsi, Giulio Arcangeli
International Journal of Environmental Research an.2020; 17(18): 6621. CrossRef - The impact of aircraft noise exposure on objective parameters of sleep quality: results of the DEBATS study in France
Ali-Mohamed Nassur, Damien Léger, Marie Lefèvre, Maxime Elbaz, Fanny Mietlicki, Philippe Nguyen, Carlos Ribeiro, Matthieu Sineau, Bernard Laumon, Anne-Sophie Evrard
Sleep Medicine.2019; 54: 70. CrossRef - Survey Results of a Pilot Sleep Study Near Atlanta International Airport
Sarah Rocha, Michael G. Smith, Maryam Witte, Mathias Basner
International Journal of Environmental Research an.2019; 16(22): 4321. CrossRef - Aircraft Noise Exposure and Subjective Sleep Quality: The Results of the DEBATS Study in France
Ali-Mohamed Nassur, Marie Lefèvre, Bernard Laumon, Damien Léger, Anne-Sophie Evrard
Behavioral Sleep Medicine.2019; 17(4): 502. CrossRef - Low Income as a Vulnerable Factor to the Effect of Noise on Insomnia
Choongman Park, Chang Sun Sim, Joo Hyun Sung, Jiho Lee, Joon Ho Ahn, Young Min Choe, Jangho Park
Psychiatry Investigation.2018; 15(6): 602. CrossRef - A statistical evaluation on flight operational characteristics affecting aircraft noise during take-off
Paolo Gagliardi, Luca Teti, Gaetano Licitra
Applied Acoustics.2018; 134: 8. CrossRef - Study of noise level at Raja Haji Fisabilillah airport in Tanjung Pinang, Riau Islands
H Nofriandi, A Wijayanti, M F Fachrul
IOP Conference Series: Earth and Environmental Sci.2018; 106: 012024. CrossRef - The effect of aircraft noise on sleep disturbance among the residents near a civilian airport: a cross-sectional study
Kyeong Min Kwak, Young-Su Ju, Young-Jun Kwon, Yun Kyung Chung, Bong Kyu Kim, Hyunjoo Kim, Kanwoo Youn
Annals of Occupational and Environmental Medicine.2016;[Epub] CrossRef - Changes in the mean hearing threshold levels in military aircraft maintenance conscripts
Won-Ju Park, Jai-Dong Moon
Archives of Environmental & Occupational Health.2016; 71(6): 347. CrossRef - Stress and musculoskeletal symptom of undergraduates
Soo Jeong Kim, Kyoung Won Cho
Korean Journal of Health Education and Promotion.2016; 33(1): 33. CrossRef - Sleep Duration and Area-Level Deprivation in Twins
Nathaniel F. Watson, Erin Horn, Glen E. Duncan, Dedra Buchwald, Michael V. Vitiello, Eric Turkheimer
Sleep.2016; 39(1): 67. CrossRef - Aircraft noise monitoring using multiple passive data streams
M Aldeman, R Bacchus, K Chelliah, H Patel, G Raman, D Roberson
Noise & Vibration Worldwide.2016; 47(3-4): 35. CrossRef - Impact of wind turbine sound on general health, sleep disturbance and annoyance of workers: a pilot- study in Manjil wind farm, Iran
Milad Abbasi, Mohammad Reza Monazzam, Arash Akbarzadeh, Seyyed Abolfazl Zakerian, Mohammad Hossein Ebrahimi
Journal of Environmental Health Science and Engine.2015;[Epub] CrossRef - Sound in the Air
Hae-Wol Cho, Chaeshin Chu
Osong Public Health and Research Perspectives.2014; 5(2): 75. CrossRef - The Experience of Occupational Risk and the Handling of Incapacity Due to Ill Health and Injury
Jacquelene Swanepoel, J.C. Visagie
Journal of Social Sciences.2014; 40(3): 343. CrossRef
 PubReader
 Cite
Cite
