
Articles
- Page Path
- HOME > Osong Public Health Res Perspect > Forthcoming articles > Article
-
Original Article
Effect of Paxlovid in COVID-19 treatment during the periods of SARS-CoV-2 Omicron BA.5 and BN.1 subvariant dominance in the Republic of Korea: a retrospective cohort study -
Dong-Hwi Kim1,2
 , Min-Gyu Yoo1,3, Na-Young Kim1,2, So Young Choi3,4, Minjeong Jang4, Misuk An4, Se-Jin Jeong4, Jungyeon Kim1,2,5
 -
DOI: https://doi.org/10.24171/j.phrp.2023.0230
Published online: March 4, 2024
1Patient Management Team, Centrol Headquarters of COVID-19, Korea Disease Control and Prevention Agency, Cheongju, Republic of Korea
2Division of Emerging Infectious Disease, Bureau of Infectious Disease Risk Response, Korea Disease Control and Prevention Agency, Cheongju, Republic of Korea
3Division of Public Health Emergency Response Research, Bureau of Public Health Emergency Preparedness, Korea Disease Control and Prevention Agency, Cheongju, Republic of Korea
4Data Analysis Team, Korea Disease Control and Prevention Agency, Cheongju, Republic of Korea
5Division of Clinical Research, Center for Emerging Virus Research, Natinal Institute of Infectious Disease, Korea Disease Control and Prevention Agency, Cheongju, Republic of Korea
- Corresponding author: Jungyeon Kim Division of Clinical Research, Center for Emerging Virus Research, Natinal Institute of Infectious Disease, Korea Disease Control and Prevention Agency, 187 Osongsaengmyeong 2-ro, Osong-eup, Heungdeok-gu, Cheongju 28159, Republic of Korea E-mail: erijykim@korea.kr
- Dong-Hwi Kim and Min-Gyu Yoo contributed equally as co-first authors.
© 2024 Korea Disease Control and Prevention Agency.
This is an open access article under the CC BY-NC-ND license (http://creativecommons.org/licenses/by-nc-nd/4.0/).
- 266 Views
- 15 Download
Abstract
-
Objectives
- This study was conducted to assess the efficacy of nirmatrelvir/ritonavir treatment in patients with coronavirus disease 2019 (COVID-19), particularly those aged 60 years and older. Using real-world data, the period during which the BN.1 Omicron variant was dominant was compared to the period dominated by the BA.5 variant.
-
Methods
- In this retrospective cohort study, data were collected regarding 2,665,281 patients infected with severe acute respiratory syndrome coronavirus 2 between July 24, 2022, and March 31, 2023. Propensity score matching was utilized to match patients who received nirmatrelvir/ritonavir in a 1:4 ratio between BN.1 and BA.5 variant groups. Multivariable logistic regression analysis was employed to assess the effects of nirmatrelvir/ritonavir within these groups.
-
Results
- Compared to the prior period, the efficacy of nirmatrelvir/ritonavir did not significantly differ during the interval of Omicron BN.1 variant dominance in the Republic of Korea. Among patients treated with nirmatrelvir/ritonavir, a significantly lower risk of mortality was observed in the BN.1 group (odds ratio [OR], 0.698; 95% confidence interval [CI], 0.557–0.875) compared to the BA.5 group. However, this treatment did not significantly reduce the risk of severe or critical illness, including death, for those in the BN.1 group (OR, 0.856; 95% CI, 0.728–1.007).
-
Conclusion
- Nirmatrelvir/ritonavir has maintained its effectiveness against COVID-19, even with the emergence of the BN.1 Omicron subvariant. Consequently, we strongly recommend the administration of nirmatrelvir/ritonavir to patients exhibiting COVID-19-related symptoms, irrespective of the dominant Omicron variant or their vaccination status, to mitigate disease severity and decrease the risk of mortality.
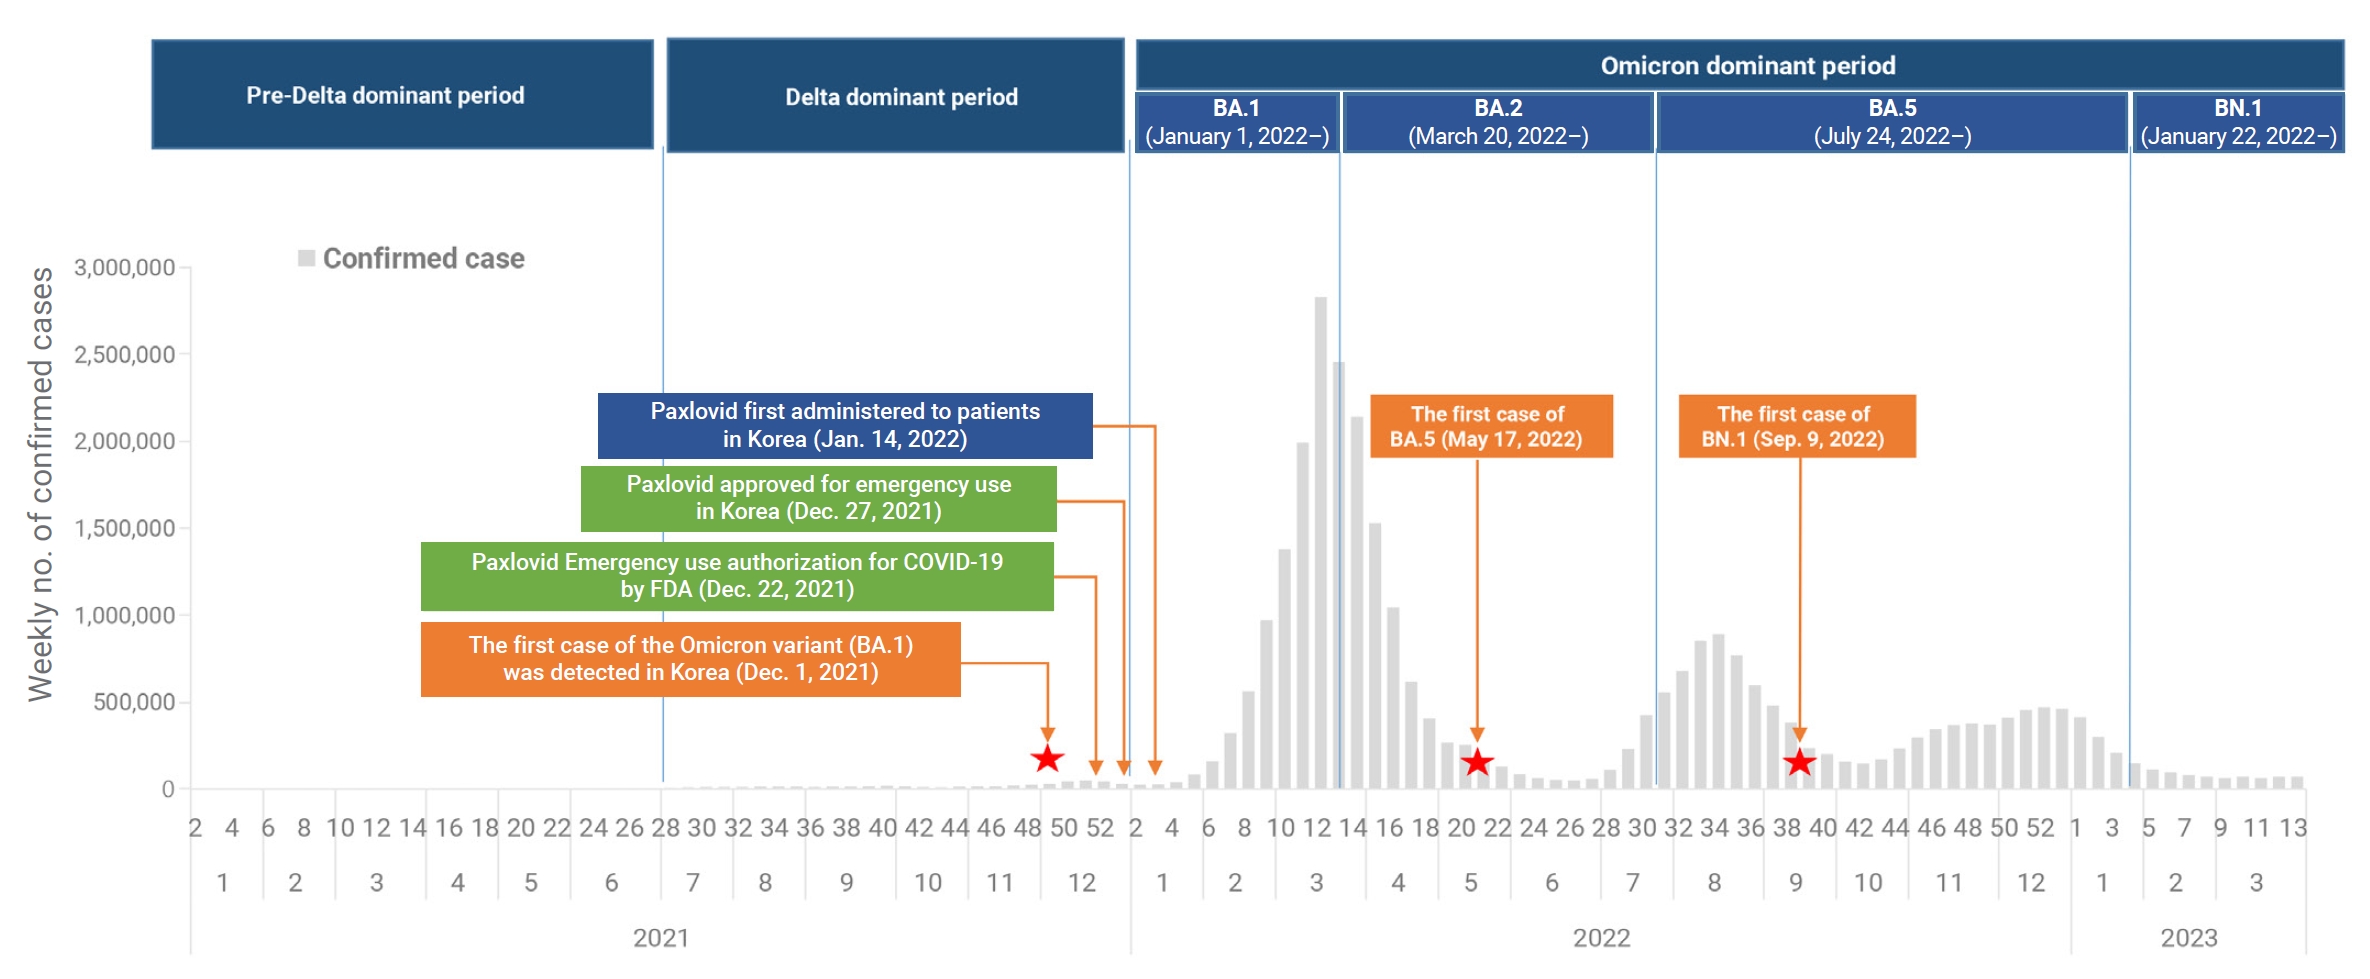
- Severe acute respiratory syndrome coronavirus 2 (SARS-CoV-2), which causes coronavirus disease 2019 (COVID-19), was first identified in Wuhan, China, at the end of 2019 [1,2]. Since then, the Omicron variant of SARS-CoV-2 has become the dominant strain globally, representing over 98% of the virus samples shared by the Global Initiative on Sharing All Influenza Data [3]. In the Republic of Korea, the first case of the Omicron variant was detected on November 30, 2021 [4]. By January 1, 2022, the predominant variant in the country had shifted from the Delta variant to the Omicron subvariant BA.1 [5,6]. This was followed by the emergence of BA.2 as the dominant subvariant on March 20, 2022, and BA.5 on July 24, 2022. More recently, the BN.1 variant became the dominant subvariant on January 22, 2023, and has spread rapidly in the Republic of Korea, accounting for 50.4% of newly reported infections [7]. This has occurred despite high vaccination coverage and a large portion of the population having been previously infected with Omicron subvariants BA.1, BA.2, or BA.5. The first oral antiviral agents, nirmatrelvir and ritonavir (sold under the brand name Paxlovid), were authorized by the United States Food and Drug Administration on December 22, 2021, for the treatment of high-risk patients with mild-to-moderate COVID-19 [8−10]. Following emergency use authorization in the Republic of Korea on December 27, 2021, nirmatrelvir/ritonavir was first administered on January 14, 2022, to patients experiencing mild-to-moderate symptoms of COVID-19 who were at high risk of progressing to severe disease. The treatment was administered within 5 days of symptom onset (Figure 1) [11]. To date, this combination has primarily been used to treat high-risk patients, in line with the recommendations of the Korea Disease Control and Prevention Agency (KDCA). In recent research, nirmatrelvir/ritonavir was associated with significant decreases in the rates of severe COVID-19 and mortality, with adjusted hazard ratios of 0.54 (95% confidence interval [CI], 0.39–0.75) and 0.20 (95% CI, 0.17–0.22), respectively. The treatment appeared to be more effective in patients who were older, were immunosuppressed, or had underlying neurological or cardiovascular disease (interaction p<0.05 for all) [12,13]. However, these studies were conducted when earlier SARS-CoV-2 variants were more common and may not reflect the current situation of Omicron variant prevalence. Therefore, it is necessary to investigate the effectiveness of nirmatrelvir/ritonavir under the present circumstances, particularly regarding the prevailing Omicron variant. This analysis was performed to assess the efficacy of nirmatrelvir/ritonavir in patients, especially those aged 60 years or older, against COVID-19. We employed real-world data to compare the period of BN.1 Omicron dominance with that of BA.5 Omicron dominance.
Introduction
- Data Sources
- This study incorporated data from 4 sources: (1) confirmed patient information, (2) primary epidemiological investigation data from the COVID-19 Information Management System of the KDCA, (3) the Drug Utilization Review (DUR) database, and (4) COVID-19 Patient Information Management System data from the Health Insurance Review and Assessment Service (HIRA). The database managed by the KDCA includes information regarding SARS-CoV-2 polymerase chain reaction diagnostic test results, underlying diseases, and vaccination status. The DUR database contains prescription information for oral antivirals used in treating COVID-19. Finally, data from the COVID-19 Patient Information Management System include medical history details, such as critical severity and mortality.
- Study Design and Population
- This retrospective cohort study included 2,665,281 patients who were infected with SARS-CoV-2 between July 24, 2022, and March 31, 2023. The dominant periods were delineated based on the first week in which over 50% of the weekly SARS-CoV-2 variant tests returned positive results for that variant, based on KDCA variant analysis reporting dates. Consequently, the study population was categorized into 2 groups: (1) the BA.5 group, consisting of 2,470,529 individuals infected between July 24, 2022, and January 21, 2023, during which BA.5 was the prevailing subvariant; and (2) the BN.1 group, comprising 194,752 individuals infected from January 22 to March 31, 2023, when BN.1 predominated.
- Nirmatrelvir/ritonavir, administered twice daily for 5 days, is considered for the treatment of patients with mild-to-moderate COVID-19 who are at high risk of progressing to severe illness, including hospitalization or death. The KDCA has recommended the use of nirmatrelvir/ritonavir in its published COVID-19 treatment guidelines [14], specifying the following criteria: (1) any patients aged 60 years or older, (2) patients aged 12 years or older (weighing at least 40 kg) and under 60 years who have underlying disease and/or immunosuppression, and (3) treatment initiation within 5 days of symptom onset in patients not requiring supplemental oxygen.
- In the present study, the patient inclusion criteria were as follows: (1) a diagnosis of COVID-19 between July 24, 2022, and March 31, 2023; (2) an age of 12 years or older; (3) infection with SARS-CoV-2 and prescription of nirmatrelvir/ritonavir within 5 days of symptom onset; and (4) those who met the conditions for nirmatrelvir/ritonavir administration according to KDCA guidelines. The exclusion criteria were: (1) incomplete data from the essential epidemiological investigation; (2) treatment with molnupiravir or remdesivir; and (3) ineligibility for nirmatrelvir/ritonavir treatment according to the established KDCA criteria. Follow-up monitoring for each patient was conducted for 28 days following COVID-19 diagnosis.
- Study Outcomes
- The analysis encompassed cases of severe COVID-19 and related deaths, adhering to the Korean guidelines for COVID-19 response and management [15]. Severe or critical illness, a category that included deaths, was defined as including any patient with a COVID-19 diagnosis who was receiving care in a medical facility and was considered at risk of mortality. These patients required therapeutic interventions such as non-invasive or invasive ventilation, high-flow oxygen therapy, extracorporeal membrane oxygenation, or continuous renal replacement therapy. A death was recorded when it was known or suspected to be caused by COVID-19. Monitoring of severe or critical illness (including death) and mortality in COVID-19 patients continued for 28 days following diagnosis.
- In this study, we compared the effectiveness of nirmatrelvir/ritonavir in mitigating the risk of severe or critical illness, including death, among patients with COVID-19 during the periods in which the Omicron BN.1 variant and BA.5 variant predominated. Participants were stratified based on vaccination status (unvaccinated or vaccinated), age group (≥60 years, ≥70 years, or ≥80 years), and sex (male or female).
- Statistical Analysis
- Descriptive statistics (expressed as frequencies and percentages) were used to characterize the study participants and to compare the groups that were untreated, treated with nirmatrelvir/ritonavir, unvaccinated, and vaccinated. The chi-square test was employed to compare categorical variables across these groups. To address potential confounders and establish the appropriate sample size, propensity score matching was utilized. This method matched patients who received nirmatrelvir/ritonavir from the BA.5 and BN.1 groups. Specifically, 62,987 patients in the BN.1 group were matched with 251,948 patients in the BA.5 group at a 1:4 ratio (Table 1). The chi-square test was again used to compare categorical variables between these matched groups. Multivariable logistic regression analysis was conducted to evaluate the risk of severe or critical disease, including death, among patients with COVID-19 based on their nirmatrelvir/ritonavir treatment status (treated vs. not treated) within both BA.5 and BN.1 groups. Additionally, within the nirmatrelvir/ritonavir-treated cohort, hierarchical multivariable logistic regression analysis was employed to determine the treatment’s effect in the BN.1 group relative to the BA.5 cohort. These analyses were adjusted for age, sex, underlying medical conditions, and vaccination status. All statistical analyses were carried out using SAS ver. 9.4 (SAS Institute). The tests were 2-sided, and p-values below 0.05 were considered to indicate statistical significance.
- Ethics Statement
- The study protocol underwent review and received approval from the institutional review board of the Korea National Institute of Health (approval no: KDCA-2023-07-02-PE-01). The requirement for informed consent was waived.
Materials and Methods
- Study Population Characteristics
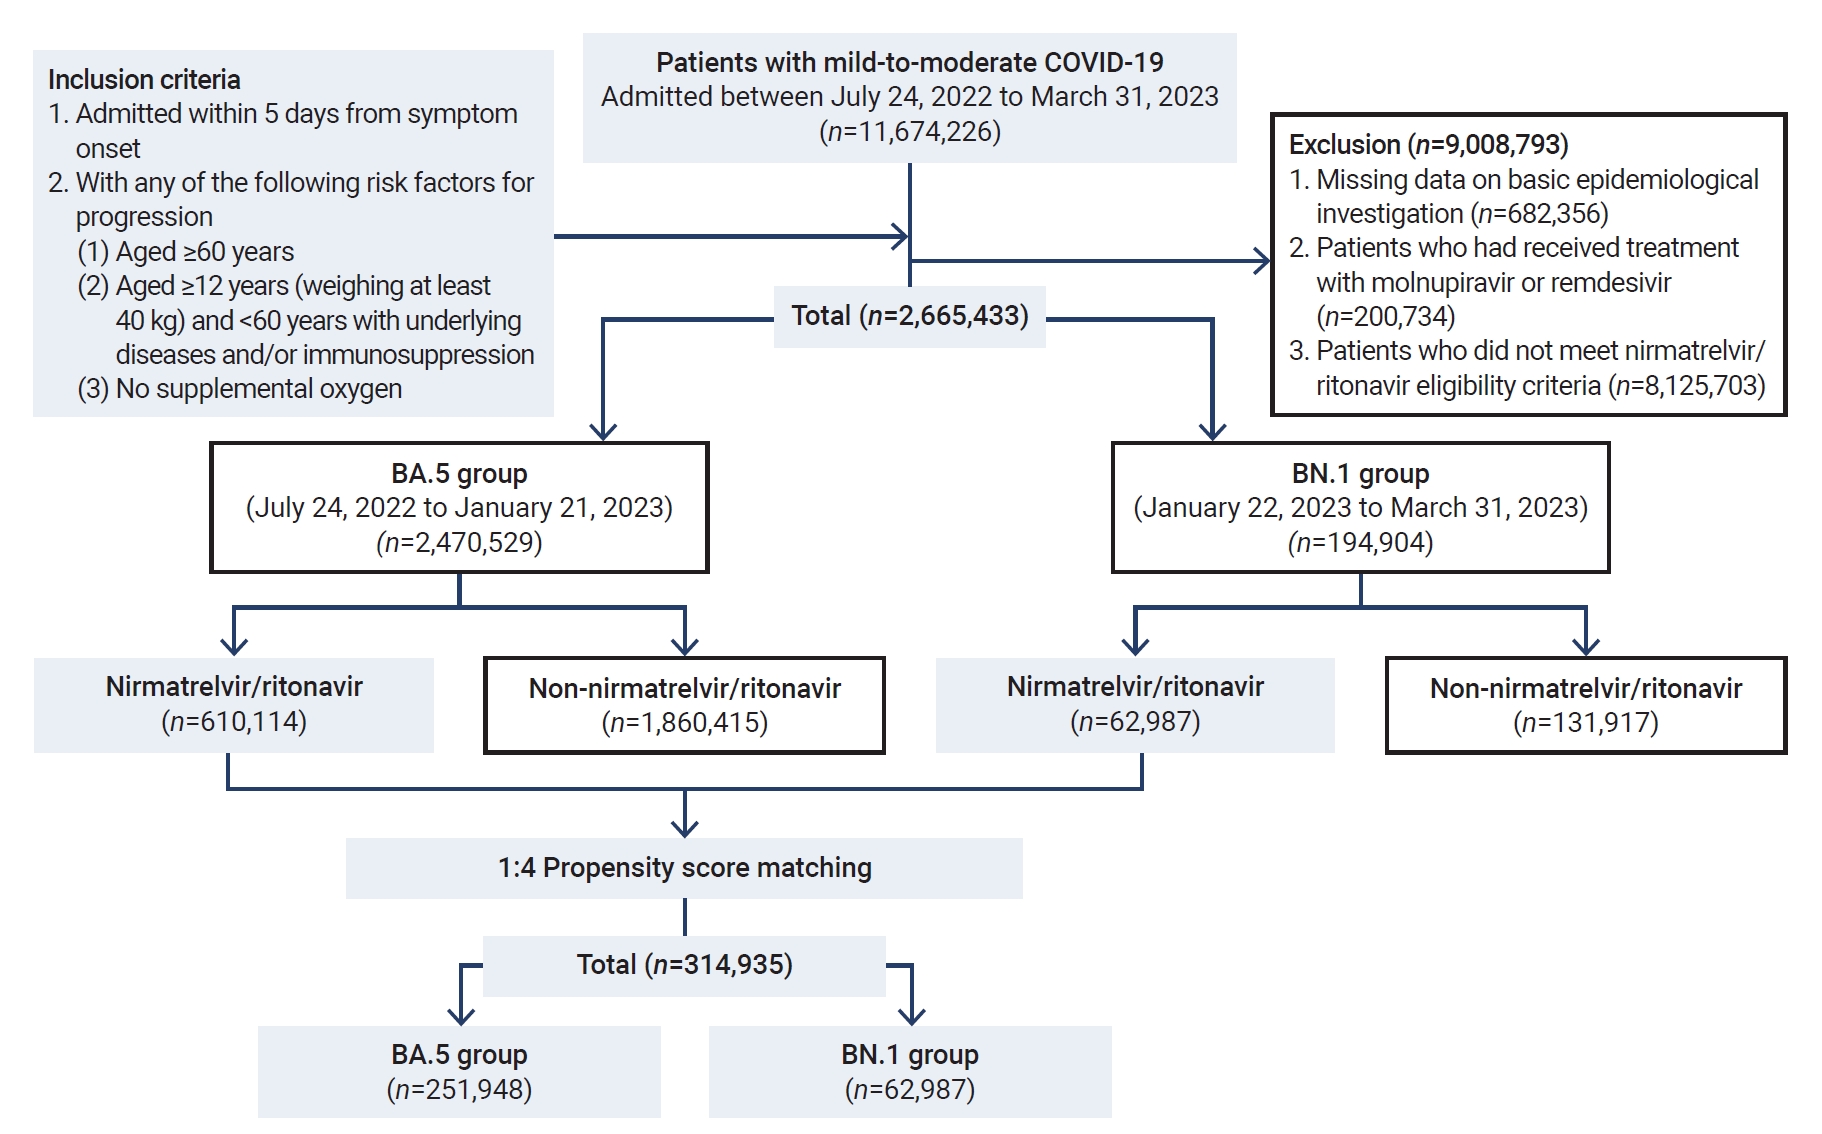
- During the period of this nationwide retrospective cohort study, we screened 2,470,529 patients with mild-to-moderate COVID-19 who were enrolled in the DUR system for patient care. Following the exclusion of 6,965,801 patients, a total of 2,665,433 patients who were eligible for nirmatrelvir/ritonavir treatment were included in the study. The patients were classified into the BA.5 group (n=2,470,529) and the BN.1 group (n=194,904) (Figure 2).
- In the BA.5 period, of the 610,114 patients (24.7%) who were treated with nirmatrelvir/ritonavir, 545,536 (89.4%) were at least 60 years old. Within this older demographic, the 60–69-year age bracket contained the largest number of patients, with 255,996 individuals (42.0%). The most prevalent comorbidities among these patients were hypertension (245,760, 40.3%), hyperlipidemia (129,218, 21.2%), and diabetes (122,472, 20.1%), as shown in Table 2.
- In the BN.1 group, of the 62,987 patients (32.3%) who were treated with nirmatrelvir/ritonavir, 56,152 (89.1%) were aged 60 years or older. Among these older participants, the largest age subgroup was those aged 60–69 years, accounting for 25,786 patients (40.9%). The most common comorbid conditions included hypertension (25,431, 40.4%), hyperlipidemia (14,143, 22.5%), and diabetes (12,565, 20.0%).
- Overall, more than 95% of the patients included in the analysis were fully vaccinated against SARS-CoV-2. Factors such as sex, age, presence of underlying diseases (including multiple underlying conditions), and severe or critical nature of the illness (including death) differed significantly based on whether patients received nirmatrelvir/ritonavir treatment (Table 3).
- Effectiveness of Nirmatrelvir/Ritonavir in the BA.5 and BN.1 Groups
- Multivariable logistic regression was performed to assess the effect of nirmatrelvir/ritonavir use on severe or critical illness (including death) and on death alone. The risk of these outcomes was lower among patients who received nirmatrelvir/ritonavir treatment than among those who did not, regardless of age, sex, or vaccination status (Table 4).
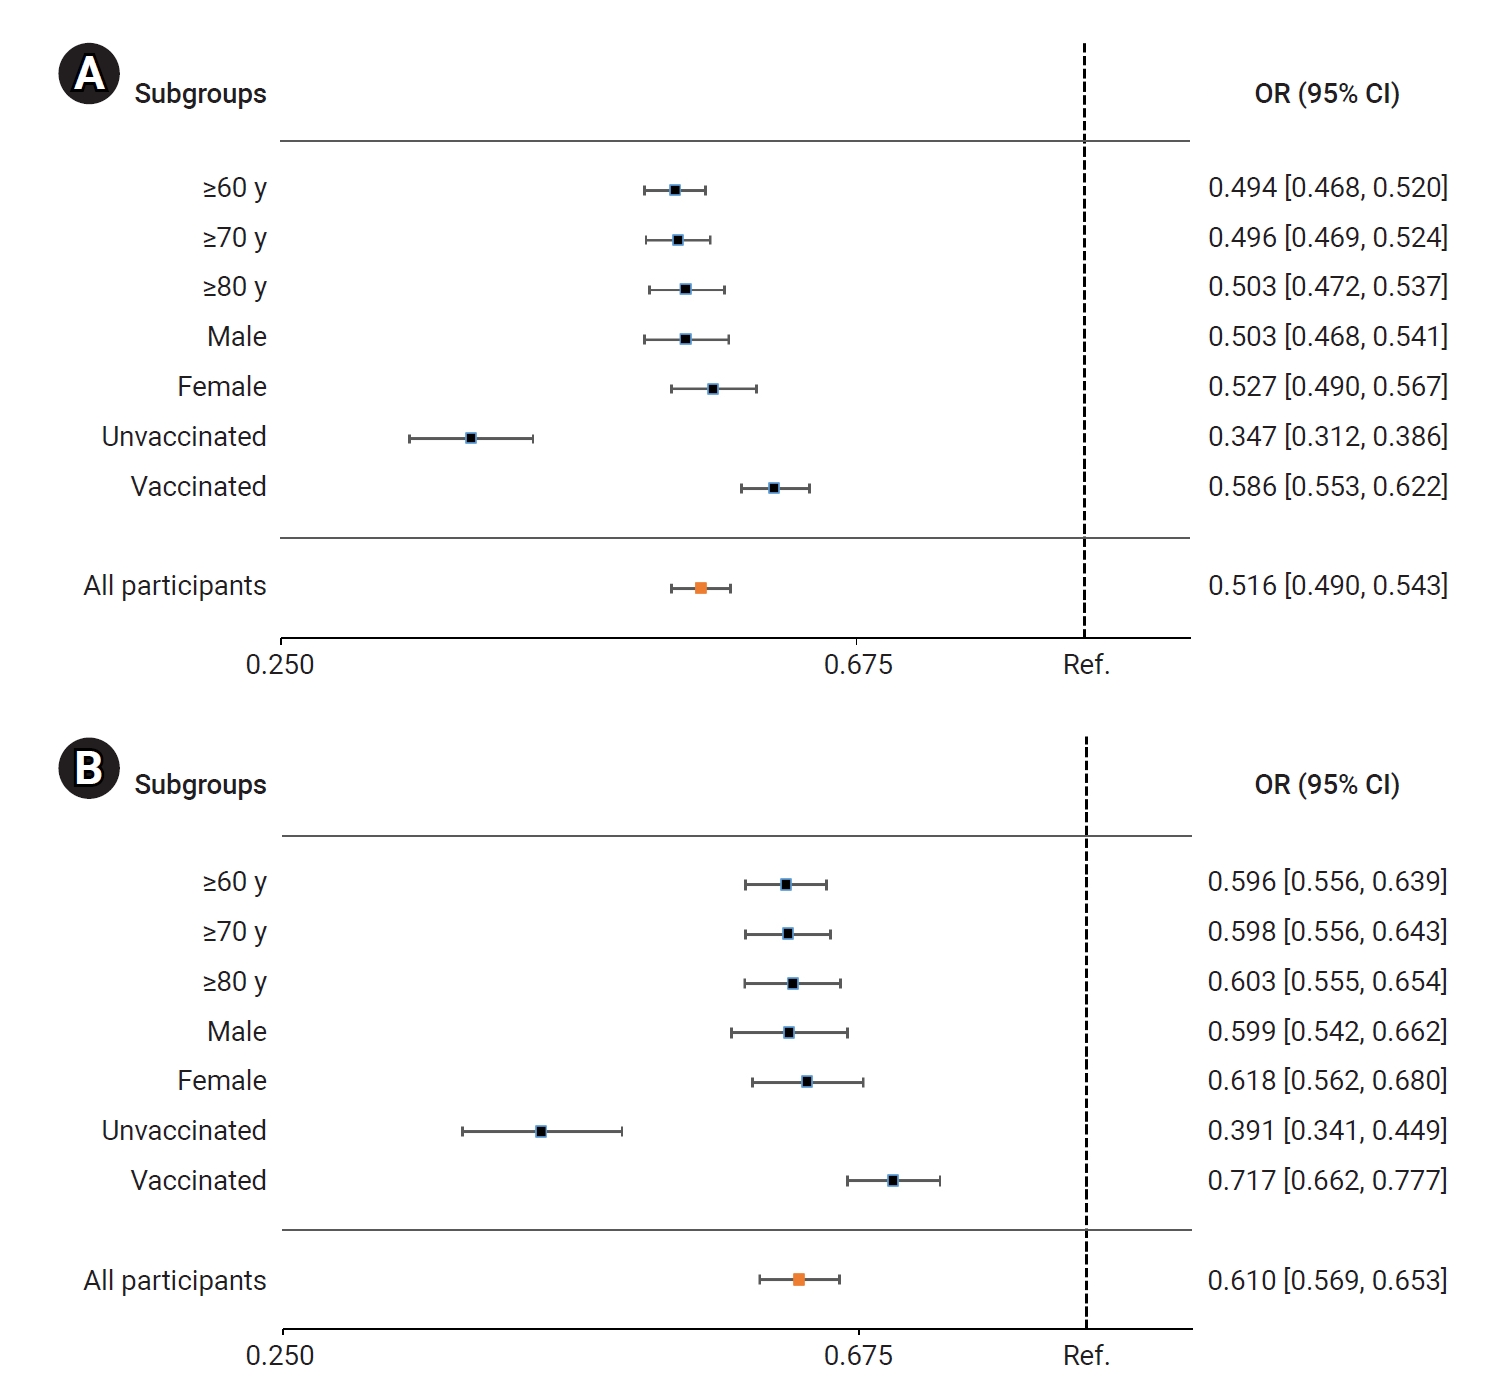
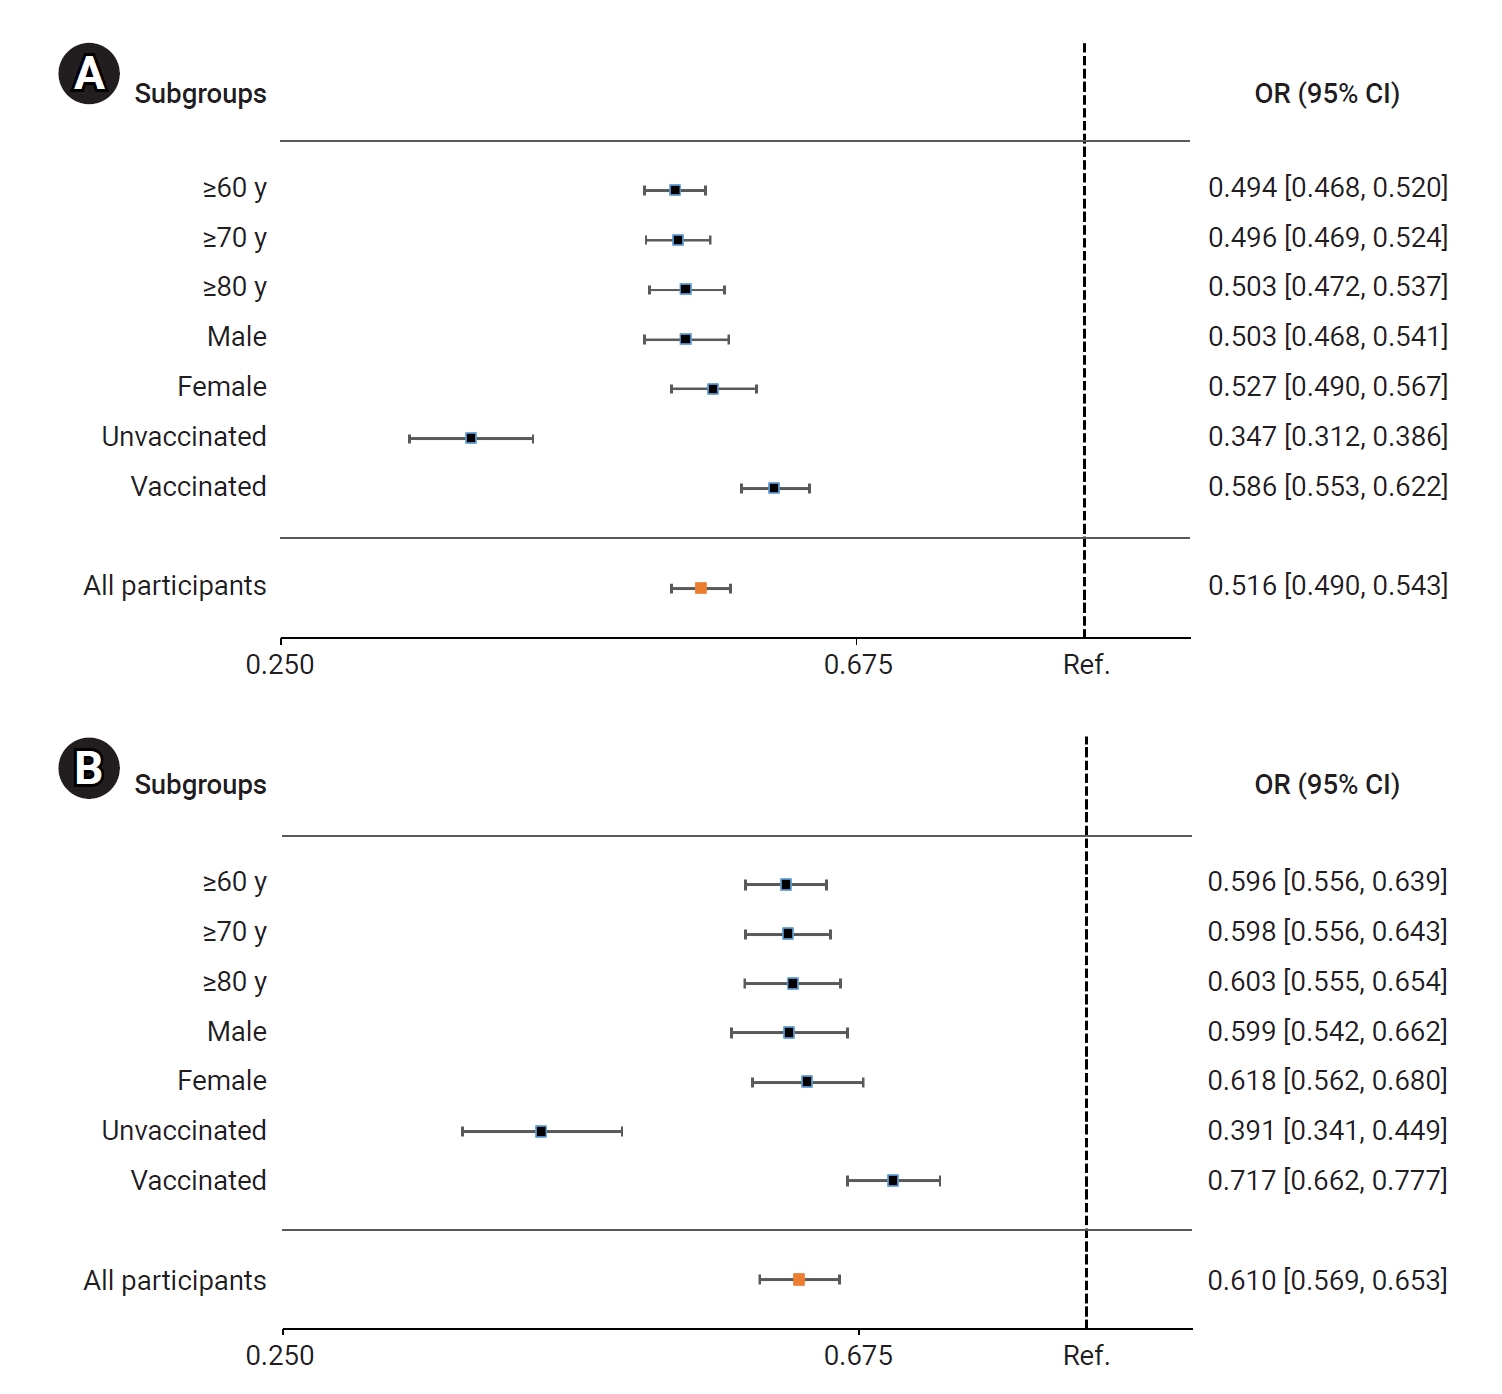
- In the BA.5 group, patients treated with nirmatrelvir/ritonavir had a significantly lower risk of severe or critical illness, including death, compared to the untreated group. The adjusted odds ratio (OR) for receiving nirmatrelvir/ritonavir treatment, with 95% CI, was 0.516 (0.490–0.543). Among older adults, the ORs (95% CIs) for those aged ≥60 years, ≥70 years, and ≥80 years were 0.494 (0.468–0.520), 0.496 (0.469–0.524), and 0.503 (0.472–0.537), respectively. The ORs (95% CIs) for men and women were 0.503 (0.468–0.541) and 0.527 (0.490–0.567), respectively. For unvaccinated and vaccinated patients, the ORs (95% CIs) were 0.347 (0.312–0.386) and 0.586 (0.553–0.622), respectively (Figure 3A; Table S1). Comparatively, the risk of death was significantly reduced in the nirmatrelvir/ritonavir treatment group compared to the untreated group. The adjusted OR (95% CI) for all nirmatrelvir/ritonavir-treated patients was 0.610 (0.569–0.653). In older adults, the ORs (95% CIs) for those aged ≥60 years, ≥70 years, and ≥80 years were 0.596 (0.556–0.639), 0.598 (0.556–0.643), and 0.603 (0.555–0.654), respectively. For men and women, the ORs (95% CIs) were 0.599 (0.542–0.662) and 0.618 (0.562–0.680), respectively. Similarly, for unvaccinated and vaccinated patients, the ORs (95% CIs) were 0.379 (0.328–0.438) and 0.714 (0.660–0.772), respectively (Figure 3B; Table S1).
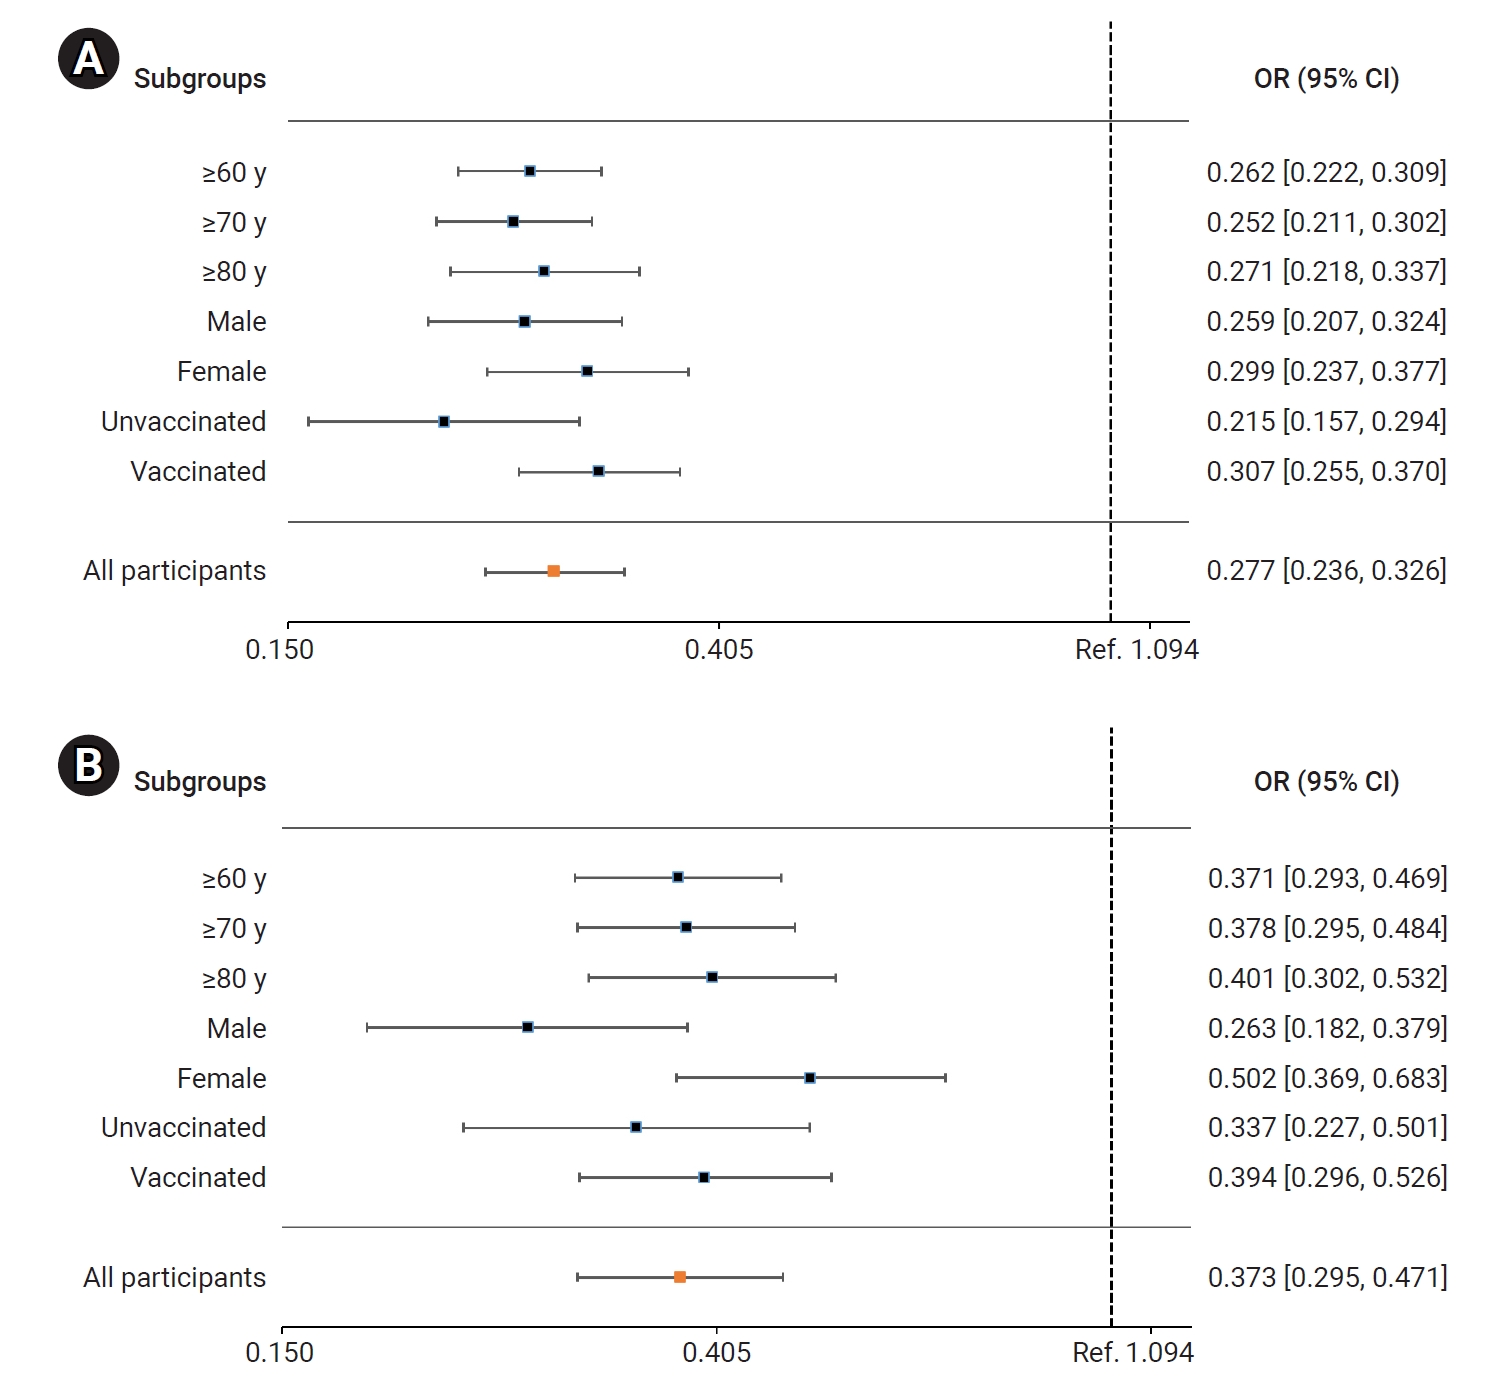
- In the BN.1 group, the patients treated with nirmatrelvir/ritonavir faced a significantly lower risk of severe or critical illness (including death) than those who did not receive this treatment. The adjusted OR (95% CI) for receiving nirmatrelvir/ritonavir treatment was 0.279 (0.237–0.327). Among older adults, the ORs (95% CIs) for those aged ≥60 years, ≥70 years, and ≥80 years were 0.262 (0.222–0.309), 0.252 (0.211–0.302), and 0.271 (0.218–0.337), respectively. The ORs (95% CIs) for men and women were 0.259 (0.207–0.324) and 0.299 (0.237–0.377), respectively. For unvaccinated and vaccinated patients, the ORs (95% CIs) were 0.215 (0.157–0.294) and 0.307 (0.255–0.370), respectively (Figure 4A; Table S2). Similarly, the risk of death was significantly reduced in the nirmatrelvir/ritonavir treatment group compared to the untreated group. The adjusted OR (95% CI) for all patients treated with nirmatrelvir/ritonavir was 0.373 (0.295–0.471). In older adults, the ORs (95% CIs) for those aged ≥60 years, ≥70 years, and ≥80 years were 0.371 (0.293–0.469), 0.278 (0.295–0.484), and 0.401 (0.302–0.532), respectively. The ORs (95% CIs) for men and women were 0.263 (0.182–0.379) and 0.502 (0.369–0.683), respectively. For unvaccinated and vaccinated patients, the ORs (95% CIs) were 0.337 (0.227–0.501) and 0.394 (0.296–0.526), respectively (Figure 4B; Table S2).
- Propensity Score Matching for Sample Size Determination
- The proportion of patients who received nirmatrelvir/ritonavir was similar between the BA.5 and BN.1 groups, although the BA.5 group included more cases. We therefore employed the propensity score matching technique to match patients who received nirmatrelvir/ritonavir from the BA.5 and BN.1 groups. Specifically, patients from the BN.1 group (n=62,987) were matched with those from the BA.5 group (n=251,948) at a 1:4 ratio. Following propensity score matching, the patient characteristics were found to be balanced across groups, as demonstrated by the chi-square test (p>0.1). For both groups, the percentage of patients aged ≥60 years and the vaccination rates were 89.1% and 94.6%, respectively, with chi-square test p-values of 0.999 and 0.915, respectively (Table 1).
- Comparative Effectiveness of Nirmatrelvir/Ritonavir in the BN.1 and BA.5 Groups
- Among the patients who received nirmatrelvir/ritonavir treatment, multivariable logistic regression was performed to assess the effect of nirmatrelvir/ritonavir in the BN.1 group compared to that in the BA.5 group (Table 5).
- In model 1 (unadjusted), the risk of death was significantly lower for the BN.1 group (OR, 0.707; 95% CI, 0.566–0.883) compared to the BA.5 group. However, no significant reduction was observed in the risk of severe or critical illness (including death) for the BN.1 group (OR, 0.876; 95% CI, 0.747–1.029). In model 2, which was adjusted for age and sex, the risk of death for the BN.1 group was significantly lower (OR, 0.699; 95% CI, 0.559–0.874) than for the BA.5 group. Nonetheless, the risk of severe or critical illness (including death) for the BN.1 group was not significantly reduced (OR, 0.871; 95% CI, 0.742–1.023). In model 3, which included adjustments for vaccination status and underlying disease in addition to the factors in model 2, the risk of death for the BN.1 group remained significantly lower (OR, 0.698; 95% CI, 0.557–0.875) compared to the BA.5 group. However, the risk of severe or critical illness (including death) was again statistically similar for the BN.1 group relative to the BA.5 group (OR, 0.856; 95% CI, 0.728–1.007).
Results
- This nationwide study evaluated the effectiveness of nirmatrelvir/ritonavir throughout the periods dominated by the BA.5 and BN.1 Omicron variants. The sample size was sufficiently large to yield a reliable estimation of risk. Compared to the prior period, the efficacy of nirmatrelvir/ritonavir did not significantly differ during the interval of Omicron BN.1 variant predominance in the Republic of Korea. This was despite initial concerns about a potential reduction in the drug’s effectiveness following the transition from BA.5 to BN.1 as the most common viral variant.
- Recent studies have indicated that during the Omicron surge, individuals who received nirmatrelvir/ritonavir experienced significantly lower rates of hospitalization and death from COVID-19 compared to those who did not receive the treatment [16−18]. Additionally, our prior research demonstrated that nirmatrelvir/ritonavir effectively decreased the risk of COVID-19 mortality in patients infected with the Omicron BA.5 variant, particularly in older adults, regardless of vaccination status [19]. This analysis further revealed that during periods when each viral variant was predominant, the likelihood of severe or critical illness, including death, was significantly reduced in the group treated with nirmatrelvir/ritonavir compared to the untreated group. Furthermore, among the patients who received nirmatrelvir/ritonavir, the risk of death was significantly lower in patients within the BN.1 cohort than in those within the BA.5 group. We also observed no significant difference in the risk of severe or critical illness, including mortality, between the BA.5 and BN.1 groups. Consequently, our study indicates that the risk of severe outcomes is either significantly lower or similar for cases during the BN.1 period compared to the BA.5 interval. These findings align with the results from in vitro studies conducted during the early stages of the Omicron surge, which revealed potent inhibition of this variant by nirmatrelvir [20−23]. Additionally, the antiviral efficacy of nirmatrelvir against 27 SARS-CoV-2 variants, including BA.5 and BN.1, was sustained, suggesting that these drugs remain viable treatment options for COVID-19 [24]. Therefore, our study demonstrates that the use of nirmatrelvir/ritonavir represented a significant independent predictor of reduced mortality risk during the periods dominated by the BA.5 and BN.1 Omicron variants.
- COVID-19 vaccines, such as the Moderna (mRNA-1273) and Pfizer-BioNTech (BNT162b2) vaccines, play a crucial role in reducing the risk of SARS-CoV-2 infection and COVID-19–related hospitalization [25,26]. In response to the January 2022 surge of the Omicron variant, the KDCA recommended 2 primary defenses—COVID-19 vaccination and antiviral therapy—to safeguard convalescent hospitals, long-term care facilities, and high-risk populations from severe COVID-19 [27]. As of July 20, 2023, 86.5% of the Korean population aged 5 years and older had been vaccinated against COVID-19 [28]. However, the present study noted a decrease in vaccine effectiveness against infection and hospital admission for Omicron compared to earlier variants [29−31]. This suggests that the Omicron variant may evade the immune response elicited by vaccination or previous infection with other variants, potentially leading to higher transmissibility [32−34]. In the subgroup analyses of study outcomes based on vaccination status, the therapeutic effect of nirmatrelvir/ritonavir was more pronounced among the unvaccinated participants than in the vaccinated group during the periods dominated by the BA.5 and BN.1 Omicron subvariants. Our analysis only considered whether patients had received at least 1 vaccine dose prior to the onset of COVID-19, with 95.2% of the study population being vaccinated under this definition. Consequently, additional research is required to assess the real-world efficacy of nirmatrelvir/ritonavir in treating COVID-19, taking into account variations in patient immunity due to vaccination history and prior infection.
- This study had several limitations, given its observational and retrospective nature. First, we were unable to confirm whether patients had completed the prescribed 5-day course of nirmatrelvir/ritonavir treatment. As a result, the treatment group may have included patients who did not complete the full course of therapy. Second, factors such as vaccination history (including booster doses) and prior infection play key roles in disease severity and mortality. These were not considered in our study, which could have led to an underestimation of the effects of nirmatrelvir/ritonavir. Third, the KDCA recommend initiating nirmatrelvir/ritonavir therapy within the first 5 days of symptom onset. Our study did not incorporate the timing of symptom onset relative to the COVID-19 diagnosis or the prescription of nirmatrelvir/ritonavir. Fourth, due to the absence of relevant clinical information, we could not determine whether the observed preventive effects against severe/critical illness (including death) and death alone were attributable to nirmatrelvir/ritonavir or to the effectiveness of other treatments, such as monoclonal antibodies. Fifth, while this study analyzed the effectiveness of nirmatrelvir/ritonavir, it did not collect any data on the drug’s safety. Consequently, further research into the safety profile of nirmatrelvir/ritonavir is essential to provide patients with accurate information and support informed decision-making.
Discussion
- Our study suggests that treatment with nirmatrelvir/ritonavir remains effective against COVID-19, even with the emergence of the BN.1 variant supplanting BA.5. In both subvariant cohorts, nirmatrelvir/ritonavir treatment was associated with a reduced risk of severe or critical illness, including death, compared to those who did not receive treatment. Consequently, we recommend administering nirmatrelvir/ritonavir to patients exhibiting COVID-19-related symptoms, irrespective of the dominant Omicron variant or the patient’s vaccination status. This approach is likely to lower the risk of severe or critical illness, decrease mortality, and help control the spread of COVID-19.
Conclusion
- • We assessed the efficacy of nirmatrelvir/ritonavir in the treatment of COVID-19, particularly among patients aged 60 years and older, in a comparison of Omicron subvariants BN.1 and BA.5 using real-world data.
- • Nirmatrelvir/ritonavir remained effective during the period of Omicron BA.1 dominance, significantly reducing mortality risk. A statistically insignificant decrease in severe illness was also noted.
- • Regardless of Omicron variant or vaccination status, nirmatrelvir/ritonavir administration is recommended to reduce the risks of severe illness and death from COVID-19.
- • This study underscores the continued relevance of nirmatrelvir/ritonavir under Omicron-dominant conditions, offering essential insights for clinical practice and patient care.
HIGHLIGHTS
Supplementary Material
Table S1.
Table S2.
-
Ethics Approval
This study received approval from the institutional review board of the Korea National Institute of Health (approval no: KDCA-2023-07-02-PE-01). Due to the retrospective nature of the research, the requirement for informed consent was waived.
-
Conflicts of Interest
The authors have no conflicts of interest to declare.
-
Funding
None.
-
Availability of Data
The study’s data sets are securely stored in coded form at the KDCA. The KDCA is legally obligated by a data-sharing agreement with the HIRA to prohibit disclosure of the dataset. Nevertheless, researchers who meet certain criteria may access the data for research purposes via the HIRA Bigdata Open portal (https://opendata.hira.or.kr).
-
Authors’ Contributions
Conceptualization: DHK, MGY; Data curation: MGY; Formal analysis: MGY; Investigation: DHK, NYK, Park HR, MA, SJJ, MJ, SYC; Methodology: MGY; Project administration: DHK; Resources: MGY; Software: MGY; Supervision: JK; Validation: DHK, MGY; Visualization: DHK, MGY; Writing–original draft: DHK; Writing–review & editing: all authors. All authors read and approved the final manuscript.
-
Additional Contributions
We would like to extend our sincere gratitude to the DUR program and the HIRA for supplying the necessary datasets for this study.
Article information


| Characteristic |
Non-matching |
1:4 Propensity score matching |
||||
|---|---|---|---|---|---|---|
| BA.5 | BN.1 | p | BA.5 | BN.1 | p | |
| Participants | 610,114 (24.7) | 62,987 (32.3) | 251,948 (80.0) | 62,987 (32.3) | ||
| Sex | <0.001 | 1.000 | ||||
| Male | 251,109 (41.2) | 24,933 (39.6) | 99,732 (39.6) | 24,933 (39.6) | ||
| Female | 359,005 (58.8) | 38,054 (60.4) | 152,216 (60.4) | 38,054 (60.4) | ||
| Age (y) | 69.4±11.2 | 69.5±11.6 | 0.911 | 69.4±11.6 | 69.5±11.7 | 0.897 |
| Age group (y) | <0.001 | 0.999 | ||||
| ≤39 | 9,584 (1.6) | 1,277 (2.0) | 5,084 (2.0) | 1,277 (2.0) | ||
| 40–49 | 14,526 (2.4) | 1,569 (2.5) | 6,309 (2.5) | 1,569 (2.5) | ||
| 50–59 | 40,438 (6.6) | 3,992 (6.3) | 15,984 (6.3) | 3,992 (6.3) | ||
| 60–69 | 255,996 (42.0) | 25,786 (40.9) | 103,170 (41.0) | 25,786 (40.9) | ||
| 70–79 | 173,438 (28.4) | 17,972 (28.5) | 71,885 (28.5) | 17,972 (28.5) | ||
| ≥80 | 116,132 (19.0) | 12,391 (19.7) | 49,516 (19.7) | 12,391 (19.7) | ||
| SARS-CoV-2 immunitya) | <0.001 | 0.9150 | ||||
| Unvaccinated | 29,858 (4.9) | 3,388 (5.4) | 13,525 (5.4) | 3,388 (5.4) | ||
| Vaccinated | 580,256 (95.1) | 59,599 (94.6) | 238,423 (94.6) | 59,599 (94.6) | ||
| Underlying diseases | ||||||
| Hypertension | 245,760 (40.3) | 25,431 (40.4) | 0.647 | 101,358 (40.2) | 25,431 (40.4) | 0.506 |
| Hyperlipidemia | 122,472 (20.1) | 12,565 (20.0) | 0.456 | 51,204 (20.3) | 12,565 (20.0) | 0.036 |
| Diabetes | 129,218 (21.2) | 14,143 (22.5) | <0.001 | 51,968 (20.6) | 14,143 (22.5) | <0.001 |
| Cardiovascular diseases | 28,605 (4.7) | 2,828 (4.5) | 0.025 | 12,309 (4.9) | 2,828 (4.5) | <0.001 |
| Kidney failure | 4,036 (0.7) | 357 (0.6) | 0.005 | 1,835 (0.7) | 357 (0.6) | <0.001 |
| Immunosuppression | 5,416 (0.9) | 503 (0.8) | 0.023 | 2,404 (1.0) | 503 (0.8) | 0.001 |
| Chronic obstructive pulmonary disease | 5,403 (0.9) | 449 (0.7) | <0.001 | 2,801 (1.1) | 449 (0.7) | <0.001 |
| Severe illness or death | 1,932 (0.3) | 183 (0.3) | 0.265 | 835 (0.3) | 183 (0.3) | 0.106 |
| Death | 1,111 (0.2) | 91 (0.1) | 0.033 | 515 (0.2) | 91 (0.1) | 0.002 |
Data are presented n (%) or mean±standard deviation. Chi-square tests were employed to determine differences between the groups based on nirmatrelvir/ritonavir treatment history.
SARS-CoV-2, severe acute respiratory syndrome coronavirus 2.
a) (1) Unvaccinated: Individuals who have not been vaccinated or who are within 14 days of receiving their first dose of a vaccine; (2) Vaccinated: Individuals who are 14 days or more past receiving their second dose of a vaccine. Those who received the Janssen vaccine were considered as having received the second dose after the first dose was administered.
| Variable | No nirmatrelvir/ritonavir | Nirmatrelvir/ritonavir | p |
|---|---|---|---|
| Participants | 1,860,415 (75.3) | 610,114 (24.7) | |
| Sex | <0.001 | ||
| Male | 781,055 (42.0) | 251,109 (41.2) | |
| Female | 1,079,360 (58.0) | 359,005 (58.8) | |
| Age (y) | 64.4±12.3 | 69.4±11.2 | <0.001 |
| Age group (y) | <0.001 | ||
| ≤39 | 36,051 (3.4) | 9,584 (1.6) | |
| 40–49 | 130,499 (7.0) | 14,526 (2.4) | |
| 50–59 | 300,258 (16.1) | 40,438 (6.6) | |
| 60–69 | 773,965 (41.6) | 255,996 (42.0) | |
| 70–79 | 393,648 (21.2) | 173,438 (28.4) | |
| ≥80 | 198,994 (10.7) | 116,132 (19.0) | |
| SARS-CoV-2 immunitya) | <0.0001 | ||
| Unvaccinated | 83,319 (4.5) | 29,858 (4.9) | |
| Vaccinated | 1,777,096 (95.5) | 580,256 (95.1) | |
| Underlying diseases | |||
| Hypertension | 865,571 (46.5) | 245,760 (40.3) | <0.001 |
| Diabetes | 410,376 (22.1) | 122,472 (20.1) | <0.001 |
| Hyperlipidemia | 469,378 (25.2) | 129,218 (21.2) | <0.001 |
| Cardiovascular diseases | 92,292 (5.0) | 28,605 (4.7) | <0.001 |
| Immunosuppression | 9,318 (0.5) | 4,036 (0.7) | <0.001 |
| Kidney failure | 30,366 (1.6) | 5,416 (0.9) | <0.001 |
| Chronic obstructive pulmonary disease | 27,036 (1.5) | 5,403 (0.9) | <0.001 |
| Severe illness or death | 7,351 (0.4) | 1,932 (0.3) | <0.001 |
| Death | 3,415 (0.2) | 1,111 (0.2) | 0.8165 |
Data are presented n (%) or mean±standard deviation. Chi-square tests were employed to determine differences between the groups based on nirmatrelvir/ritonavir treatment history.
SARS-CoV-2, severe acute respiratory syndrome coronavirus 2.
a) (1) Unvaccinated: Individuals who have not been vaccinated or who are within 14 days of receiving their first dose of a vaccine; (2) Vaccinated: Individuals who are 14 days or more past receiving their second dose of a vaccine. Those who received the Janssen vaccine were considered as having received the second dose after the first dose was administered.
| Variable | No nirmatrelvir/ritonavir | Nirmatrelvir/ritonavir | p |
|---|---|---|---|
| Participants | 131,917 (67.7) | 62,987 (32.3) | |
| Sex | <0.001 | ||
| Male | 55,009 (41.7) | 24,933 (39.6) | |
| Female | 76,908 (58.3) | 38,054 (60.4) | |
| Age (y) | 64.3±12.9 | 69.5±11.6 | <0.001 |
| Age group (y) | <0.001 | ||
| ≤39 | 5,170 (3.9) | 1,277 (2.0) | |
| 40–49 | 10,206 (7.7) | 1,569 (2.5) | |
| 50–59 | 22,205 (16.8) | 3,992 (6.3) | |
| 60–69 | 51,273 (38.9) | 25,786 (40.9) | |
| 70–79 | 27,239 (20.7) | 17,972 (28.5) | |
| ≥80 | 15,824 (12.0) | 12,391 (19.7) | |
| SARS-CoV-2 immunitya) | 0.029 | ||
| Unvaccinated | 7,415 (5.6) | 3,388 (5.4) | |
| Vaccinated | 124,502 (94.4) | 59,599 (94.6) | |
| Underlying diseases | |||
| Hypertension | 63,065 (47.8) | 25,431 (40.4) | <0.001 |
| Diabetes | 29,406 (22.3) | 12,565 (20.0) | <0.001 |
| Hyperlipidemia | 35,319 (26.8) | 14,143 (22.5) | <0.001 |
| Cardiovascular diseases | 6,513 (4.9) | 2,828 (4.5) | <0.001 |
| Immunosuppression | 740 (0.6) | 357 (0.6) | 0.8723 |
| Kidney failure | 2,301 (1.7) | 503 (0.8) | <0.001 |
| Chronic obstructive pulmonary disease | 1,876 (1.4) | 449 (0.7) | <0.001 |
| Severe illness or death | 1,003 (0.8) | 183 (0.3) | <0.001 |
| Death | 360 (0.3) | 91 (0.1) | <0.001 |
Data are presented n (%) or mean±standard deviation. Chi-square tests were employed to determine differences between the groups based on nirmatrelvir/ritonavir treatment history.
a) (1) Unvaccinated: Individuals who have not been vaccinated or who are within 14 days of receiving their first dose of a vaccine; (2) Vaccinated: Individuals who are 14 days or more past receiving their second dose of a vaccine. Those who received the Janssen vaccine were considered as having received the second dose after the first dose was administered.
The multivariable logistic regression models were adjusted for age, sex, vaccination status, and underlying diseases. The results are expressed as odds ratios (95% confidence intervals). Model 1 is unadjusted. Model 2 is adjusted for age and sex. Model 3 builds upon model 2 by also adjusting for vaccination status and underlying disease.
Ref., reference.
- 1. Zhou P, Yang XL, Wang XG, et al. Addendum: a pneumonia outbreak associated with a new coronavirus of probable bat origin. Nature 2020;588:E6.PubMedPMC
- 2. Zhu H, Wei L, Niu P. The novel coronavirus outbreak in Wuhan, China. Glob Health Res Policy 2020;5:6. ArticlePubMedPMCPDF
- 3. 3 Global Initiative on Sharing All Influenza Database (GISAID). hCoV-19 variants dashboard [Internet]. GISAID; 2008 [cited 2023 Aug 5]. Available from: https://gisaid.org/hcov-19-variants-dashboard/.
- 4. Korea Disease Control and Prevention Agency (KDCA). Press release (December 2): Emergency implementation to block inflow into Korea and prevent transmission of a total of 5 confirmed cases of Omicron mutant virus in Korea [Internet]. KDCA; 2021 [cited 2023 Aug 5]. Available from: https://www.kdca.go.kr/board/board.es?mid=a20501010000&bid=0015&list_no=717719&cg_code=&act=view&nPage=2. Korean.
- 5. Korea Disease Control and Prevention Agency (KDCA). Press release (January 24): Characteristic analysis and diffusion contrast of Omicron variation [Internet]. KDCA; 2021 [cited 2023 Aug 5]. Available from: https://www.kdca.go.kr/board/board.es?mid=a20501020000&bid=0015&list_no=718415&cg_code=C01&act=view&nPage=2. Korean.
- 6. Kim EY, Choe YJ, Park H, et al. Community transmission of SARS-CoV-2 Omicron variant, South Korea, 2021. Emerg Infect Dis 2022;28:898−900.PubMedPMC
- 7. Korea Disease Control and Prevention Agency (KDCA). Press release (February 1) [Internet]. KDCA; 2023 [cited 2023 Feb 1]. Available from: https://www.kdca.go.kr/board/board.es?mid=a20501010000&bid=0015&list_no=721806&cg_code=&act=view&nPage=29. Korean.
- 8. Gupta A, Gonzalez-Rojas Y, Juarez E, et al. Effect of sotrovimab on hospitalization or death among high-risk patients with mild to moderate COVID-19: a randomized clinical trial. JAMA 2022;327:1236−46.PubMedPMC
- 9. Hammond J, Leister-Tebbe H, Gardner A, et al. Oral nirmatrelvir for high-risk, nonhospitalized adults with COVID-19. N Engl J Med 2022;386:1397−408.ArticlePubMedPMC
- 10. Jayk Bernal A, Gomes da Silva MM, Musungaie DB, et al. Molnupiravir for oral treatment of COVID-19 in nonhospitalized patients. N Engl J Med 2022;386:509−20.ArticlePubMedPMC
- 11. Korea Disease Control and Prevention Agency (KDCA). Press release (January 14): Initiation of the first administration of oral antiviral drugs for patients at home treatment [Internet]. KDCA; 2023 [cited 2023 Aug 5]. Available from: https://www.kdca.go.kr/board/board.es?mid=a20501010000&bid=0015&list_no=718310&cg_code=&act=view&nPage=115. Korean.
- 12. Najjar-Debbiny R, Gronich N, Weber G, et al. Effectiveness of paxlovid in reducing severe coronavirus disease 2019 and mortality in high-risk patients. Clin Infect Dis 2023;76:e342−9.ArticlePubMedPMCPDF
- 13. Weng C, Xie R, Han G, et al. Safety and efficacy of paxlovid against Omicron variants of coronavirus disease 2019 in elderly patients. Infect Dis Ther 2023;12:649−62.ArticlePubMedPMCPDF
- 14. Korea Disease Control and Prevention Agency (KDCA). Guidelines for the therapeutics of COVID-19 [Internet]. KDCA; 2023 [cited 2023 Aug 5]. Available from: https://www.kdca.go.kr/board/board.es?mid=a20507020000&bid=0019&act=view&list_no=718694&tag=&nPage=1. Korean.
- 15. Korea Disease Control and Prevention Agency (KDCA). Coronavirus disease 2019 response and management guidelines for local governments in South Korea (edition 13-1) [Internet]. KDCA; 2023 [cited 2023 Aug 5]. Available from: https://www.kdca.go.kr/board/boardApi.es?mid=a20507050000&bid=0080:. Korean.
- 16. Chokkalingam AP, Hayden J, Goldman JD, et al. Association of remdesivir treatment with mortality among hospitalized adults with COVID-19 in the United States. JAMA Netw Open 2022;5:e2244505.ArticlePubMedPMC
- 17. Lakhanpal M, Sarkar D, Kumar R, et al. Reduction in the rate of mortality of moderate to severe COVID 19 infected patients with the use of remdesivir: a tertiary care hospital-based retrospective observational study. Anesth Essays Res 2022;16:296−300.ArticlePubMedPMC
- 18. Russo P, Tacconelli E, Olimpieri PP, et al. Mortality in SARS-CoV-2 hospitalized patients treated with remdesivir: a nationwide, registry-based study in Italy. Viruses 2022;14:1197. ArticlePubMedPMC
- 19. Kim JM, Yoo MG, Bae SJ, et al. Effectiveness of paxlovid, an oral antiviral drug, against the Omicron BA.5 variant in Korea: severe progression and death between July and November 2022. J Korean Med Sci 2023;38:e211.ArticlePubMedPMCPDF
- 20. Li P, Wang Y, Lavrijsen M, et al. SARS-CoV-2 Omicron variant is highly sensitive to molnupiravir, nirmatrelvir, and the combination. Cell Res 2022;32:322−4.ArticlePubMedPMCPDF
- 21. Takashita E, Kinoshita N, Yamayoshi S, et al. Efficacy of antibodies and antiviral drugs against COVID-19 Omicron variant. N Engl J Med 2022;386:995−8.ArticlePubMedPMC
- 22. Takashita E, Kinoshita N, Yamayoshi S, et al. Efficacy of antiviral agents against the SARS-CoV-2 Omicron subvariant BA.2. N Engl J Med 2022;386:1475−7.ArticlePubMed
- 23. Vangeel L, Chiu W, De Jonghe S, et al. Remdesivir, molnupiravir and nirmatrelvir remain active against SARS-CoV-2 Omicron and other variants of concern. Antiviral Res 2022;198:105252. ArticlePubMedPMC
- 24. Cho J, Shin Y, Yang JS, et al. Evaluation of antiviral drugs against newly emerged SARS-CoV-2 Omicron subvariants. Antiviral Res 2023;214:105609. ArticlePubMedPMC
- 25. Dagan N, Barda N, Kepten E, et al. BNT162b2 mRNA COVID-19 vaccine in a nationwide mass vaccination setting. N Engl J Med 2021;384:1412−23.ArticlePubMedPMC
- 26. Tenforde MW, Patel MM, Ginde AA, et al. Effectiveness of severe acute respiratory syndrome coronavirus 2 messenger RNA vaccines for preventing coronavirus disease 2019 hospitalizations in the United States. Clin Infect Dis 2022;74:1515−24.PubMed
- 27. Korea Disease Control and Prevention Agency (KDCA). Press release (August 12) [Internet]. KDCA; 2023 [cited 2023 Aug 5]. Available from: https://www.kdca.go.kr/board/board.es?mid=a20501010000&bid=0015&list_no=720511&cg_code=&act=view&nPage=62. Korean.
- 28. Korea Disease Control and Prevention Agency (KDCA). COVID-19 vaccination dashboard [Internet]. KDCA; 2023 [cited 2023 Aug 5]. Available from: https://ncv.kdca.go.kr/mainStatus.es?mid=a11702000000. Korean.
- 29. Collie S, Champion J, Moultrie H, et al. Effectiveness of BNT162b2 vaccine against Omicron variant in South Africa. N Engl J Med 2022;386:494−6.ArticlePubMedPMC
- 30. Johnson AG, Amin AB, Ali AR, et al. COVID-19 incidence and death rates among unvaccinated and fully vaccinated adults with and without booster doses during periods of Delta and Omicron variant emergence: 25 U.S. jurisdictions, April 4-December 25, 2021. MMWR Morb Mortal Wkly Rep 2022;71:132−8.ArticlePubMedPMC
- 31. Thompson MG, Natarajan K, Irving SA, et al. Effectiveness of a third dose of mRNA vaccines against COVID-19-associated emergency department and urgent care encounters and hospitalizations among adults during periods of Delta and Omicron variant predominance: VISION network, 10 states, August 2021-January 2022. MMWR Morb Mortal Wkly Rep 2022;71:139−45.PubMedPMC
- 32. Altarawneh HN, Chemaitelly H, Hasan MR, et al. Protection against the Omicron variant from previous SARS-CoV-2 infection. N Engl J Med 2022;386:1288−90.PubMed
- 33. Dejnirattisai W, Shaw RH, Supasa P, et al. Reduced neutralisation of SARS-CoV-2 Omicron B.1.1.529 variant by post-immunisation serum. Lancet 2022;399:234−6.ArticlePubMed
- 34. Kuhlmann C, Mayer CK, Claassen M, et al. Breakthrough infections with SARS-CoV-2 Omicron despite mRNA vaccine booster dose. Lancet 2022;399:625−6.ArticlePubMedPMC
References
Figure & Data
References
Citations
 Cite
Cite- Figure
-

- Related articles
-
- Risk factors for SARS-CoV-2 transmission during a movie theater outbreak in Incheon in the Republic of Korea, November 2021: a retrospective study
- Evaluation of COVID-19 vaccine effectiveness in different high-risk facility types during a period of Delta variant dominance in the Republic of Korea: a cross-sectional study
- Household secondary attack rates and risk factors during periods of SARS-CoV-2 Delta and Omicron variant predominance in the Republic of Korea
