
Articles
- Page Path
- HOME > Osong Public Health Res Perspect > Volume 14(5); 2023 > Article
-
Original Article
The associations of health behaviors and working hours with high-sensitivity C-reactive protein levels in Korean wage workers: a cross-sectional study -
Choong-Won Seo1
 , Eun-A Park2, Tae-Hyung Yoon3
 -
Osong Public Health and Research Perspectives 2023;14(5):356-467.
DOI: https://doi.org/10.24171/j.phrp.2023.0052
Published online: September 21, 2023
1Department of Biomedical Laboratory Science, Dong-Eui Institute of Technology, Busan, Republic of Korea
2Department of Nursing, Hwasung Medi-Science University, Hwaseong, Republic of Korea
3Department of Occupational Therapy, Dongseo University, Busan, Republic of Korea
- Corresponding author: Eun-A Park Department of Nursing, Hwasung Medi-Science University, 400-5 Namyangjungang-ro, Namyang-eup, Hwaseong 18274, Republic of Korea E-mail: pea0701@hsmu.ac.kr
© 2023 Korea Disease Control and Prevention Agency.
This is an open access article under the CC BY-NC-ND license (http://creativecommons.org/licenses/by-nc-nd/4.0/).
- 1,646 Views
- 47 Download
Abstract
-
Objectives
- We investigated differences in high-sensitivity C-reactive protein (hs-CRP) levels by age group according to working hours, socioeconomic level, health behavior and status, and occupational class, and aimed to identify factors affecting hs-CRP levels in various age groups using data from the Korean National Health and Nutrition Examination from 2016 to 2018.
-
Methods
- The study included a total of 4,786 male wage workers across the nation, aged between 19 and 65. Data from 4,674 workers were analyzed using multiple logistic regression analysis.
-
Results
- Obesity, metabolic syndrome, and weekly working hours were associated with hs-CRP, a biomarker of inflammation. Participants with a body mass index (BMI) ≥25.0 kg/m2 showed significantly higher hs-CRP levels than those with a BMI 23.0 to 25.0 kg/m2. Workers with high-risk drinking and metabolic syndrome showed significantly higher hs-CRP levels in the 50 to 65 years group. Obesity, walking 0 to 149 min/wk, and working ≥61 hours a week were associated with significantly higher hs-CRP levels in the 35 to 49 years group. The factors that significantly affected hs-CRP levels were different among age groups.
-
Conclusion
- Therefore, plans to adjust working hours should be considered health behaviors, such as drinking and physical activity, and health conditions, such as metabolic syndrome and obesity, according to workers’ age.
- In 1919, the International Labor Organization introduced the first agreement to limit daily working hours to 8 hours and weekly working hours to 48 hours in the manufacturing sector. A century has passed since then, and many countries have gradually reduced statutory working hours, with many now limiting them to 40 hours per week [1]. When Korea implemented a reduction in working hours on July 1, 2018, there was a significant decrease in working hours. However, it was reported that the proportion of employed individuals (28%) who still worked more than 48 hours per week was 12%p higher than the 16% reported in Europe in 2015 [2].
- Previous studies have suggested that long working hours have various impacts. In the short term, extended working hours can increase fatigue due to increased job demands, interference with personal life, and reduced sleep time. This can lead to negative health behaviors such as smoking and alcohol abuse [3]. These factors can increase the incidence of workplace accidents [4], mental illnesses [5], cerebro cardiovascular diseases [6], stress, and problems with the gastrointestinal, musculoskeletal, and immune systems [7]. On a societal level, these factors can lead to decreased productivity [8] and increased absenteeism in the long term [9]. Spurgeon et al. [10] suggested that working more than 48 hours a week can negatively impact mental health due to increased job stress. They also found that unhealthy behaviors such as smoking and poor eating habits, as well as a rise in physical diseases, increase with longer working hours. This is because extended labor hours not only lead to the accumulation of fatigue by reducing sufficient recovery time, but also rapidly deplete energy [11]. A recent study found that in men, working 61 hours or more per week was significantly associated with elevated aspartate transaminase and alanine transaminase levels compared to working 35 to 52 hours per week [12]. The study by Lee [13] found little difference in health status among management jobs, except for sales positions. However, health problems were more prevalent among service workers, functional workers, device assembly workers, and simple labor jobs. It was concluded that service workers, who perform emotional labor, and functional, device assembly, and simple laborers, who perform high-intensity physical labor, experience substantial health impacts from their work content [13].
- Nevertheless, more than 50 hours of work per week has been reported by 16.7% of managers, 10.0% of professionals and related workers, 8.3% of office workers, 32.0% of service workers, 33.7% of salespeople, 24.5% of skilled workers and agricultural and forestry workers, 27.6% of device/machine operators and assembly workers, and 16.8% of unskilled laborers [14]. According to the 4th Korean Working Conditions Survey, Baik [15] found that service workers worked an average of 51.24 hours per week, sales workers worked 53 hours, experts worked 41.67 hours, semi-professional workers worked 42.88 hours, office workers worked 42.55 hours, agricultural, forestry, and fisheries workers worked 39.71 hours, and unskilled laborers worked 39.96 hours. Generally, workers tend to work longer hours when there is an increased demand for work or labor, when their employment status is unstable, and when there is increased pressure to perform at work [7].
- Inflammation is recognized as a significant factor in the process of arteriosclerosis, which leads to cardiovascular disease. Numerous studies have demonstrated that high-sensitivity C-reactive protein (hs-CRP) serves as an inflammation biomarker, even in individuals without high blood pressure, diabetes, or hyperlipidemia. Elevated hs-CRP levels have been linked to an increased likelihood of cardiovascular disease [16−18]. Furthermore, hs-CRP levels can forecast the future risk of myocardial infarction, stroke, peripheral arterial disease, and sudden cardiac death, even in individuals without any existing diseases. These levels have also been reported to have a strong correlation with the development of metabolic syndrome and diabetes [19,20]. Since 1990, more sensitive hs-CRP measurements have been developed, and their use has been recommended as an index for risk assessment and prognosis estimation [21]. Notably, the hs-CRP assay is a more powerful predictor of cardiovascular disease than low-density lipoprotein cholesterol [22]. It is also a well-established risk marker for future cardiovascular disease [23−25] and mortality.
- An association between hs-CRP levels and occupational classification has been identified [26]. After adjusting for all covariates, white-collar workers exhibited significantly higher levels of hs-CRP (β=0.16; 95% confidence interval [CI], 0.02−0.30) than blue-collar workers. This pattern was particularly pronounced among professionals. However, the association was not significant for unemployed and pink-collar workers.
- The Korean government has recently been attempting to increase the weekly working hours to 52 hours [27]. The proposed extension of weekly working hours necessitates a thorough review in light of both national and international laws and institutions, as well as the correlation between a worker's age, occupation, health status, and overall health. However, there is a dearth of studies that have taken into account the hs-CRP levels of workers, considering their age, occupation, and working hours. Consequently, this study explored the variations in hs-CRP levels across different age groups, taking into account factors such as working hours, socioeconomic status, health behaviors and conditions, and occupational class. Furthermore, it aimed to identify the factors that influenced hs-CRP levels within each age group.
Introduction
- Study Participants
- Data were obtained from the Korea National Health and Nutrition Examination Survey in 2016−2018 (KNHANES Ⅶ). Briefly, the Korea Centers for Disease Control and Prevention (now known as the Korea Disease Control and Prevention Agency) has conducted the KNHANES since 1998, measuring population health profiles of noninstitutionalized Koreans aged 1 year or older through health examinations, nutrition surveys, and health interviews. The survey employed a stratified multistage cluster probability sampling design to draw a nationally representative sample of Koreans. As shown in Figure 1, from the initially targeted individuals in KNHANES Ⅶ, (n=24,269), we excluded participants younger than 19 years (n=2,513) or older than 65 years (n=1,991), those who did not report their current occupation (n=1,781), those with a missing hs-CRP level (n=71), and those with missing information on any other variables used in this analysis (n=41), resulting in a total sample of 4,674 men (Figure 1). Women were not included because it has been reported that the use of hormone replacement therapy affects hs-CRP levels, but the dataset in this study did not contain information on whether female subjects had received hormone replacement therapy [19].
- Variables
- Participants were grouped into 3 age categories: 19 to 34, 35 to 49, and 50 to 65 years. Education levels were divided into 2 groups: those with a high school diploma or less, and those with a college degree or higher. Marital status was categorized as unmarried, married, or separated/divorced/widowed. Household economic status was classified into 4 levels: high, mid-high, mid-low, and low. Smoking habits were categorized as current smoking, former smoking, and non-smoking. High-risk drinking was defined as consuming more than 7 drinks at a time for men, and drinking more than twice a week. Regular walking was defined as walking for more than 30 minutes, at least 5 days a week, in the previous week.
- The data contained items on conditions such as hypertension, dyslipidemia (hyperlipidemia), stroke, myocardial infarction, angina, rheumatoid arthritis, diabetes, cancer, elderly macular degeneration, and renal failure. These variables, as identified in a previous study [28], have a high correlation with hs-CRP. Consequently, if any of these diseases were present, participants were considered to have a history of cancer or cerebrocardiovascular disease. Participants were categorized based on their body mass index (BMI), with a threshold set at 25.0 kg/m2. The World Health Organization’s revised criteria for Asian-Pacific populations were used to classify BMI. The classifications were as follows: underweight (less than 18.5 kg/m2), normal weight (18.5 to less than 23.0 kg/m2), overweight (23.0 to less than 25.0 kg/m2), and obese (25.0 and above kg/m2).
- Low-density cholesterol was calculated using the formula by Friedewald et al. [29] and participants were classified into groups of ≤130 mg/dL and >130 mg/dL.
- Metabolic syndrome was defined by the presence of 3 cardiovascular risk markers. These include an elevated waist circumference for Asian-Pacific populations (≥90 cm for males), increased blood pressure (≥135/85 mmHg or the use of antihypertensive medication), high fasting plasma glucose levels (≥100 mg/L or the use of antihyperglycemic medication), high triglyceride levels (≥150 mg/dL), and low high-density lipoprotein cholesterol levels (<40 mg/dL for males). This definition was based on the Joint Scientific Statement by the American Heart Association, National Heart, Lung, and Blood Institute, and International Diabetes Federation [30].
- Perceived stress was classified as present if participants felt some or very much stress and as absent if they felt little or very little stress. Working hours were classified into an average of <40 hours per week, 40 to 49 hours, 50 to 53 hours, 54 to 61 hours, and >61 hours per week.
- Based on previous studies, occupational groups were classified into 3 classes: (1) white-collar workers (i.e., managers and professionals); (2) pink-collar workers (i.e., clerks, service, and salespeople); and (3) blue-collar workers (i.e., technicians, craftworkers, and device/machine operators/assemblers, skilled agricultural/fishery workers, and elementary-level laborers).
- The work pattern was segmented into day shifts and adjusted tasks, taking into account the hours and frequency of work. Adjusted tasks encompassed the evening shift (14:00−24:00), night shift (21:00−8:00 the following day), day and night shift, 24-hour shift, split shift (2 or more daily shifts), and irregular shift. Regarding sleep duration, the average sleep time was determined by summing the sleep hours during the week and the weekend. Weekly sleep hours were categorized into 42 hours (an average of 6 hours per day), 42 to 56 hours (an average of 6 to 8 hours per day), and more than 56 hours (an average of 8 hours or more per day).
- hs-CRP levels were classified into less than or equal to 3 mg/L and more than 3 mg/L. Plasma levels of hs-CRP 1 mg/L, 1 to 3 mg/L, and 3 mg/L were established as representing lower, average, or higher relative vascular risk when added to traditional risk factors [31]. This classification was based on the findings of a study that the risk of developing vascular disease was at its peak when hs-CRP levels reached or exceeded 3 mg/L in a clinical setting [17]. The hs-CRP level analysis in this study was conducted using a Hitachi 7600 biochemical analyzer (Hitachi).
- Statistical Analysis
- A statistical analysis was conducted to compare hs-CRP levels according to working hours, segmented by age groups (19 to 34, 35 to 49, and 50 to 65 years) among male workers in Korea. The analysis was conducted in accordance with the guidelines for using the National Health and Nutrition Survey, and it incorporated a complex sample analysis. Cross-tabulation tests and mean comparisons were utilized for the intergroup analyses. The results were presented using actual observations for frequency and composite weights for percentages. To examine the relationship between working hours and hs-CRP levels, a multiple logistic regression analysis was performed, applying composite weights. The analysis was conducted using SAS ver. 9.2 (SAS Institute Inc.). A p-value of less than 0.05 (2-sided) was considered statistically significant.
Materials and Methods
- Characteristics of Participants
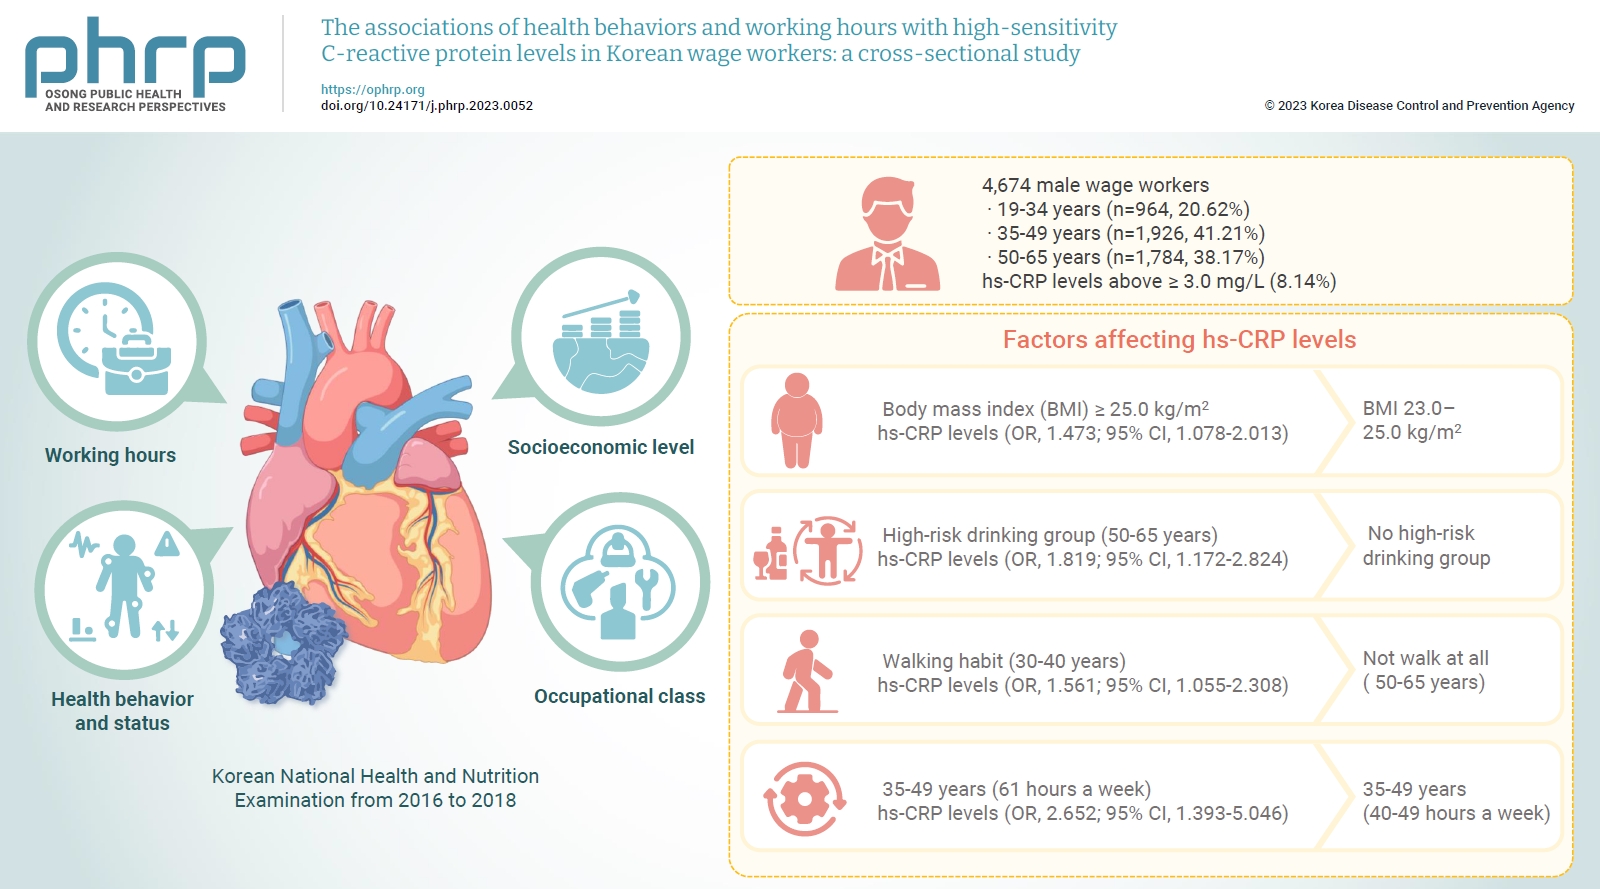
- Table 1 shows the characteristics of the study sample. A total of 20.62% (n=964) of participants were 19 to 34 years old, 41.21% (n=1,926) were 35 to 49 years old, and 38.17% (n=1,784) were 50 to 65 years old. The percentage of participants with hs-CRP levels above ≥3.0 mg/L was 8.14%. The distribution of participants across the working hours groups was as follows: 21.93%, 42.63%, 9.71%, 15.05%, and 10.69% for the ≤40 hours, 40 to 49 hours, 49 to 53 hours, 53 to 61 hours, and ≥61 hours groups, respectively. The percentages of white-, pink-, and blue-collar workers were 25.89%, 35.03%, and 39.07%, respectively.
- Distribution of hs-CRP Levels
- Table 2 presents the results of a cross-tabulation analysis of the distribution of hs-CRP levels based on the general characteristics and health status of participants across various age groups. Significant differences in hs-CRP levels were observed across all age groups in relation to BMI category (p<0.001), metabolic syndrome (p=0.004), and weekly working hours (p=0.012). More specifically, significant differences in the distribution of hs-CRP levels were found between BMI classes in both the 19 to 34 (p=0.005) and the 35 to 49 age groups (p=0.001). Furthermore, a significant difference was noted in the distribution of hs-CRP levels in relation to walking practices (min/week) within the 35 to 49 age group (p=0.046).
- Factors Affecting hs-CRP Levels
- Table 3 presents the results of multiple logistic regression analysis, which was conducted to identify factors influencing hs-CRP levels across different age groups. When compared to the group with a BMI of 23.0 to 25.0 kg/m2, the group with a BMI of ≥25.0 kg/m2 exhibited significantly higher hs-CRP levels (odds ratio [OR], 1.473; 95% CI, 1.078−2.013; p=0.0015). This trend was also observed in the 35 to 49 age group, where the BMI ≥25.0 kg/m2 group had significantly higher hs-CRP levels (OR, 1.717; 95% CI, 1.041−2.834; p=0.001). In comparison to the group with no high-risk drinking habits, the high-risk drinking group within the 50 to 65 years age bracket showed significantly higher hs-CRP levels (OR, 1.819; 95% CI, 1.172−2.824; p=0.008). Regarding walking habits, participants aged 35 to 40 years who walked between 0 and 149 minutes per week had significantly higher hs-CRP levels (OR, 1.561; 95% CI, 1.055−2.308; p=0.026) than those who did not walk at all in the 50 to 65 age group. Lastly, participants who worked more than 61 hours per week exhibited significantly higher hs-CRP levels (OR, 2.652; 95% CI, 1.393−5.046; p=0.007) than those who worked between 40 to 49 hours per week in the 35 to 49 age group. However, we were unable to identify any factors that influenced hs-CRP levels among other variables, such as general characteristics, occupational groups, health-related behaviors, and history of cancer or cerebrocardiovascular disease.
Results
- This study examined the distribution of hs-CRP level distributions in male workers according to working hours, socioeconomic level, health status and health behavior, and occupational class across the age groups of 19 to 34, 35 to 49, and 50 to 65 years, and identified factors affecting hs-CRP levels. Among the factors related to health status and behavior, obesity, metabolic syndrome, high-risk drinking, walking habits, and long working hours were shown to be significant factors influencing hs-CRP across all or specific age groups.
- It has been consistently shown that individuals with hs-CRP levels exceeding 3 mg/L are at very high risk for vascular issues. Elevated hs-CRP levels play a crucial role in the onset and progression of cardiovascular disease, underscoring the importance of studying their association with diabetes, obesity, reduced physical activity, and smoking habits [17]. Yamada et al. [32] found that factors such as sex, age, systolic index, and lipoprotein were linked to elevated CRP levels. In the present study, metabolic syndrome, encompassing obesity, and reduced walking activity were associated with high hs-CRP levels, which are also implicated in the onset and progression of cardiovascular disease.
- In a study examining the relationship between CRP levels and the risk of metabolic syndrome and diabetes in men, it was found that men with CRP levels exceeding 3 mg/L were several times more likely to develop metabolic syndrome or diabetes than those with CRP levels of 1.0 mg/L [20]. Numerous prior studies have found no correlation between age (ranging from 20 to 70 years) and CRP concentration [33,34], and age did not emerge as a significant factor in this study. However, in light of studies where a statistically significant increase in CRP was observed with age [32], it is clear that the factors influencing hs-CRP vary across different age groups. Therefore, it is crucial to consider each age group individually in future studies related to hs-CRP.
- High-risk drinking was identified as a significant factor influencing hs-CRP levels in the 50 to 65-year-old group, while walking activity significantly influenced hs-CRP levels in the 35 to 49-year-old age group. This aligns with a previous report on healthy, middle-aged individuals. In that report, daily alcohol intake demonstrated a clear U-shaped association with hs-CRP and fibrinogen values in males. A proportional odds model analysis revealed that moderate alcohol consumption (20 to 70 g versus no drinking per day: OR, 0.32; 95% CI, 0.14−0.74), and regular exercise (≥3 times/wk versus no exercise: OR, 0.52; 95% CI, 0.35−0.77) were inversely correlated with elevated hs-CRP values [35].
- In all participants, variations in the distribution of working hours across different age groups could potentially influence the significance of any observed differences. Therefore, working hours are not just a strong factor affecting hs-CRP levels, but it appears that the group aged 35 to 49 is more impacted by longer working hours. In Korea, individuals aged 35 to 49 have the highest rate of regular employment and the lowest rate of unemployment compared to other age groups, making it logical to focus on this demographic [36]. Consequently, when contemplating policies such as extending working hours, it is crucial to give sufficient consideration to workers’ health behaviors and conditions according to their age, and to assess the impact of increased working hours on their health.
- Exercise positively impacts serum CRP levels by causing a decrease in CRP. Studies have discovered that individuals with elevated CRP levels or dyslipidemia prior to starting an exercise regimen experienced more significant reductions in CRP [37]. Past interventional studies have demonstrated that interventions such as quitting smoking, engaging in regular exercise, and reducing weight can lower CRP levels among individuals at high risk of developing noncommunicable diseases. These diseases include diabetes mellitus, cerebrovascular events, and ischemic cardiovascular disease [38,39].
- A strength of this study lies in its use of the KNHANES, a nationwide survey that investigates large groups. This survey thoroughly examines individuals’ socioeconomic statuses and locations, while also providing a comprehensive record of their lifestyles and health conditions. Furthermore, this study holds significant value as it represents the first attempt in the Republic of Korea to establish a relationship between hs-CRP levels, age, and working hours using such extensive data.
- Nevertheless, this study does have certain limitations. First, our analysis was confined to working hours, without taking into account the intensity of labor. This is a limitation because it fails to consider that labor intensity often decreases with age, or that the proficiency of labor cannot be factored in. Second, our analysis of hs-CRP levels was restricted to a dichotomization between ≤3 mg/L and >3 mg/L, which prevented us from obtaining more detailed results. Lastly, as this study only targeted male workers, we recommend broadening the scope to include female workers in future research for a comparative study according to gender.
Discussion
- We identified factors affecting hs-CRP levels by age group among Korean wage workers using the KNHANES from 2016 to 2018.
- There were significant differences in hs-CRP levels according to BMI, metabolic syndrome, and weekly working hours in all participants. Additionally, the amount of time spent walking each week significantly impacted the hs-CRP level, particularly between those who walked 0 to 149 minutes per week and those who walked 150 minutes or more per week in the 35 to 49 age group. According to the results of multiple logistic regression analysis, BMI influenced hs-CRP levels in all participants. In the 35 to 49 age group, those who walked less frequently, had a higher BMI, and worked longer hours each week showed significantly higher hs-CRP levels. Furthermore, in the 50 to 65 age group, those who engaged in high-risk drinking and had metabolic syndrome also showed significantly higher hs-CRP levels.
- The Korean government intends to modify the legally mandated weekly working hours for employees, aiming to increase labor market flexibility. This study’s findings indicate a correlation between obesity, metabolic syndrome, and weekly working hours with hs-CRP, an inflammation biomarker. Furthermore, the factors significantly impacting hs-CRP levels varied across different age groups. Consequently, any plans to adjust working hours should be thoroughly deliberated, taking into account health behaviors such as alcohol consumption and physical activity, as well as health conditions such as metabolic syndrome and obesity, which differ according to age.
Conclusion
- • Participants with a body mass index (BMI) ≥25.0 kg/m2 showed significantly higher high-sensitivity C-reactive protein (hs-CRP) levels than those with a BMI of 23.0 to 25.0 kg/m2.
- • Workers with high-risk drinking and metabolic syndrome showed significantly higher hs-CRP levels in the 50 to 65 years group.
- • Obesity, walking 0 to 149 min/wk, and working ≥61 hours a week were associated with significantly higher hs-CRP levels in the 35 to 49 years group.
HIGHLIGHTS
-
Ethics Approval
Written informed consent was obtained for publication of this study and accompanying images.
-
Conflicts of Interest
The authors have no conflicts of interest to declare.
-
Funding
None.
-
Availability of Data
All data generated or analyzed during this study are included in this published article. For other data, these may be requested through the corresponding author.
-
Authors’ Contributions
Conceptualization: all authors; Data curation: CWS, THY; Formal analysis: CWS; Investigation: CWS, THY; Methodology: CWS, THY; Project administration: CWS; Resources: CWS; Validation: CWS, Visualization: CWS, Writing–original draft: all authors; Writing–review & editing: all authors. All authors read and approved the final manuscript.
Article information

LDL cholesterol was estimated using the measured values of total cholesterol, HDL cholesterol, and triglycerides. LDL cholesterol (mg/dL)=total cholesterol (mg/dL)−HDL cholesterol (mg/dL)−triglycerides (mg/dL)/5. Reference range: <130 mg/dL (desirable); 131–160 mg/dL (borderline high); >160 mg/dL (high).
BMI, body mass index; LDL, low-density lipoprotein; hs-CRP, high-sensitivity C-reactive protein; HDL, high-density lipoprotein.
LDL cholesterol was estimated using the measured values of total cholesterol, HDL cholesterol, and triglycerides. LDL cholesterol (mg/dL)=total cholesterol (mg/dL)−HDL cholesterol (mg/dL)−triglycerides (mg/dL)/5. Reference range: <130 mg/dL (desirable); 131–160 mg/dL (borderline high); >160 mg/dL (high).
hs-CRP, high-sensitivity C-reactive protein; BMI, body mass index; LDL, low-density lipoprotein; HDL, high-density lipoprotein.
LDL cholesterol was estimated using the measured values of total cholesterol, HDL cholesterol, and triglycerides. LDL cholesterol (mg/dL)=total cholesterol (mg/dL)−HDL cholesterol (mg/dL)−triglycerides (mg/dL)/5. Reference range: <130 mg/dL (desirable); 131–160 mg/dL (borderline high); >160 mg/dL (high).
hs-CRP, high-sensitivity C-reactive protein; OR, odds ratio; CI, confidence interval; ref., reference; BMI, body mass index; LDL, low-density lipoprotein; HDL, high-density lipoprotein.
- 1. Lee S, McCann D, Messenger JC. Working time around the world: trends in working hours, laws and policies in a global comparative perspective [Internet]. International Labour Office; 2007 [cited 2023 Jul 1]. Available from: https://www.ilo.org/wcmsp5/groups/public/---dgreports/---dcomm/---publ/documents/publication/wcms_104895.pdf.
- 2. Occupational Safety and Health Research Institute (OSHRI). 6th Korean Working Conditions Survey (2020-2021) [Internet]. OSHRI; 2021 [cited 2023 Jul 1]. Available from: https://oshri.kosha.or.kr/oshri/researchField/downWorkingEnvironmentSurvey.do. Korean.
- 3. Caruso CC, Bushnell T, Eggerth D, et al. Long working hours, safety, and health: toward a National Research Agenda. Am J Ind Med 2006;49:930−42.ArticlePubMed
- 4. Dembe AE, Erickson JB, Delbos RG, et al. The impact of overtime and long work hours on occupational injuries and illnesses: new evidence from the United States. Occup Environ Med 2005;62:588−97.ArticlePubMedPMC
- 5. Amagasa T, Nakayama T. Relationship between long working hours and depression: a 3-year longitudinal study of clerical workers. J Occup Environ Med 2013;55:863−72.PubMed
- 6. Kivimaki M, Jokela M, Nyberg ST, et al. Long working hours and risk of coronary heart disease and stroke: a systematic review and meta-analysis of published and unpublished data for 603,838 individuals. Lancet 2015;386:1739−46.ArticlePubMed
- 7. Sparks K, Cooper C, Fried Y, et al. The effects of hours of work on health: a meta-analytic review. J Occup Organ Psychol 1997;70:391−408.Article
- 8. Cette G, Chang S, Konte M. The decreasing returns on working time: an empirical analysis on panel country data. Appl Econ Lett 2011;18:1677−82.Article
- 9. Leontaridi RM, Ward ME. Work-related stress, quitting intentions and absenteeism [Internet]. IZA Discussion Paper No 493. Institute for the Study of Labor; 2002 [cited 2023 Jul 1]. Available from: https://docs.iza.org/dp493.pdf.
- 10. Spurgeon A, Harrington JM, Cooper CL. Health and safety problems associated with long working hours: a review of the current position. Occup Environ Med 1997;54:367−75.ArticlePubMedPMC
- 11. Van der Hulst M, Geurts S. Associations between overtime and psychological health in high and low reward jobs. Work Stress 2001;15:227−40.Article
- 12. Song JH, Kim HR, Lee DW, et al. Association between long working hours and liver enzymes: evidence from the Korea National Health and Nutrition Examination Survey, 2007-2017. Ann Occup Environ Med 2022;34:e9.ArticlePubMedPMCPDF
- 13. Lee YK. Analysis of the relationship between working hour mismatch and worker’s health. Health Soc Welf Rev 2015;35:135−65. Korean.Article
- 14. Korean Statistical Information Service (KOSIS). 6th Korean working conditions survey. KOSIS; 2023 [cited 2023 Jul 6]. Available from: https://kosis.kr/statHtml/statHtml.do?orgId=380&tblId=DT_380002_C002&lang_mode=ko&vw_cd=MT_ZTITLE&list_id=380_38002_012&conn_path=I4. Korean.
- 15. Baik JW. Analysis of industrial accidents data with survival model. Ind Promot Res 2020;5:1−11.
- 16. Ridker PM. C-reactive protein and the prediction of cardiovascular events among those at intermediate risk: moving an inflammatory hypothesis toward consensus. J Am Coll Cardiol 2007;49:2129−38.PubMed
- 17. Torres JL, Ridker PM. Clinical use of high sensitivity C-reactive protein for the prediction of adverse cardiovascular events. Curr Opin Cardiol 2003;18:471−8.ArticlePubMed
- 18. Yusuf S, Reddy S, Ounpuu S, et al. Global burden of cardiovascular diseases: part I: general considerations, the epidemiologic transition, risk factors, and impact of urbanization. Circulation 2001;104:2746−53.ArticlePubMed
- 19. Pradhan AD, Manson JE, Rifai N, et al. C-reactive protein, interleukin 6, and risk of developing type 2 diabetes mellitus. JAMA 2001;286:327−34.ArticlePubMed
- 20. Laaksonen DE, Niskanen L, Nyyssonen K, et al. C-reactive protein and the development of the metabolic syndrome and diabetes in middle-aged men. Diabetologia 2004;47:1403−10.ArticlePubMedPDF
- 21. Myers GL, Rifai N, Tracy RP, et al. CDC/AHA workshop on markers of inflammation and cardiovascular disease: application to clinical and public health practice: report from the laboratory science discussion group. Circulation 2004;110:e545−9.PubMed
- 22. Ridker PM. High-sensitivity C-reactive protein and cardiovascular risk: rationale for screening and primary prevention. Am J Cardiol 2003;92(4B):17K−22K.Article
- 23. Yousuf O, Mohanty BD, Martin SS, et al. High-sensitivity C-reactive protein and cardiovascular disease: a resolute belief or an elusive link? J Am Coll Cardiol 2013;62:397−408.PubMed
- 24. Pearson TA, Mensah GA, Alexander RW, et al. Markers of inflammation and cardiovascular disease: application to clinical and public health practice: a statement for healthcare professionals from the Centers for Disease Control and Prevention and the American Heart Association. Circulation 2003;107:499−511.ArticlePubMed
- 25. Emerging Risk Factors Collaboration; Kaptoge S, Di Angelantonio E, et al. C-reactive protein concentration and risk of coronary heart disease, stroke, and mortality: an individual participant meta-analysis. Lancet 2010;375:132−40.ArticlePubMedPMC
- 26. Kim Y, Zaitsu M, Tsuno K, et al. Occupational differences in C-reactive protein among working-age adults in South Korea. J Occup Environ Med 2020;62:194−201.ArticlePubMed
- 27. Ministry of Employment and Labor (MOEL). Promote labor reform without a hitch, such as reorganization of working hours. MOEL; 2023 [cited 2023 Feb 1]. Available from: https://www.korea.kr/news/actuallyView.do?newsId=148910128. Korean.
- 28. Banait T, Wanjari A, Danade V, et al. Role of high-sensitivity C-reactive protein (Hs-CRP) in non-communicable diseases: a review. Cureus 2022;14:e30225.ArticlePubMedPMC
- 29. Friedewald WT, Levy RI, Fredrickson DS. Estimation of the concentration of low-density lipoprotein cholesterol in plasma, without use of the preparative ultracentrifuge. Clin Chem 1972;18:499−502.ArticlePubMedPDF
- 30. Lim S, Shin H, Song JH, et al. Increasing prevalence of metabolic syndrome in Korea: the Korean National Health and Nutrition Examination Survey for 1998-2007. Diabetes Care 2011;34:1323−8.PubMedPMC
- 31. Ridker PM, Rifai N, Rose L, et al. Comparison of C-reactive protein and low-density lipoprotein cholesterol levels in the prediction of first cardiovascular events. N Engl J Med 2002;347:1557−65.ArticlePubMed
- 32. Yamada S, Gotoh T, Nakashima Y, et al. Distribution of serum C-reactive protein and its association with atherosclerotic risk factors in a Japanese population : Jichi Medical School Cohort Study. Am J Epidemiol 2001;153:1183−90.ArticlePubMed
- 33. Ridker PM, Rifai N, Pfeffer MA, et al. Inflammation, pravastatin, and the risk of coronary events after myocardial infarction in patients with average cholesterol levels. Cholesterol and Recurrent Events (CARE) Investigators. Circulation 1998;98:839−44.ArticlePubMed
- 34. Clapp BR, Hirschfield GM, Storry C, et al. Inflammation and endothelial function: direct vascular effects of human C-reactive protein on nitric oxide bioavailability. Circulation 2005;111:1530−6.ArticlePubMed
- 35. Wang JJ, Tung TH, Yin WH, et al. Effects of moderate alcohol consumption on inflammatory biomarkers. Acta Cardiol 2008;63:65−72.ArticlePubMed
- 36. Korea Institute of Public Administration (KIPA). Korea social integration survey 2017. KIPA; 2017 [cited 2023 Jul 1]. Available from: http://hdl.handle.net/20.500.12236/23582. Korean.
- 37. Hammett CJ, Prapavessis H, Baldi JC, et al. Effects of exercise training on 5 inflammatory markers associated with cardiovascular risk. Am Heart J 2006;151:367. Article
- 38. van ’t Klooster CC, van der Graaf Y, Ridker PM, et al. The relation between healthy lifestyle changes and decrease in systemic inflammation in patients with stable cardiovascular disease. Atherosclerosis 2020;301:37−43.ArticlePubMed
- 39. Booth JN 3rd, Levitan EB, Brown TM, et al. Effect of sustaining lifestyle modifications (nonsmoking, weight reduction, physical activity, and Mediterranean diet) after healing of myocardial infarction, percutaneous intervention, or coronary bypass (from the Reasons for Geographic and Racial Differences in Stroke Study). Am J Cardiol 2014;113:1933−40.ArticlePubMedPMC
 Cite
Cite

