Articles
- Page Path
- HOME > Osong Public Health Res Perspect > Volume 14(2); 2023 > Article
-
Original Article
Vaccine hesitancy in patients with COVID-19 who have back pain -
Askeri Türken1
 , Haşim Çapar2
 -
Osong Public Health and Research Perspectives 2023;14(2):100-109.
DOI: https://doi.org/10.24171/j.phrp.2023.0003
Published online: March 24, 2023
1Department of Physical Medicine and Rehabilitation, Gazi Yaşargil Education and Research Hospital, University of Health Sciences, Diyarbakır, Turkey
2Department of Health Management, Faculty of Health Sciences, Istanbul Sabahattin Zaim University, Istanbul, Turkey
- Corresponding author: Askeri Türken Department of Physical Medicine and Rehabilitation, Gazi Yaşargil Education and Research Hospital, University of Health Sciences, Elazığ Yolu 10. Km Üçkuyular Mevkii 21070 Kayapınar/Diyarbakır, Turkey E-mail: askeriturken@hotmail.com
© 2023 Korea Disease Control and Prevention Agency.
This is an open access article under the CC BY-NC-ND license (http://creativecommons.org/licenses/by-nc-nd/4.0/).
- 1,771 Views
- 70 Download
- 1 Crossref
Abstract
-
Objectives
- Musculoskeletal pain is among the most common symptoms in patients diagnosed with coronavirus disease 2019 (COVID-19), and it has placed a significant burden on health worldwide during the pandemic. This study explored vaccine hesitancy and associated factors in patients with positive COVID-19 polymerase chain reaction test results who were hospitalized and had back pain.
-
Methods
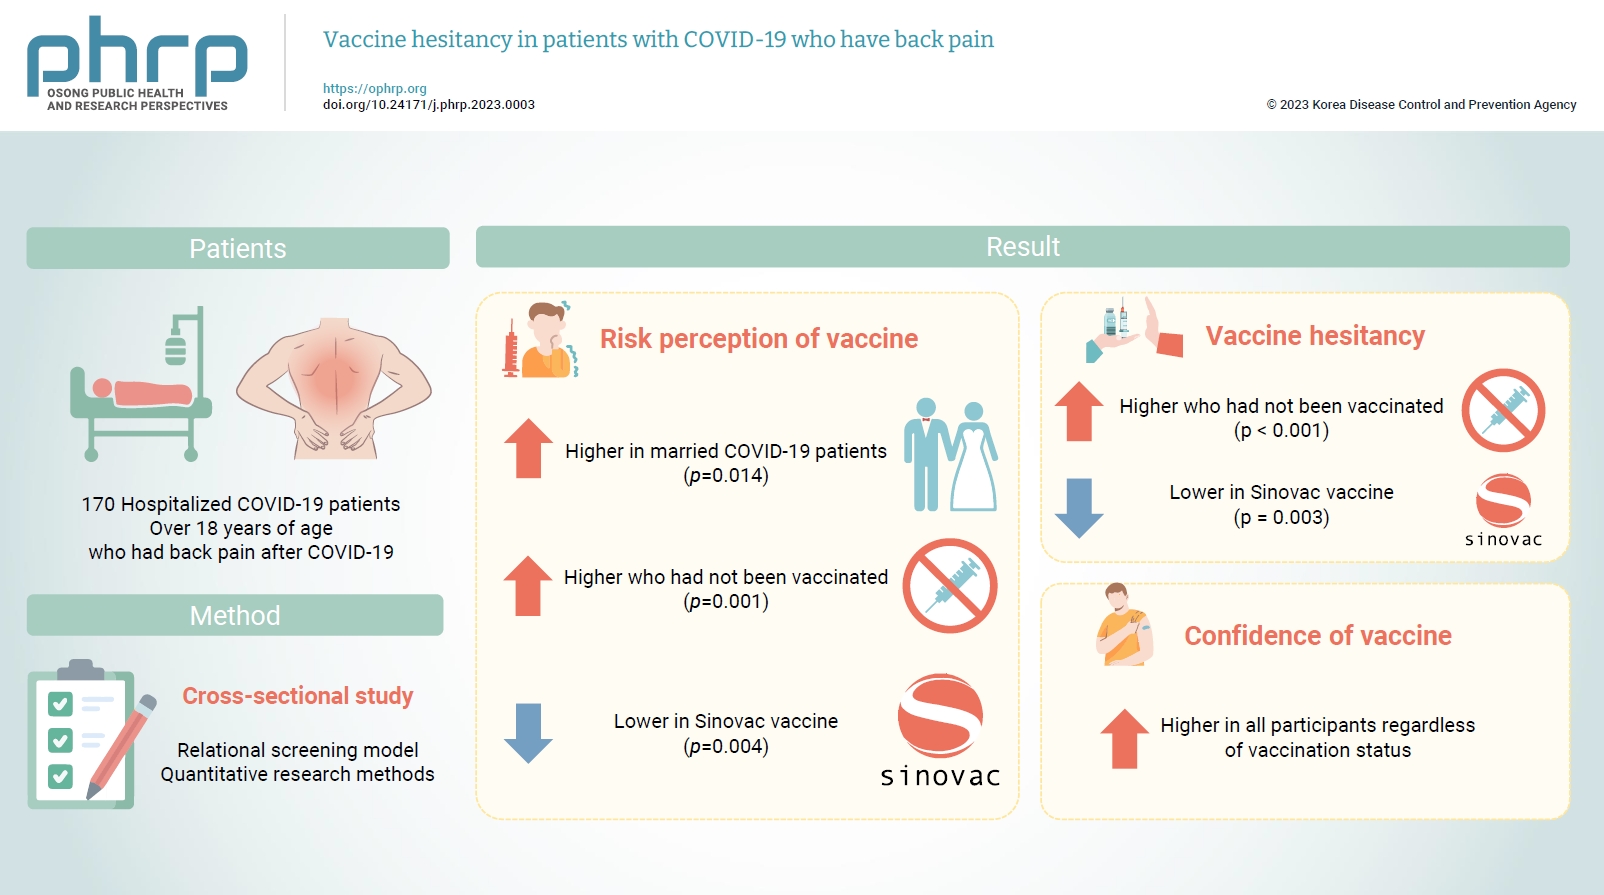
- A cross-sectional study was conducted among 170 hospitalized COVID-19 patients over 18 years of age. Data were analyzed using descriptive statistics with IBM SPSS ver. 25.0.
-
Results
- COVID-19 patients who were married considered COVID-19 vaccinations riskier than unmarried COVID-19 patients. Patients who had not been vaccinated expressed higher levels of distrust towards COVID-19 vaccines than patients who had been vaccinated. Participants had relatively little hesitation toward the Sinovac vaccine. High vaccine confidence was found in all participants regardless of vaccination status. Those who had not received the COVID-19 vaccine reported higher risk perceptions than those who had received at least 1 dose of any COVID-19 vaccine.
-
Conclusion
- Measurements of the hesitancy of vaccinated and non-vaccinated patients or members of society towards vaccines can be an important parameter for health authorities to find solutions.
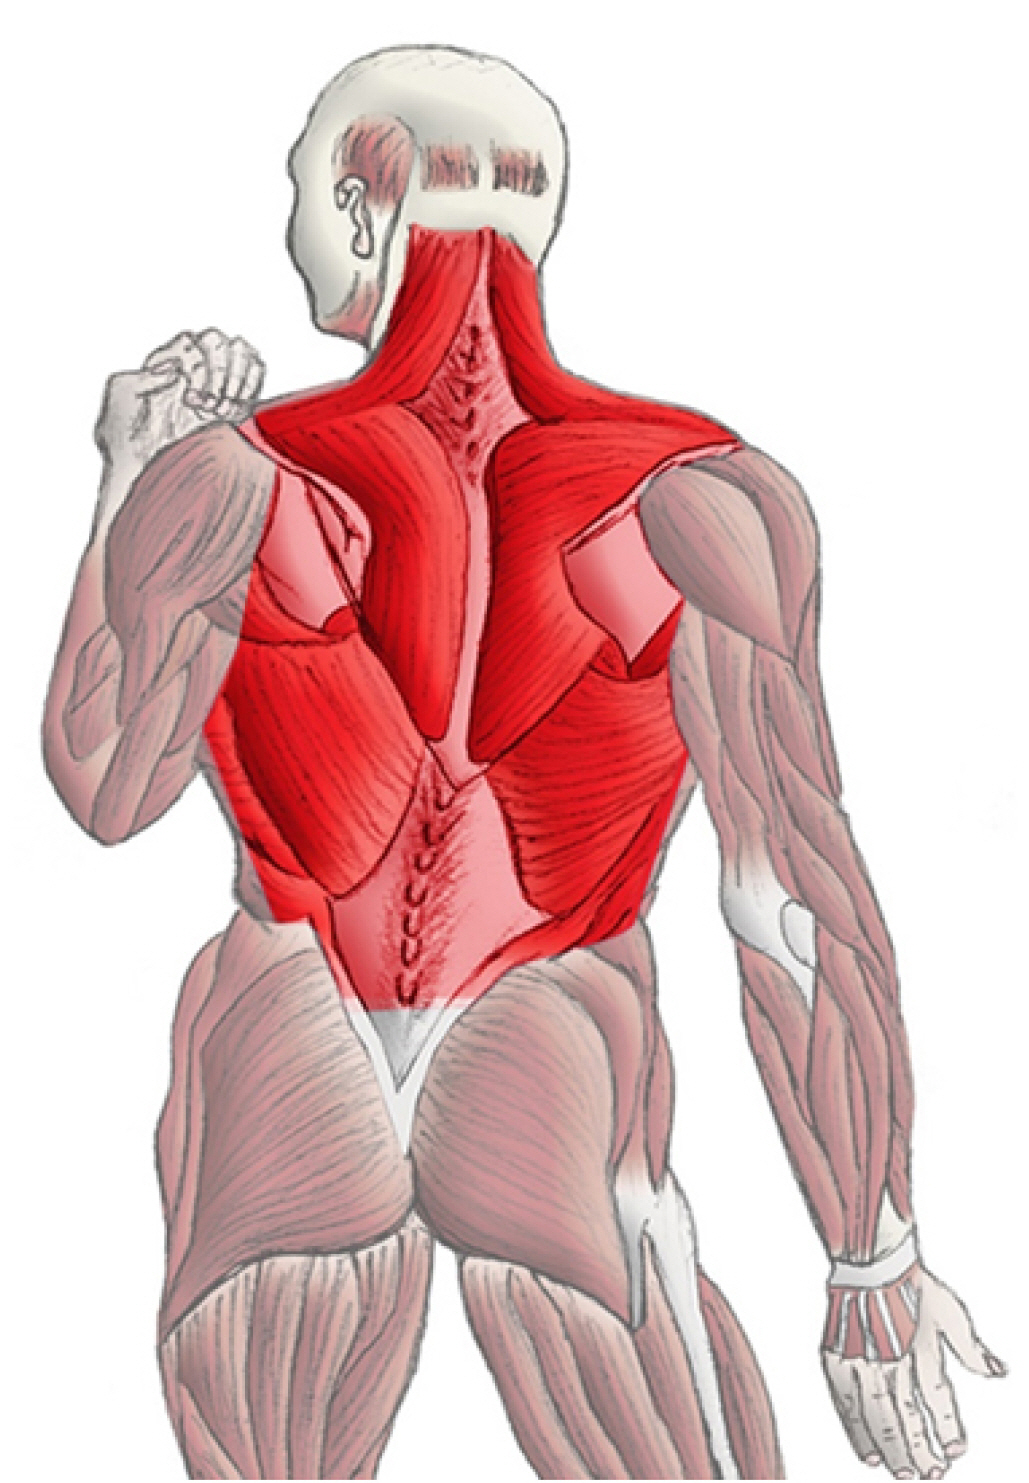
- As an anatomical area, the back extends from the top of the neck to the tailbone (Figure 1). Back pain refers to pain in the tissues in this area caused by mechanical or non-mechanical causes such as infection, inflammation, and trauma [1,2]. It has been observed that patients with back pain have breathing problems and avoid some behaviors due to the pain they experience in coughing and physical movements [3]. The fact that back pain is one of the long-term effects of coronavirus disease 2019 (COVID-19) has made it even more important to research this issue [4].
- Tissue damage has been reported to occur with the increased release of pro-inflammatory stimuli due to COVID-19 infection [4]. Accordingly, survivors of COVID-19 have shown some health problems such as widespread pain, weakness in the muscles, and increased sensitivity in the joints, which has prompted predictions that COVID-19 alone causes back pain and may place patients at risk for permanent pain and disability in the future [5]. The symptoms of infection have received substantial attention from researchers since the early days of COVID-19, and findings from recent studies have shown that musculoskeletal symptoms (of which back pain was the most common) were more common than respiratory symptoms [6,7]. Almost half (46.6%) of patients who contracted COVID-19 complained of pain, and 92.6% of patients diagnosed with COVID-19 who experienced musculoskeletal pain stated that they did not have pain before getting COVID-19. Pain in the thoracic region was experienced by 33.1% of these patients, and pain in the lumbar region by 25% [8].
- Vaccination is a drug-free treatment that provides immunity, but the number of people who hesitate or refuse to be vaccinated has increased in recent years. This increase has attracted the attention of many institutions, including the World Health Organization (WHO). In 2019, the WHO recognized vaccine hesitancy and refusal as one of the top 10 threats to the world's health. According to the WHO, if vaccine hesitancy and refusal continue to spread among people at this rate, it will be a severe problem worldwide in the event of future pandemics such as COVID-19 [9].
- One of the symptoms in patients with a positive COVID-19 polymerase chain reaction (PCR) test is back pain at various levels of severity [10]. In particular, back pain is one of the most significant symptoms of the spreading Omicron variant of COVID-19 [11]. However, back pain can be caused by many etiologies [12], making it essential to differentiate back pain caused by COVID-19 from back pain caused by other causes and not to confuse them. Thus, studies have attributed back pain to COVID-19 in patients who have never had back pain before and whose PCR test is positive [13]. In addition, it has been observed that people with chronic back pain experience more back pain when infected with COVID-19 [6]. Many studies have shown that back pain is often a long-term effect of COVID-19 that does not resolve quickly [5,6,8,10–12,14].
- The long-term persistence of COVID-19-induced back pain is worth investigating both due to the resultant disease burden and because of treatment costs. In particular, clinicians and hospital administrators are trying to eliminate back pain caused by COVID-19, making plans and developing treatment protocols for this purpose. However, these efforts are very costly. In addition, the quality of life of individuals with back pain caused by COVID-19 is diminished [15]. Therefore, vaccination, which is a much cheaper and more protective method [16], substantially increases the likelihood that infected individuals will have mild COVID-19 [17] and reduces treatment costs [18]. Health systems are currently experiencing problems in terms of financing resources, and waiting times for treatment have increased in many countries, especially due to the inadequacy of unaffordable health systems. Since back pain caused by COVID-19 creates a non-communicable disease burden, it may increase waiting times and accelerate the consumption of scarce financial resources. These reasons constitute the rationale for conducting this study only among patients with COVID-19 who experience back pain, rather than among patients with other conditions or patients with COVID-19 who do not experience back pain.
- The fact that one of the symptoms of COVID-19, especially the Omicron variant, is back pain [19,20] may increase individuals’ risk and necessitate long-term treatment.. Therefore, vaccination prior to contracting COVID-19 is important, since vaccines provide protection [21], alleviate the symptoms of COVID-19 [22,23], and reduce severe back pain [17]. Since vaccination is cheaper than treatment, it provides a less burdensome way of overcoming long-term COVID-19-induced back pain that would avoid the hospitalization of patients with long-term COVID-19-induced back pain, thereby ensuring that access to the hospital can be provided to those who really need it. These considerations made it necessary to conduct this study among COVID-19 patients with back pain. It is thought that this study will provide meaningful evidence to both clinicians and society.
- The quality of life of those who experience back pain due to COVID-19 is diminished [15], and serious costs would be incurred to restore their quality of life. The motivation of this study was to draw attention to back pain as a symptom of COVID-19 in the context of vaccination, which is known to be very simple and cost-effective [16,18,22,23]. Specifically, this study investigated vaccine hesitancy and associated factors in patients with back pain who had PCR-confirmed COVID-19 tested and were hospitalized in a COVID-19 ward. It is hoped that this study will help resolve the problem of COVID-19 back pain without costly treatments, thereby alleviating the burden of disease.
Introduction
- Study Setting and Timing
- This study was conducted in Diyarbakır, which is the largest city in southeastern Turkey. Patients hospitalized in the adult COVID-19 ward of Gazi Yaşargil Education and Research Hospital, one of the largest hospitals in Diyarbakır, constituted the study population. The study was conducted in this hospital because one of the researchers was a medical doctor treating these patients. This study group exclusively comprised Turkish patients with positive COVID-19 PCR test results performed by the hospital’s testing unit. The study was conducted as a face-to-face survey between September 3, 2021 and November 10, 2021, during the intense spread of the COVID-19.
- Study Design
- This descriptive cross-sectional study was based on the relational screening model, a causal comparison subtype of quantitative research methods. The physician-researcher administered the relevant questionnaire to patients who had a positive PCR test in the COVID-19 unit where the study was conducted, were hospitalized, and complained of back pain. The study complied with the Strengthening the Reporting of Observational Studies in Epidemiology (STROBE) statement’s guidelines for reporting cross-sectional studies (Table S1).
- Participants
- The study participants were men and women over the age of 18 who were admitted to an adult ward for COVID-19 treatment and experienced back pain for the first time. Pediatric patients were not specifically excluded; instead, the inclusion of only adult patients reflects the inherent scope of practice of the adult COVID-19 ward. The participants were conscious and were admitted only to alleviate or eliminate symptoms such as back pain. The socio-demographic structure of the participants was similar to the socio-demographic structure of the people of Diyarbakır.
- Sample Size and Sampling
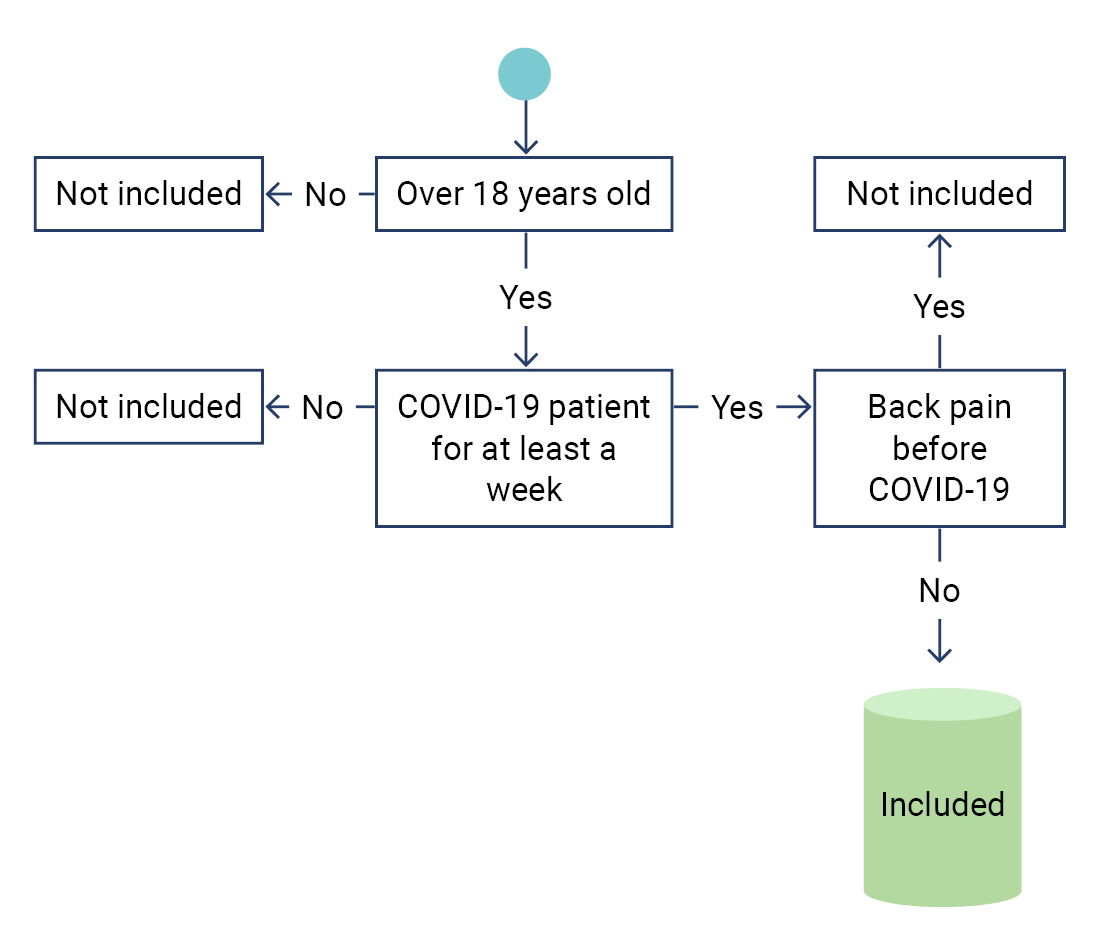
- According to the PCR test results performed by the hospital team, 700 people over the age of 18 were diagnosed with COVID-19 during the 2-month study. The study population consisted of 305 patients hospitalized in the COVID-19 ward who met the criteria for inclusion (Figure 2). The sample size from this population was calculated as 170 with a confidence interval of 95% and a margin of error of 5%. In order to avoid selection bias, every patient who met the selection criteria, was conscious and volunteered for the study was included in the study. Sample size calculation formula: If the number of individuals who make up the population of interest is known, the sample size can be calculated as follows [24]:
- n=(N·t2·p·q)/(d2·(N-1)+t2·p·q),
- where N indicates the number of individuals in the study population, n is the number of individuals to be sampled, p is the frequency of occurrence (probability of occurrence) of the event under study, q is frequency of non-occurrence of the event under investigation (probability of non-occurrence), t is a theoretical value for a certain degree of freedom and the level of error determined, and d expresses the desired deviation (±) according to the frequency of occurrence of the event.
- Figure 1 presents specific information about the anatomical area of back pain, and Figure 2 shows a sample selection diagram to facilitate a clearer understanding of the patient population within the study's scope.
- Data Collection Tools
- Data were collected using a demographic information form (prepared by the authors) and the Vaccination Hesitancy in Pandemics Scale. The scale used was developed by Larson et al. [25] and modified for COVID-19 vaccines by Çapar and Çınar [26].
- The socio-demographic information form consisted of variables such as sex, age, marital status, education status, economic status, previous COVID-19 infection status, whether participants had lost a relative due to COVID-19, vaccination status against COVID-19 (including which vaccine and how many doses), how many days had passed since the last dose of vaccine was administered, the presence of chronic illness, and the severity of back pain.
- The vaccine hesitancy scale in pandemics is a 5-point Likert-type instrument with 2 sub-dimension and 10 items, including 8 items about lack of confidence and 2 items about risk. The minimum score is 10, and the maximum score is 50. High scores indicate high vaccine hesitancy, while low scores indicate low vaccine hesitancy. The minimum score obtained from the lack of confidence sub-dimension is 8, and the maximum score is 40. The minimum score obtained from the risk sub-dimension is 2, and the maximum score is 10.
- Data Analysis
- Frequency and percentage values obtained from descriptive statistics were used to reveal and explain the socio-demographic characteristics of patients hospitalized in the COVID-19 ward. Frequency and percentage values were used for categorical variables related to vaccine hesitation, while mean and standard deviation values were used for continuous variables. Skewness and kurtosis values were also reported to evaluate the normality assumption for continuous variables. The independent-sample t-test for 2 groups and 1-way analysis of variance for more than 2 groups were used to determine the significance of differences in vaccine hesitancy scale in pandemics scores according to demographic data. In addition, the Pearson correlation coefficient (r) was used to evaluate the relationships between continuous variables [27]. A p-value <0.05 was considered to indicate statistical significance, and the results were analyzed at a 95% confidence level. All analyses were performed with IBM SPSS ver. 25.0 (IBM Corp.) [28].
- Ethical Consideration
- Ethical approval was received from the Diyarbakır Gazi Yaşargil Education and Research Hospital in Turkey (IRB-863-2021). The necessary permissions were obtained from the institution where the study was conducted. All patients included in the study voluntarily participated in the study, and oral consent was obtained from the participants. No ethical violations were committed during the study, and all processes were carried out while observing ethical rules. The necessary permits were also obtained from the Scientific Research Platform of the Ministry of Health for the study (permission code: 2021-09-03T10_03_52).
Materials and Methods
- Assumptions of Normality and Homogeneity of Variance
- The skewness and kurtosis values of continuous variables were examined to evaluate the assumption of normality. The skewness and kurtosis values were between –1.5 and +1.5; therefore, the continuous variables (vaccine dose, vaccine hesitancy scale total score, lack of confidence, risk, age, and the number of days since the last vaccination) were assumed to have a normal distribution and parametric tests could be used accordingly. The homogeneity of variance was also confirmed (p>0.05) [29].
- When the socio-demographic structure of the patients hospitalized in the COVID-19 ward was examined, it was seen that the distribution of men and women was almost even. The majority of the patients were in the middle and upper-income groups, while a minimal number of them were in the low-income group. However, 30.6% of the patients (n=52) were illiterate, and 41.2% (n=70) were primary school graduates. In addition, most of the patients were married, and 38.8% (n=66) had at least 1 chronic disease. About a third of those included in the study had lost at least 1 relative due to COVID-19, and very few of them had been vaccinated against COVID-19. The most common vaccine that patients had received was Sinovac (11.2%; n=19), followed by BioNTech (14.1%; n=24) and Sinovac+BioNTech (4.7%; n=8) (Table 1).
- The mean number of COVID-19 vaccine doses was 1.38±0.680, and the average time between the last COVID-19 vaccine and contracting COVID-19 was 21.17±47,601 days. The average total vaccine hesitancy scale in pandemics score was 27.88±6.044 (lack of confidence sub-dimension, 21.12±5.392; risk sub-dimension, 6.75±1.742) (Table 2).
- A high level of positive correlation was found between the total score of the vaccine hesitancy scale and its sub-dimensions. Meanwhile, the vaccine dose showed moderate negative correlations with the total vaccine hesitancy score and its sub-dimensions. The number of days since the last dose showed weak negative correlations with the total score of patients’ vaccine hesitancy and the score for the risk sub-dimension. The number of days since the last vaccine dose showed a strong positive correlation with the vaccine dose (Table 3).
- Sex, income status, education status, chronic illness status, previous COVID-19 transmission status, loss of a relative due to COVID-19, and back pain severity did not show significant relationships with COVID-19 vaccine hesitancy (p>0.05).
- Married COVID-19 patients considered COVID-19 vaccines riskier than unmarried COVID-19 patients. This difference was statistically significant (p<0.05). Patients who were not vaccinated had significantly higher levels of distrust of COVID-19 vaccines, higher scores for finding vaccines risky, and higher levels of vaccine hesitancy compared to those vaccinated (p<0.05) (Table 4).
- Differences were found between those who were not vaccinated and those who received any vaccine (p<0.05). Post hoc test was performed to reveal between which groups this difference was. The variance of the groups was homogeneous, but the sample numbers were not equal, so the Scheffé post hoc test [30] was used. Those who were not vaccinated and those vaccinated with Sinovac from any brand of vaccine differed significantly in total vaccine hesitation score and risk sub-dimension score. In other words, those vaccinated with Sinovac had a much lower vaccination hesitancy than those who were not vaccinated and those who had been vaccinated from other brands (Supplementary Material 1). The unvaccinated and vaccinated groups of any brand all had high vaccine confidence. There was no difference between the groups in terms of this level of confidence (p>0.05). The risk sub-dimension of the vaccine hesitancy scale in pandemics showed a significant difference only between those who were not vaccinated and those who received the Sinovac vaccine (p<0.05), whereas the risk sub-dimension did not show a statistically significant difference according to the type of vaccine. Therefore, the high-risk perception of those who were not vaccinated showed a statistically significant difference from the low-risk perception of those who received the Sinovac vaccine (p<0.05) (Table 4).
Results
- Since this study was conducted in a population located in a city in the southeastern region of Turkey, its most significant limitation is that it cannot represent other regions of Turkey or other countries. Therefore, the results of this study should be evaluated within the framework of its population to avoid possible bias. Further studies, potentially using other methods to investigate different effects and relationships, should be conducted to supplement these findings.
- Many other studies have investigated pain, pain management, pain perception, and COVID-19 vaccination [31]. However, the fact that this study was conducted specifically among COVID-19-positive patients with back pain in a COVID-19 ward constitutes the main novelty of this study.
- The possibility of chronic back pain after COVID-19 has emerged as a major social issue. For instance, a study showed that musculoskeletal complaints were seen 27.1% more frequently in patients with diabetes and obesity after the COVID-19 pandemic than before. It has been observed that individuals with chronic diseases have worse COVID-19 prognoses [32,33]. As an explanation, it is highly likely that inflammatory changes develop in the organs of those who have had COVID-19. Meanwhile, several studies have documented that back pain increased after COVID-19 and turned into a long-term non-communicable disease [10,12,14-16]. These circumstances are likely to lead to an increase in the burden of disease and an increase in treatment costs.
- Pain is a subjective element that is perceived by the human brain and related to a person's living experience, including psycho-social and cultural factors, as well as one’s state of awareness [34]. Researchers have suggested that should be considered in a multifaceted way, and it has been proposed that pain can also trigger other conditions. In hospitalized patients, pain may have effects that will prolong the hospital stay, thereby increasing the likelihood of contracting certain infections, such as pneumonia [35]. It has been stated that back pain caused by COVID-19 requires long-term treatment [12]. Since most of these treatments are given in the hospital environment, prolonged treatment for back pain may also increase the likelihood of patients developing other infections.
- In this study, back pain complaints were present in the majority in patients with musculoskeletal pain, who may be candidates for rehabilitation in the future. A study reported that 40% to 60% of COVID-19-positive patients experienced musculoskeletal pain [36]. Another study also stated that when back pain is not treated effectively on time, it may become chronic, leading to an increase in the incidence and costs of morbidity [1,2]. Meanwhile, a previous study showed that patients who received the COVID-19 vaccine experienced less musculoskeletal pain and more easily overcame the disease [37]. The findings of many similar studies have also pointed to the same results [19,23-25]. Vaccination at the required dose to avoid an unfavorable clinical course will protect the population at risk [38].
- According to the findings obtained in this study, vaccine hesitancy differed depending on marital status, vaccination status, and the type of vaccine received. Previous studies have also found that vaccine hesitancy is affected by many factors; for instance, in a survey conducted with 13,426 people, 71.5% of participants were likely to have the COVID-19 vaccine, and 48.1% would comply with these recommendations if their employers advised them to receive the vaccination [39]. These findings show that especially in the process of conducting COVID-19 vaccination campaigns, it is necessary to take into account individuals’ demographic characteristics and the statements of people who may influence them.
- The findings obtained in the examinations align with observations that pain is felt differently on an individual basis depending on sociocultural characteristics, sex, environment, and psychosomatic factors [40,41]. Similarly, despite individual differences in perceptions, it was thought that vaccination hesitancy at the social level involved similar factors to those involved in feeling pain. A sense of responsibility towards society and a person's beliefs are the most critical predictors of getting vaccinated [34,42]; thus, examining the coexistence of these different perceptions constitutes a strength of the research. A study supporting this finding was conducted by the US Food and Drug Administration. That study observed an increased humoral response due to booster dose COVID-19 mRNA vaccines in immunocompromised rheumatic/musculoskeletal patients and vulnerable individuals. Based on that result, it was predicted that individuals would not hesitate to get vaccinated, and it was reported to be effective in protection [42].
- Individuals have hesitated between the fear of contracting COVID-19 and anxiety about the vaccine's side effects. Successful results have been obtained in reducing hesitancy through efforts to address concerns about the vaccine in the simultaneous worldwide vaccine activities [43].
- It is a fact that back pain caused by COVID-19 can be reduced by necessary, appropriately dosed, and reliable vaccines, as has been demonstrated by many studies. In particular, the importance of vaccination, which is a preventive measure instead of an expensive treatment, for reducing back pain caused by COVID-19 should be explained to society. While explaining to individuals that necessary precautions can be taken with simple vaccination, it is very important to understand the reasons for individuals’ vaccine instability and vaccine refusal and to put scientific evidence-based management practices into effect.
Discussion
- It is predicted that COVID-19 will continue to affect people’s lives worldwide with changing forms and variants. However, despite this trend, there are many casualties among people who have become complacent by ignoring the evolution of the virus. It is predicted that new COVID-19 waves may come, even if they are relatively small. In order to reduce the number of new cases, complications, and deaths, it is necessary to continue effective public health measures. An essential public health measure is ensuring society-wide immunity against pandemics. Protecting public health and overcoming the pandemic process with less damage is possible with national and international cooperation. In particular, the reasons for COVID-19 vaccine hesitancy should be identified, these reasons should be eliminated, and the vaccination rate should be increased. Otherwise, the illness burden of back pain caused by COVID-19 and the financial burden that this disease will bring to health finances will prevent the health system from fulfilling its goals, causing significant public health problems.
Conclusion
- • Patients who had not been vaccinated expressed higher levels of distrust towards COVID-19 vaccines than patients who had been vaccinated.
- • Participants were less hesitant to get the Sinovac vaccine than other types of COVID 19 vaccines.
- • All participants had high COVID-19 vaccine confidence.
- • Those who did not have the COVID-19 vaccine were found to have a higher risk perception than those who had at least one dose of the COVID-19 vaccine.
HIGHLIGHTS
Supplementary Material
Table S1.
-
Ethics Approval
Ethical approval was received from the Diyarbakır Gazi Yaşargil Education and Research Hospital in Turkey (IRB-863-2021). The necessary permissions were obtained from the institution where the study was conducted.
-
Conflicts of Interest
The authors have no conflicts of interest to declare.
-
Funding
None.
-
Availability of Data
Data is available on request.
Article information
-
Acknowledgements
- We would like to acknowledge the patients, who were requested to fill out a questionnaire voluntarily. Thanks to my colleague Prof. Dr. Vatan Kavak for his contribution to the correct drawing and shaping of Figure 2.

| Variable | Mean±standard deviation |
|---|---|
| No. of vaccine doses | 1.38±0.680 |
| Days since the last vaccine dose | 21.17±47.601 |
| Total scale score | 27.88±6.044 |
| Lack of confidence | 21.12±5.392 |
| Risk | 6.75±1.742 |
| Variable | Total scale score | Lack of confidence | Risk | Vaccine dose | Days since the last vaccine dose | Age |
|---|---|---|---|---|---|---|
| Total scale score | 1 | |||||
| Lack of confidence | 0.960** | 1 | ||||
| Risk | 0.498** | 0.235** | 1 | |||
| Vaccine dose | –0.253** | –0.217** | –0.206** | 1 | ||
| Days since the last vaccine dose | –0.177* | –0.141 | –0.180* | 0.700** | 1 | |
| Age | –0.062 | –0.048 | –0.067 | 0.075 | 0.14 | 1 |
| Variable |
Lack of confidence |
Risk |
Vaccine hesitancy score |
|||
|---|---|---|---|---|---|---|
|
|
SD |
|
SD |
|
SD | |
| Sex | ||||||
| Female | 20.95 | 5.252 | 6.63 | 1.829 | 27.59 | 5.980 |
| Male | 21.27 | 5.538 | 6.87 | 1.663 | 28.13 | 6.122 |
| t | 0.381 | 0.855 | 0.587 | |||
| p | 0.704 | 0.394 | 0.558 | |||
| Income status | ||||||
| Low | 20.42 | 5.210 | 6.92 | 1.666 | 27.35 | 5.607 |
| Middle | 21.31 | 5.598 | 6.69 | 1.769 | 28.00 | 6.378 |
| High | 22.42 | 4.144 | 6.67 | 1.922 | 29.08 | 4.907 |
| F | 0.846 | 0.331 | 0.459 | |||
| p | 0.431 | 0.719 | 0.633 | |||
| Educational status | ||||||
| Illiterate | 20.98 | 5.304 | 6.56 | 1.564 | 27.53 | 5.885 |
| Primary-secondary school | 21.40 | 5.289 | 6.90 | 1.571 | 28.30 | 5.881 |
| High school | 19.91 | 5.293 | 6.51 | 2.020 | 26.42 | 5.751 |
| Associate’s degree and above | 23.38 | 6.265 | 7.46 | 2.366 | 30.84 | 7.679 |
| F | 1.433 | 1.326 | 1.915 | |||
| p | 0.235 | 0.268 | 0.129 | |||
| Marital status | ||||||
| Single | 21.39 | 5.755 | 6.09 | 1.843 | 27.48 | 6.647 |
| Married | 21.05 | 5.331 | 6.92 | 1.684 | 27.97 | 5.912 |
| t | 0.327 | 2.49 | 0.414 | |||
| p | 0.744 | 0.014* | 0.680 | |||
| Chronic disease status | ||||||
| Yes | 21.09 | 5.305 | 6.79 | 1.631 | 27.89 | 5.856 |
| No | 21.13 | 5.472 | 6.74 | 1.816 | 27.87 | 6.189 |
| t | 0.051 | 0.173 | 0.004 | |||
| p | 0.959 | 0.863 | 0.997 | |||
| Previous COVID-19 infection | ||||||
| Yes | 20.73 | 3.901 | 5.82 | 1.601 | 26.55 | 4.967 |
| No | 21.14 | 5.488 | 6.82 | 1.737 | 27.97 | 6.114 |
| t | 0.248 | 1.865 | 0.754 | |||
| p | 0.805 | 0.064 | 0.452 | |||
| Losing a relative due to COVID-19 | ||||||
| Yes | 21.41 | 5.544 | 6.87 | 1.756 | 28.28 | 6.143 |
| No | 20.95 | 5.323 | 6.70 | 1.740 | 27.65 | 6.005 |
| t | 0.527 | 0.615 | 0.648 | |||
| p | 0.599 | 0.540 | 0.518 | |||
| Vaccination status | ||||||
| Yes | 19.29 | 4.338 | 6.10 | 1.835 | 25.39 | 4.846 |
| No | 21.899 | 5.606 | 7.04 | 1.628 | 28.94 | 6.210 |
| t | 3.332 | 3.252 | 4.007 | |||
| p | 0.001* | 0.001* | 0.000** | |||
| Vaccine type | ||||||
| Not vaccinated | 21.9 | 5.606 | 7.04 | 1.628 | 28.94 | 6.210 |
| Sinovac | 18.42 | 5.388 | 5.68 | 1.827 | 24.1 | 5.586 |
| BioNTech | 20.21 | 3.821 | 6.17 | 1.970 | 26.38 | 4.480 |
| Sinovac+BioNTech | 18.63 | 3.068 | 6.88 | 1.246 | 25.5 | 3.703 |
| F | 3.349 | 4.679 | 4.922 | |||
| p | 0.021* | 0.004* | 0.003* | |||
| Severity of back pain | ||||||
| Very little | 20.83 | 4.190 | 6.89 | 2.026 | 27.72 | 5.431 |
| A little more | 20.79 | 5.468 | 6.55 | 1.719 | 27.34 | 6.334 |
| Moderate | 20.97 | 5.262 | 6.85 | 1.904 | 27.82 | 5.734 |
| Too much | 21.26 | 5.226 | 6.74 | 1.245 | 28.00 | 5.269 |
| Unbelievable pain | 22.33 | 7.211 | 6.78 | 1.896 | 29.11 | 8.512 |
| F | 0.200 | 0.289 | 0.265 | |||
| p | 0.938 | 0.885 | 0.900 | |||
- 1. McSwan J, Gudin J, Song XJ, et al. Self-healing: a concept for musculoskeletal body pain management-scientific evidence and mode of action. J Pain Res 2021;21:2943−58.ArticlePubMedPMCPDF
- 2. Ochoa JL. Essence, investigation, and management of "neuropathic" pains: hopes from acknowledgment of chaos. Muscle Nerve 1993;16:997−1008.Article
- 3. Patel ND, Broderick DF, Burns J, et al. ACR appropriateness criteria low back pain. J Am Coll Radiol 2016;13:1069−78.ArticlePubMed
- 4. Lopez-Leon S, Wegman-Ostrosky T, Perelman C, et al. More than 50 long-term effects of COVID-19: a systematic review and meta-analysis. Sci Rep 2021;11:16144. ArticlePubMedPMCPDF
- 5. Ali M, Bonna AS, Sarkar AS, et al. SARS-CoV-2 infection is associated with low back pain: findings from a community-based case-control study. Int J Infect Dis 2022;122:144−51.ArticlePubMedPMC
- 6. Abdullahi A, Candan SA, Abba MA, et al. Neurological and musculoskeletal features of COVID-19: a systematic review and meta-analysis. Front Neurol 2020;11:687. ArticlePubMedPMC
- 7. Bakılan F, Gokmen IG, Ortanca B, et al. Musculoskeletal symptoms and related factors in postacute COVID-19 patients. Int J Clin Pract 2021;75:e14734.PubMed
- 8. Murat S, Dogruoz Karatekin B, Icagasioglu A, et al. Clinical presentations of pain in patients with COVID-19 infection. Ir J Med Sci 2021;190:913−7.ArticlePubMedPMCPDF
- 9. Dayan S. COVID-19 and vaccine. Dicle Med J 2021;48(Special Issue):98−113. Turkish.
- 10. Grech S, Borg JN, Cuschieri S. Back pain: an aftermath of Covid-19 pandemic? A Malta perspective. Musculoskeletal Care 2022;20:145−50.ArticlePubMedPMCPDF
- 11. Joi P. Why does COVID-19 cause back pain? [Internet]. Vaccineswork; 2022 [cited 2023 Feb 2]. Available from: https://www.gavi.org/vaccineswork/why-does-covid-19-cause-back-pain.
- 12. Palmer K, Monaco A, Kivipelto M, et al. The potential long-term impact of the COVID-19 outbreak on patients with non-communicable diseases in Europe: consequences for healthy ageing. Aging Clin Exp Res 2020;32:1189−94.ArticlePubMedPMCPDF
- 13. Puntillo F, Giglio M, Brienza N, et al. Impact of COVID-19 pandemic on chronic pain management: looking for the best way to deliver care. Best Pract Res Clin Anaesthesiol 2020;34:529−37.ArticlePubMedPMC
- 14. Papalia GF, Petrucci G, Russo F, et al. COVID-19 pandemic increases the impact of low back pain: a systematic review and metanalysis. Int J Environ Res Public Health 2022;19:4599. ArticlePubMedPMC
- 15. McFann K, Baxter BA, LaVergne SM, et al. Quality of life (QoL) is reduced in those with severe COVID-19 disease, post-acute sequelae of COVID-19, and hospitalization in United States adults from Northern Colorado. Int J Environ Res Public Health 2021;18:11048. ArticlePubMedPMC
- 16. Reddy KP, Fitzmaurice KP, Scott JA, et al. Clinical outcomes and cost-effectiveness of COVID-19 vaccination in South Africa. Nat Commun 2021;12:6238. ArticlePubMedPMCPDF
- 17. Constantino AK. It’s not just severity—the types of Covid symptoms you get depend on the vaccines you’ve received, new data says. CNBC [Internet]. 2022 Oct 26 [cited 2023 Feb 3]. Available from: https://www.cnbc.com/2022/10/26/covid-symptoms-differ-based-on-vaccination-status-zoe-health-study.html.
- 18. Sirison K, Nittayasoot N, Techasuwanna R, et al. Cost-effectiveness analysis of COVID-19 vaccine booster dose in the Thai setting during the period of Omicron variant predominance. Trop Med Infect Dis 2023;8:91. ArticlePubMedPMC
- 19. UC Davis Health. Omicron BA.5: what we know about this COVID-19 strain [Internet]. UC Davis Health; 2023 [cited 2023 Feb 3]. Available from: https://health.ucdavis.edu/coronavirus/covid-19-information/omicron-variant.
- 20. World Health Organization (WHO). One year since the emergence of COVID-19 virus variant Omicron [Internet]. WHO; 2022 [cited 2023 Feb 3]. Available from: https://www.who.int/news-room/feature-stories/detail/one-year-since-the-emergence-of-omicron.
- 21. Spector T. COVID-19 booster jabs: what are the after effects? [Internet]. Zoe Health Study; 2021 [cited 2023 Feb 3]. Available from: https://health-Study.joinzoe.com/blog/covid-booster-vaccine-side-effects.
- 22. McMenamin ME, Nealon J, Lin Y, et al. Vaccine effectiveness of one, two, and three doses of BNT162b2 and CoronaVac against COVID-19 in Hong Kong: a population-based observational study. Lancet Infect Dis 2022;22:1435−43.ArticlePubMedPMC
- 23. Kwok WC, Leung SHI, Tam TC, et al. Efficacy of mRNA and inactivated whole virus vaccines against COVID-19 in patients with chronic respiratory diseases. Int J Chron Obstruct Pulmon Dis 2023;18:47−56.ArticlePubMedPMCPDF
- 24. Sumbuloğlu V, Sumbuloglu K. Research methods in health sciences. 7th ed. Hatiboğlu Publishing; 2017. Turkish.
- 25. Larson HJ, Jarrett C, Schulz WS, et al. Measuring vaccine hesitancy: the development of a survey tool. Vaccine 2015;33:4165−75.ArticlePubMed
- 26. Çapar H, Çınar F. Vaccıne hesıtancy scale ın pandemıcs: Turkısh valıdıty and relıabılıty study. J Med Health Sci 2021;6:40−5. Turkish.
- 27. Pallant J. SPSS survival manual: a step by step guide to data analysis using IBM SPSS. 6th ed. Open University Press; 2016.
- 28. IBM Corp. How to cite IBM SPSS statistics or earlier versions of SPSS [Internet]. IBM Corp.; 2021 [cited 2021 Nov 17]. Available from: https://www.ibm.com/support/pages/how-cite-ibm-spss-statistics-or-earlier-versions-spss.
- 29. Manning M, Munro D. The survey researcher’s SPSS cookbook. Pearson Education Australia; 2006.
- 30. Scheffe H. The analysis of variance. John Wiley and Sons; 1999.
- 31. Uz C, Umay E, Gundogdu I, et al. Back pain and related factors in patients with COVID-19 [Preprint]. Posted 2020 Dec 8. Research Square https://doi.org/10.21203/rs.3.rs-121763/v1.
- 32. Vaiserman A, Lushchak O. Implementation of longevity-promoting supplements and medications in public health practice: achievements, challenges and future perspectives. J Transl Med 2017;15:160. ArticlePubMedPMCPDF
- 33. Jacob R, Chandler K, Hagewood J, et al. Frequency of orthopedic manifestations in COVID-19 patients. J Taibah Univ Med Sci 2022;17:186−91.ArticlePubMedPMC
- 34. Grant JA, Zeidan F. Employing pain and mindfulness to understand consciousness: a symbiotic relationship. Curr Opin Psychol 2019;28:192−7.ArticlePubMedPMC
- 35. Babazade R, Vadhera RB, Krishnamurthy P, et al. Acute postcesarean pain is associated with in-hospital exclusive breastfeeding, length of stay and post-partum depression. J Clin Anesth 2020;62:109697. ArticlePubMed
- 36. Fernandez-de-Las-Penas C, Cancela-Cilleruelo I, Moro-López-Menchero P, et al. Prevalence of musculoskeletal post-COVID pain in hospitalized COVID-19 survivors depending on ınfection with the historical, alpha or delta SARS-CoV-2 variant. Biomedicines 2022;10:1951. ArticlePubMedPMC
- 37. Selvaraj P, Muthu S, Jeyaraman N, et al. Incidence and severity of SARS-CoV-2 virus post COVID-19 vaccination: a cross-sectional study in India. Clin Epidemiol Glob Health 2022;14:100983. ArticlePubMedPMC
- 38. Lazarus JV, Ratzan SC, Palayew A, et al. A global survey of potential acceptance of a COVID-19 vaccine. Nat Med 2021;27:225−8.ArticlePubMedPMCPDF
- 39. Yagcı U, Saygin M. Paın physıopathology. Med J SDU 2019;26:209−20. Turkish.
- 40. Antonelli M, Penfold RS, Merino J, et al. Risk factors and disease profile of post-vaccination SARS-CoV-2 infection in UK users of the COVID Symptom Study app: a prospective, community-based, nested, case-control study. Lancet Infect Dis 2022;22:43−55.ArticlePubMedPMC
- 41. Tharwat S, Abdelsalam HA, Abdelsalam A, et al. COVID-19 vaccination ıntention and vaccine hesitancy among patients with autoimmune and autoinflammatory rheumatological diseases: a survey. Int J Clin Pract 2022;2022:5931506. PubMedPMC
- 42. Connolly CM, Teles M, Frey S, et al. Booster-dose SARS-CoV-2 vaccination in patients with autoimmune disease: a case series. Ann Rheum Dis 2022;81:291−93.ArticlePubMed
- 43. Campochiaro C, Trignani G, Tomelleri A, et al. Potential acceptance of COVID-19 vaccine in rheumatological patients: a monocentric comparative survey. Ann Rheum Dis 2021;80:816−7.ArticlePubMed
References
Figure & Data
References
Citations
- COVID-19 VE DAVRANIŞSAL İKTİSAT: KÜRESEL BİR PANDEMİ SIRASINDA İNSAN DAVRANIŞINI ANLAMAK
İlknur ARSLAN ARAS
Sağlık ve Sosyal Refah Araştırmaları Dergisi.2024; 6(1): 97. CrossRef
 Cite
Cite