Articles
- Page Path
- HOME > Osong Public Health Res Perspect > Volume 12(2); 2021 > Article
-
Original Article
Sex differences in the relationship between depression and cardiovascular disease risk: a nationwide study in Korea -
Seol-bin Kim1
 , Ihn Sook Jeong2
 -
Osong Public Health and Research Perspectives 2021;12(2):105-114.
DOI: https://doi.org/10.24171/j.phrp.2021.12.2.08
Published online: April 29, 2021
1Busan Regional Mental Health Welfare Center, Busan, Korea
2College of Nursing, Pusan National University, Yangsan, Korea
- Corresponding author: Ihn Sook Jeong College of Nursing, Pusan National University, 49 Busandaehak-ro, Mulgeum-eup, Yangsan 50612, Korea E-mail: jeongis@pusan.ac.kr
- #Current affiliation: College of Nursing, Pusan National University, Yangsan, Korea
• Received: September 15, 2020 • Revised: January 5, 2021 • Accepted: January 27, 2021
© 2021 Korea Disease Control and Prevention Agency
This is an open access article under the CC BY-NC-ND license (http://creativecommons.org/licenses/by-nc-nd/4.0/).
Abstract
-
Objectives
- This study aimed to identify sex differences in the association between depression and the risk of developing cardiovascular disease (CVD).
-
Methods
- A secondary analysis was conducted of data from the fifth to seventh waves (2010−2018) of the Korea National Health and Nutrition Examination Survey. The participants were adults aged 30−74 years who had no diagnosis of CVD. The CVD risk was calculated using the Framingham Risk Score algorithm. Multiple linear regression analysis was conducted to identify the association between depression and CVD risk using a complex sample design.
-
Results
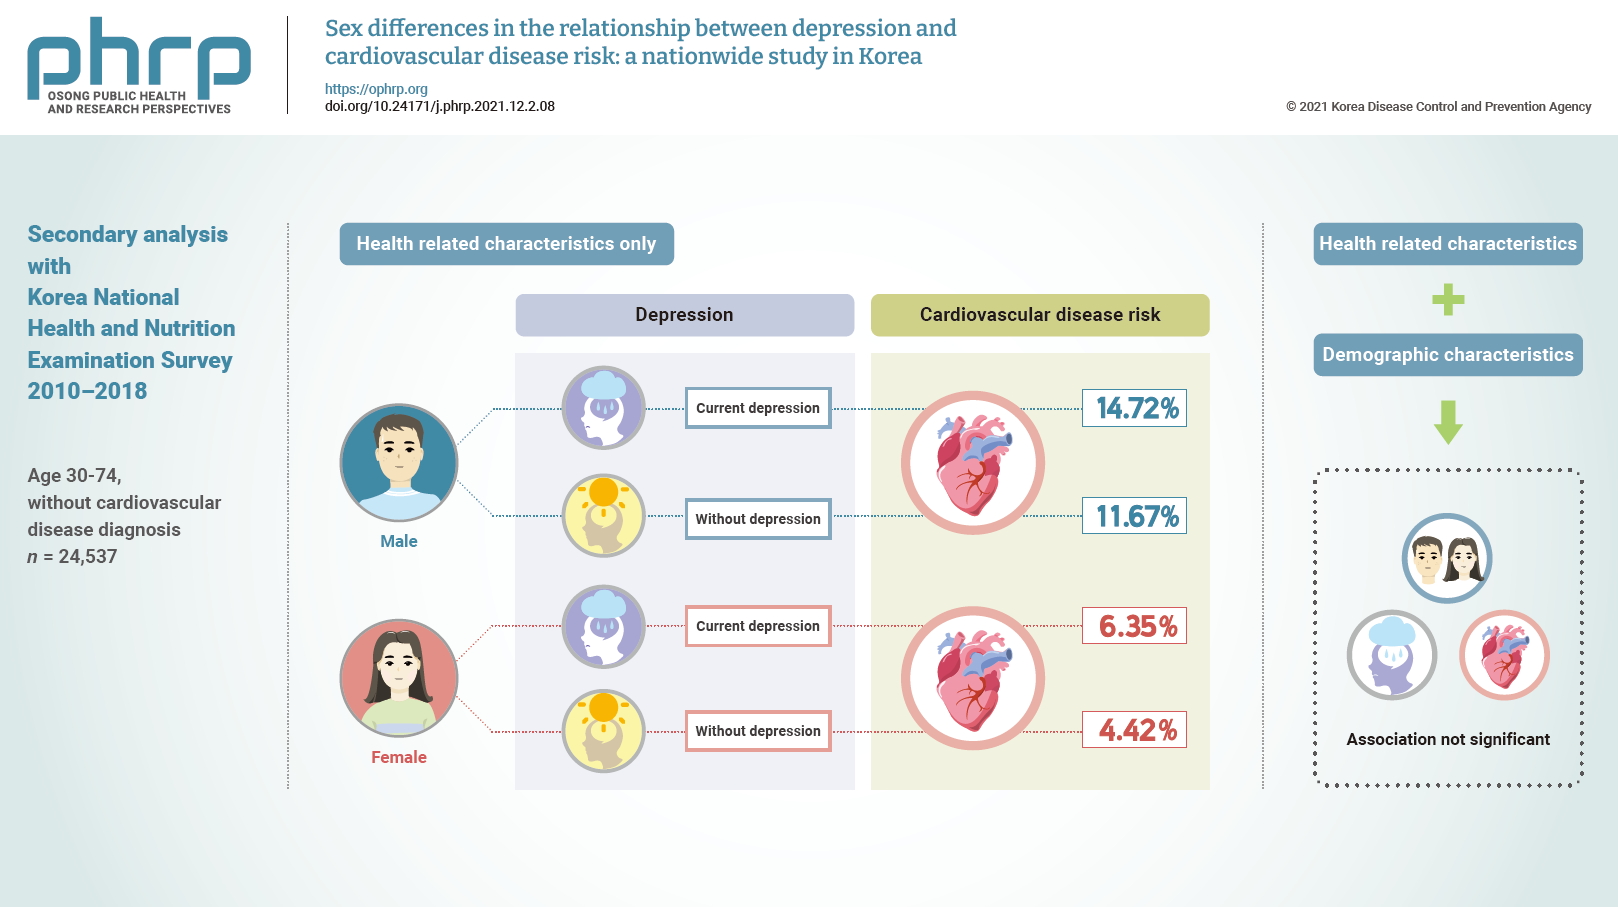
- The mean CVD risk was higher in males and females with current depression (14.72% vs. 6.35%, respectively) than in males without current depression (11.67% and 4.42%, respectively). Current depression showed a significant association with CVD risk after controlling for only health-related characteristics, but the significance disappeared in both males and females when demographic characteristics were additionally controlled.
-
Conclusion
- The presence of depression was not associated with CVD risk regardless of sex after controlling for confounding factors. Further studies are recommended to investigate the relationship between depression and CVD risk in a larger sample of both males and females with depression.
- Keywords: Cardiovascular diseases; Depression; Risk; Sex
- Cardiovascular disease (CVD) refers to a range of conditions such as ischemic heart disease, stroke, heart failure, atrial fibrillation, and rheumatic heart disease [1], and was the top cause of death worldwide in 2015 [2] and the second leading cause of death in South Korea, with 108.3 deaths per 100,000 people in 2017 [3]. The prevalence of CVD in Korea was 12.2% (16.0% in males, 17.4% in females); it was higher in males than in females below 50 years of age, but its prevalence significantly increased in females at ages over 50 [4]. Meanwhile, CVD risk in Korea is higher in males than in females [5]. Hypertension, dyslipidemia, diabetes, obesity, and poor health behaviors such as smoking, drinking, and lack of physical activity are major risk factors for CVD [1]. Social factors (e.g., marital status, education level, and social status) and psychological factors (e.g., stress, social support, and depression) are also considered to be important risk factors for CVD [6−8].
- Depression is experienced by more than 300 million people globally [9]. In Korea, the lifetime prevalence of major depressive disorder in Korea was found to be 5.0% (3.0% for males and 6.9% for females), making it the second most common mental illness in 2016 after alcohol and nicotine abuse [10]. Depression may be linked to CVD through various factors, including lifestyle factors, autonomic nervous system disturbances, endocrine disruption, inflammatory diseases, platelet aggregation, and endothelial dysfunction [11,12]. More specifically, many patients with depression show poor lifestyle habits that increase the risk of CVD, including sleep deprivation, smoking, drinking, lack of physical activity, poor hygiene, and lack of adherence to medication [13].
- Several studies have investigated the relationships between depression and CVD occurrence and/or risks [11−15], and some of them have shown significant associations between these variables [8,14,15]. However, studies of the relationships between these variables according to sex did not show consistent results [15−17]. In Korea, few studies have examined the relationship between depression and CVD risk factors [18−20]. Moreover, no study has directly identified the relationship between depression and CVD occurrence or CVD risk; in particular, no analytical study has explored these variables separately in males and females. In addition, in a meta-analysis of the relationship between depression and the onset of coronary atherosclerosis, most studies were conducted in Western countries [21]. Therefore, this study investigated the relationship between depression and CVD risk using data from the Korea National Health and Nutrition Survey (KNHANES), with the aim of filling the existing gap by examining that relationship by sex in an Asian population.
Introduction
- Participants
- We conducted a secondary analysis of data collected from 5th to 7th waves (2010−2018) of the KNHANES, which is conducted by the Korea Centers for Disease Control and Prevention. The KNHANES is an ongoing national survey system conducted to assess the health and nutritional status of Koreans, monitor changes in health risk factors and the prevalence of major diseases, and provide evidence to develop health policies and programs in Korea [22,23]. It was initiated in 1998, and the seventh survey has been completed. It was a triannual survey up to the third KNHANES, after which it was conducted annually (from 2007 onwards). The sample of KNHANES VII was selected using 2-stage stratified cluster sampling for enumeration districts and households, and a health survey, health examination, and nutrition survey were conducted among appropriate household members.
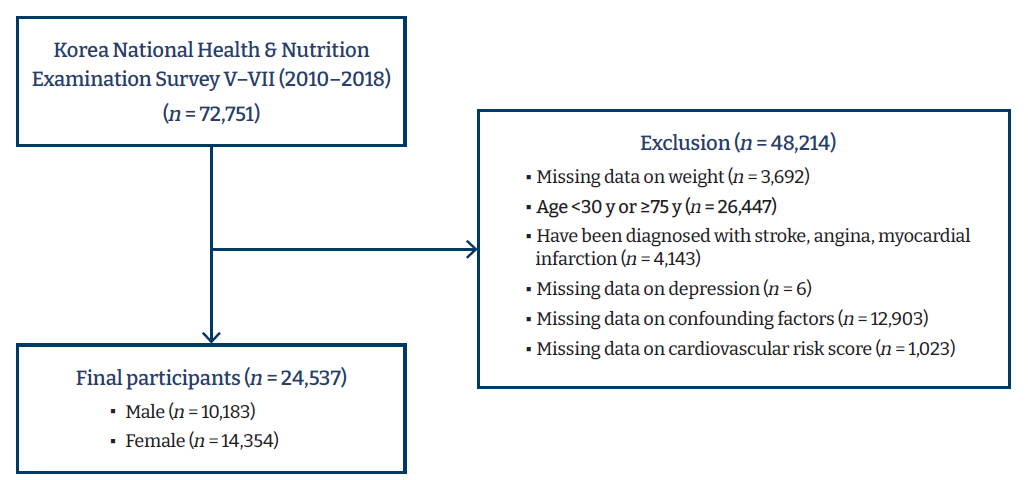
- The inclusion criteria for this study were as follows: no missing data for sampling weight, age between 30 and 74 years, the availability of depression data, no history of CVD (e.g., stroke, angina pectoris, or myocardial infarction), and no missing data on socio-demographics, health-related characteristics, depression, and CVD risk. Among 72,751 participants in the fifth to seventh survey, a total of 24,537 (10,183 males and 14,354 females) met those inclusion criteria (Figure 1).
- Variables and Definitions
- CVD risk, as the main outcome variable, was assessed using the Framingham Risk Score (FRS), which is a sex-specific algorithm used to estimate the 10-year CVD risk of an individual based on the Framingham Heart Study [24]. The formulas for males and females are presented separately so that the probability of developing CVD in the next 10 years can be predicted as a percentage according to sex (Table S1). There are 2 models for calculating the risk of CVD: the primary model (P model) and the simple office-based non-laboratory model (S model). Common variables in both models are sex, age, systolic blood pressure (SBP) (with/without treatment), current smoking, and diabetes. Additional variables are total cholesterol or high-density lipoprotein (HDL) cholesterol (mg/dL) for the P model, and body mass index for the S model [25]. We used the P model for the FRS, as the laboratory results were available. SBP was measured by taking the average of 3 readings. People without diagnosed hypertension were regarded as “not treated.”
- Depression, as the major explanatory variable, was categorized as “never,” “past,” and “current” according to the responses to the survey question on the history of diagnosed depression (“I have been diagnosed [with depression] by a doctor” and “I am currently suffering [from depression]”). Confounding variables included socio-demographic factors (age, employment, and household income) and health-related characteristics (alcohol intake, current smoking, physical activity, perceived stress, and comorbidities) known to be associated with depression [26−31] or CVD risk [32,33]. The variables were categorized as follows: “30−39,” “40−49,” “50−59,” “60−69,” and “over 70 years old” for age; “no,” “yes, regular job,” and “yes, irregular job” for employment; quartiles 1−4 for household income; “less than once per month,” “1−4 times per month,” and “2 times and higher per week” for alcohol intake; “yes” and “no” for current smoking; “yes” or “no” for engagement in high- or moderate-intensity physical activity during work or leisure for physical activity; and “much” and “little” for perceived stress. Comorbidities consisted of hypertension, diabetes, and dyslipidemia, and each disease was classified as “yes” or “no” depending on whether it had been diagnosed by a physician or not.
- Data Analysis
- The data were analyzed with IBM SPSS ver. 25.0 (IBM Corp., Armonk, NY, USA) using a complex sample design considering strata, cluster, and the combined sampling weight of 2 years. A 2-tailed test was performed with a significance level (α) of 0.05. The variables in the study were calculated using non-weighted frequency, weighted percentage, or mean and standard error according to sex. The distribution of CVD risk according to characteristics of the participants was analyzed using the chi-square test. As the CVD risk data did not satisfy the assumption of normality, CVD risk was classified as “lower risk” and “higher risk” based on the top 25% (15% for males and 5% for females). Multiple logistic regression analyses were conducted to evaluate the association of depression and CVD risk after controlling for confounding factors. We considered 4 models according to confounding factors input in the models: age (continuous) only in model 1; age (continuous), income, and occupation in model 2; drinking, smoking, physical activity, stress, and comorbidities in model 3; and all factors in model 4. Multi-collinearity was assessed based on a correlation coefficient ≥0.85. Meanwhile, we performed a sensitivity analysis to check the robustness of the findings on the impact of depression on CVD risk using the S model, which is used to calculate the FRS using body mass index instead of laboratory tests with total and HDL cholesterol results [24].
- Ethical Considerations
- This study was conducted after receiving permission for the use of data from the website of the KNHANES, and approval of exemption from review (IRB No: 2019_141_HR) from the Pusan National University Institutional Review Board.
Materials and Methods
- Characteristics and CVD Risk of the Participants
- Table 1 shows participants’ socio-demographic and health-related characteristics according to sex. Most of the 10,183 males were under 50 years old (61.2%), currently employed (80.8%), and in the third and fourth quartile income groups (65.3%); 43.2% were current smokers; and 1.1% had current depression. The majority of the 14,354 females were under 50 years old (60.6%), currently unemployed (53.8%), and in the third and fourth quartile income groups (61.0%); only 6.4% were current smokers; and 3.2% had current depression. All characteristics of the participants were significantly different according to sex. The distribution of CVD risk and its components is presented in Table 2. The mean CVD risk was 11.70% among males and 4.48% among females, reflecting a significant difference.
- The Association between Depression and CVD Risk
- According to the bivariate analysis, as shown in Tables 3 and 4, current depression was associated with CVD risk in both males and females. The mean CVD risk was higher in males and females with current depression (14.72% vs. 6.35%, respectively) than in males without current depression (11.67% and 4.42%, respectively). The prevalence of current depression among those with higher CVD risk was 1.6% in males and 5.0% in females, which was significantly higher than the prevalence among those with lower CVD risk. According to multiple logistic regression analysis, current depression showed a significant association with CVD risk after controlling for health-related characteristics, but the significance disappeared in both males and females when demographic characteristics were additionally controlled (Table 5).
- Sensitivity Analysis
- In the sensitivity analysis of CVD risk calculated using the S model, the mean CVD risk was 13.11% for males and 4.93% for females (Table S2). In the bivariate analysis, CVD risk was higher in subjects with current depression than in subjects without current depression both for males (p=0.032) and for females (p<0.001). However, there was no significant association between depression and CVD risk after controlling for confounding factors, which showed similar trends to the results obtained by using the P model for CVD risk calculation (Table S3).
Results
- This study aimed to investigate the relationship between depression and CVD risk by sex using data from a representative community-based health survey in Korea. The prevalence of current depression was 1.1% in males and 3.2% in females, and it increased to 2.0% in males and 6.1% in females when including past depression. This figure is slightly lower than the prevalence of 5.0% (3.0% in males, 6.9% in females) reported in a previous survey in 2016 [10], where depression was measured with the Korean version of Composite International Diagnostic Interview (CIDI). Since depression was identified by a self-reported physician’s diagnosis in this study, those who show depressive moods but have never been diagnosed by a physician were classified as “not depressed,” resulting in a potential underestimation of the prevalence of depression.
- The CVD risk was measured with the FRS, which is a well-known measure of 10-year CVD risk, and its validity has been established in various populations including Koreans [34,35]. The CVD risk was higher in males than in females, which is consistent with a previous finding in a French cohort where CVD risk was measured by the FRS [36]. The CVD risk by sex also showed a similar trend in a sensitivity analysis with non-laboratory data, although CVD risk with non-laboratory data was consistently higher than CVD risk with laboratory data (Figure S1).
- Without controlling for confounding factors, males and females with current depression showed 1.62 and 2.09 times higher CVD risk than those without depression, respectively, corresponding to a slightly higher effect size than that of 1.46 (95% confidence interval [CI], 1.37−1.55) reported in a meta-analysis [37]. However, depression was no longer associated with CVD risk after controlling for well-known confounding factors, including socio-demographic and health-related characteristics [26−33]. Nonetheless, an independent association between depression and CVD risk was found after controlling for only health-related characteristics for both males and females, with CVD risk calculated by the P model and S model. Health behaviors are important factors that explain the relationship between depression and CVD [11,12]. The prevalence of risk factors of CVD such as obesity, smoking, diabetes, and hypertension was found to be high in individuals with severe mental health disorders such as depression in a previous study [38]. According to our additional stratified analyses according to these categories, some health-related characteristics (e.g., alcohol intake, current smoking, and perceived stress) seem to act as effect modifiers, not as confounding factors, between the 2 variables (Table S4). For instance, males with depression who drank more than twice a week, smoked cigarettes, and experienced a high level of stress had higher CVD risk than their counterparts without depression. Unlike males, females with depression who drank fewer than 4 times a month and did not smoke had a higher CVD risk than those who did not have depression. This finding may be related to a lack of statistical power due to the small sample of heavy drinkers and smokers in females.
- Meanwhile, the findings on the relationship between depression and CVD risk by sex are not consistent among studies [15−17]. In a cohort study of United States (US) middle-aged and older adults who had never been diagnosed with stroke or heart disease, CVD occurred 1.39 times (95% CI, 1.20−1.61) more often in males and 1.19 times (95% CI, 1.05−1.35) more often in females who had depressive symptoms than in those who did not have depression, showing a significant correlation in both sexes [15]. According to the study of Holt et al. [16] using cohort data in the United Kingdom, CVD incidence increased by 1.130 times (95% CI, 1.034−1.235; p=0.007) in males with high depression scores, but no significant relationship was found in females. However, the study of Kouvari et al. [17] using cohort data in healthy populations without chronic diseases showed that depression was only associated with the incidence and recurrence of CVD in females. The inconsistent findings of studies on the relationship between depression and CVD risk by sex underscore the importance of further replication studies.
- Strengths and Limitations
- To our knowledge, this is the first study to identify the relationship between depression and CVD risk by sex using nationwide community-based data. This study has many strengths. First, we identified the relationship between depression and CVD risk after controlling for socio-demographic and health-related characteristics that are known to affect the relationship. Second, we used a large, nationally representative dataset for the entire country during 9 years, which increases the generalizability of our findings.
- However, the following limitations need to be taken into account when interpreting the results. First, this study did not control for the effects of variables such as potential biomarkers that affect CVD risk, since this was a secondary data analysis study and that information was not available. Second, as depression is defined by the subject’s reported diagnosis, the actual prevalence of depression may have been underestimated due to the possibility of undiagnosed depression. According to a nationwide survey of mental disorders in 2016, the use of mental health service over the past year was 9.6% [10], which was much lower than the rates of 14.2% in the US, 39.5% in Belgium, 35.5% in Spain, and 20% in Japan [39,40]. This underestimation leads to misclassification bias, as subjects with strong depressive symptoms who were undiagnosed by a physician were classified as not having depression, thereby weakening the strength of the association between the 2 variables. Third, CVD risk is a predicted value and may differ from the actual occurrence of CVD. In particular, CVD risk reflects the probability of CVD occurrence within 10 years. If the values used to calculate CVD risk change over time, CVD risk also changes, which may result in a difference in the actual incidence of CVD. Finally, study subjects with CVD, as well as those under 30 years old or over 75 years old, were excluded from the study, impeding the generalizability of the study results to these subjects.
Discussion
- According to our findings, the prevalence of depression was 3 times higher in females than in males, and CVD risk was more than 2.5 times as high in males as in females. The presence of depression was not associated with CVD risk in either males or females after controlling for confounding factors. This finding may be related to the small sample with depression and misclassification bias, as depression was defined according to a subject’s reported diagnosis. Therefore, we recommend that further research should investigate the relationship between depression and CVD risk in a larger sample of individuals with depression and take steps to minimize the underestimation of depression by using both subjects’ reported diagnoses and depressive symptoms in both males and females.
Conclusion
Supplementary Material
Table S2.
Table S3.
Table S4.
Figure S1.
-
Ethics Approval
This study was conducted after receiving permission for the use of data from the website of the KNHANES, and approval of exemption from review (IRB No: 2019_141_HR) from the Pusan University Institutional Review Board.
-
Conflicts of Interest
The authors have no conflicts of interest to declare.
-
Funding
None.
-
Availability of Data
All the data supporting the results of this study are included in the article and the supplementary file.
Article information


Table 1.Characteristics of the study participants according to sex
Table 2.Distribution of cardiovascular disease risk and its components according to sex
Table 3.Relationship between the characteristics of the participants and cardiovascular disease risk among males (n=10,183)
| Characteristic | Mean±SE | Lower risk (n=6,624) | Higher risk (n=3,559) | pa) |
|---|---|---|---|---|
| Age group (y) | <0.001 | |||
| 30−39 | 3.70±0.05 | 2,715 (44.3) | 10 (0.4) | |
| 40−49 | 8.40±0.12 | 2,266 (35.0) | 218 (9.9) | |
| 50−59 | 15.90±0.23 | 1,187 (16.7) | 925 (35.4) | |
| ≥60 | 27.21±0.31 | 456 (4.0) | 2,406 (54.3) | |
| Employment | <0.001 | |||
| No | 20.35±0.36 | 769 (11.2) | 1,722 (41.9) | |
| Yes, irregular | 14.12±0.35 | 708 (11.3) | 473 (17.1) | |
| Yes, regular | 8.80±0.12 | 5,147 (77.5) | 1,264 (41.0) | |
| Household income (quartile) | <0.001 | |||
| 1st | 20.43±0.50 | 424 (6.4) | 862 (21.3) | |
| 2nd | 12.33±0.26 | 1,514 (23.7) | 1,002 (26.6) | |
| 3rd | 10.11±0.19 | 2,287 (35.2) | 864 (26.1) | |
| 4th | 10.05±0.17 | 2,399 (34.7) | 831 (26.0) | |
| Alcohol intake | <0.001 | |||
| <1 time/mo | 12.77±0.28 | 1,392 (21.1) | 925 (24.1) | |
| 1−4 times/mo | 9.97±0.18 | 2,803 (42.4) | 1,102 (30.3) | |
| ≥2 times/wk | 12.84±0.20 | 2,429 (36.5) | 1,532 (45.6) | |
| Current smoking | <0.001 | |||
| No | 10.04±0.14 | 4,152 (60.1) | 1,962 (47.7) | |
| Yes | 13.89±0.22 | 2,472 (39.9) | 1,597 (52.3) | |
| Physical activity | <0.001 | |||
| No | 12.71±0.17 | 4,154 (61.2) | 2,614 (72.8) | |
| Yes | 9.88±0.17 | 2,470 (38.8) | 945 (27.2) | |
| Perceived stress | <0.001 | |||
| Much | 9.64±0.21 | 1,852 (28.0) | 577 (17.7) | |
| Little | 12.40±0.15 | 4,772 (72.0) | 2,982 (82.3) | |
| Comorbidities | <0.001 | |||
| No | 8.48±0.10 | 5,645 (86.1) | 1,488 (43.7) | |
| Yes | 21.36±0.31 | 979 (13.9) | 2,071 (56.3) | |
| Current depression | 0.030 | |||
| No | 11.67±0.13 | 6,563 (99.0) | 3,505 (98.4) | |
| Yes | 14.72±1.17 | 61 (1.0) | 54 (1.6) |
Table 4.Relationship between the characteristics of the participants and cardiovascular disease risk among females (n=14,354)
| Characteristic | Mean±SE | Lower risk (n=9,462) | Higher risk (n=4,892) | pa) |
|---|---|---|---|---|
| Age group (y) | <0.001 | |||
| 30−39 | 1.18±0.01 | 4,036 (43.1) | 19 (0.6) | |
| 40−49 | 2.67±0.03 | 3,416 (37.7) | 301 (9.1) | |
| 50−59 | 5.93±0.08 | 1,670 (16.6) | 1,584 (38.3) | |
| ≥60 | 11.90±0.15 | 340 (2.6) | 2,988 (52.0) | |
| Employment | <0.001 | |||
| No | 5.12±0.08 | 4,787 (50.3) | 3,216 (62.9) | |
| Yes, irregular | 4.83±0.12 | 1,297 (14.4) | 827 (17.9) | |
| Yes, regular | 3.19±0.06 | 3,378 (35.4) | 849 (19.2) | |
| Household income (quartile) | <0.001 | |||
| 1st | 8.66±0.20 | 656 (7.3) | 1,375 (25.5) | |
| 2nd | 4.74±0.10 | 2,266 (25.2) | 1,458 (29.8) | |
| 3rd | 3.60±0.07 | 3,235 (34.0) | 1,093 (23.6) | |
| 4th | 3.43±0.06 | 3,305 (33.5) | 966 (21.1) | |
| Alcohol intake | <0.001 | |||
| <1 time/mo | 5.11±0.07 | 4,588 (47.2) | 3,048 (59.9) | |
| 1−4 times/mo | 3.87±0.07 | 3,642 (39.4) | 1,421 (30.7) | |
| ≥2 times/wk | 3.74±0.12 | 1,232 (13.4) | 423 (9.4) | |
| Current smoking | <0.001 | |||
| No | 4.37±0.05 | 9,024 (94.7) | 4,557 (91.7) | |
| Yes | 6.17±0.26 | 438 (5.3) | 335 (8.3) | |
| Physical activity | <0.001 | |||
| No | 4.78±0.06 | 6,801 (71.3) | 3,967 (80.3) | |
| Yes | 3.65±0.07 | 2,661 (28.7) | 925 (19.7) | |
| Perceived stress | <0.001 | |||
| Much | 4.27±0.09 | 2,586 (28.1) | 1,191 (25.0) | |
| Little | 4.56±0.06 | 6,876 (71.9) | 3,701 (75.0) | |
| Comorbidities | <0.001 | |||
| No | 2.93±0.03 | 8,675 (92.1) | 2,023 (42.7) | |
| Yes | 10.02±0.14 | 787 (7.9) | 2,869 (57.3) | |
| Current depression | <0.001 | |||
| No | 4.42±0.05 | 9,231 (97.5) | 4,632 (95.0) | |
| Yes | 6.35±0.29 | 231 (2.5) | 260 (5.0) |
Table 5.Multiple logistic regression results on the association between depression and cardiovascular disease risk by sex
| Modela) |
Male (n=10,183) |
Female (n=14,354) |
||||
|---|---|---|---|---|---|---|
| OR (95% CI) | p | R2b) | OR (95% CI) | p | R2b) | |
| 0 | 1.62 (1.04−2.53) | 0.032 | 0.001 | 2.09 (1.69−2.60) | <0.001 | 0.004 |
| 1 | 1.26 (0.67−2.37) | 0.469 | 0.417 | 1.28 (0.88−1.87) | 0.203 | 0.457 |
| 2 | 1.06 (0.55−2.01 | 0.869 | 0.418 | 1.17 (0.79−1.71) | 0.433 | 0.459 |
| 3 | 1.81 (1.12−2.94) | 0.016 | 0.201 | 1.62 (1.24−2.13) | <0.001 | 0.253 |
| 4 | 1.07 (0.55−2.08) | 0.837 | 0.511 | 0.92 (0.64−1.33) | 0.671 | 0.494 |
- 1. Joseph P, Leong D, McKee M, et al. Reducing the global burden of cardiovascular disease, part 1: the epidemiology and risk factors. Circ Res 2017;121:677−94.ArticlePubMed
- 2. World Health Organization (WHO). Cardiovascular diseases (CVDs) [Internet]. Geneva: WHO; 2017 [cited 2020 Apr 23]. Available from: http://www.who.int/mediacentre/factsheets/fs317/en/.
- 3. Statistics Korea. Causes of death statistics [Internet]. Daejeon: Statistics Korea; 2019 [cited 2019 Jun 4]. Available from: http://kostat.go.kr/understand/info/info_kost/1/index.action?bmode=read&cd=S004001&tt=cate.
- 4. Kim YJ, Kwak C. Prevalence and associated risk factors for cardiovascular disease: findings from the 2005, 2007 Korea National Health and Nutrition Examination Survey. Korean J Health Promot 2011;11:169−76. Korean.
- 5. Park KO, Seo JY. Gender differences in factors influencing the framingham risk score-coronary heart disease by BMI. J Korean Acad Community Health Nurs 2014;25:248−58. Korean.Article
- 6. Cho JJ. Stress and cardiovascular disease. J Korean Med Assoc 2013;56:462−70. Korean.Article
- 7. Cohen R, Gasca NC, McClelland RL, et al. Effect of physical activity on the relation between psychosocial factors and cardiovascular events (from the multi-ethnic study of atherosclerosis). Am J Cardiol 2016;117:1545−51.ArticlePubMedPMC
- 8. Seldenrijk A, Vogelzangs N, Batelaan NM, et al. Depression, anxiety and 6-year risk of cardiovascular disease. J Psychosom Res 2015;78:123−9.ArticlePubMed
- 9. World Health Organization (WHO). Depression [Internet]. Geneva: WHO; 2020 [cited 2020 Jan 30]. Available from: https://www.who.int/en/news-room/fact-sheets/detail/depression.
- 10. Hong JP. 2016 The survey of mental disorders in Korea [Internet]. Seoul: Korea Social Security Information Service; 2016 [cited 2019 Jun 4]. Available from: http://www.ssis.or.kr/lay1/bbs/S1T925C926/A/62/view.do?article_seq=112803.
- 11. Bucciarelli V, Caterino AL, Bianco F, et al. Depression and cardiovascular disease: The deep blue sea of women's heart. Trends Cardiovasc Med 2020;30:170−6.ArticlePubMed
- 12. Dhar AK, Barton DA. Depression and the link with cardiovascular disease. Front Psychiatry 2016 Mar 21 [Epub]. https://doi.org/10.3389/fpsyt.2016.00033.Article
- 13. Stapelberg NJ, Neumann DL, Shum DH, et al. A topographical map of the causal network of mechanisms underlying the relationship between major depressive disorder and coronary heart disease. Aust N Z J Psychiatry 2011;45:351−69.ArticlePubMed
- 14. Almas A, Forsell Y, Iqbal R, et al. Severity of depression, anxious distress and the risk of cardiovascular disease in a Swedish population-based cohort. PLoS One 2015;10:e0140742.ArticlePubMedPMC
- 15. Xiang X, An R. Depression and onset of cardiovascular disease in the US middle-aged and older adults. Aging Ment Health 2015;19:1084−92.ArticlePubMed
- 16. Holt RI, Phillips DI, Jameson KA, et al. The relationship between depression, anxiety and cardiovascular disease: findings from the Hertfordshire Cohort Study. J Affect Disord 2013;150:84−90.ArticlePubMedPMC
- 17. Kouvari M, Panagiotakos DB, Chrysohoou C, et al. Sex-discrete role of depressive symptomatology on 10-year first and recurrent cardiovascular disease incidence: results from ATTICA and GREECS prospective studies. Hellenic J Cardiol 2020;61:321−8.ArticlePubMed
- 18. Jung YH, Shin HK, Kim YH, et al. The association of depression and cardiovascular risk factors in Korean adults: the sixth Korea National Health and Nutrition Examination Survey, 2014. Korean J Fam Pract 2017;7:308−14. Korean.Article
- 19. Song HY, Nam KA. Sex differences of the relationships between cardiovascular risk markers and psychosocial factors in community-residing adults. J Korean Biol Nurs Sci 2016;18:221−30. Korean.Article
- 20. So ES. Cardiovascular disease risk factors associated with depression among Korean adults with coronary artery disease and cerebrovascular disease. Asia Pac Psychiatry 2015;7:173−81.ArticlePubMed
- 21. Lin S, Zhang H, Ma A. The association between depression and coronary artery calcification: A meta-analysis of observational studies. J Affect Disord 2018;232:276−82.ArticlePubMed
- 22. Korea Centers for Disease Control and Prevention (KCDC). The seventh Korea National Health and Nutrition Examination Survey (KNHANES Ⅶ-2), 2017 [Internet]. Cheongju: KCDC; 2019 [cited 2019 Oct 28]. Available from: https://knhanes.cdc.go.kr/knhanes/sub03/sub03_06_02.do.
- 23. Kweon S, Kim Y, Jang MJ, et al. Data resource profile: the Korea National Health and Nutrition Examination Survey (KNHANES). Int J Epidemiol 2014;43:69−77.ArticlePubMedPMC
- 24. D'Agostino RB Sr, Vasan RS, Pencina MJ, et al. General cardiovascular risk profile for use in primary care: the Framingham Heart Study. Circulation 2008;117:743−53.ArticlePubMed
- 25. Framingham Heart Study (FHS). Cardiovascular disease (10-year risk) [Internet]. Framingham, MA: FHS; 2018 [cited 2020 Nov 10]. Available from: https://framinghamheartstudy.org/fhs-risk-functions/cardiovascular-disease-10-year-risk/.
- 26. Parker G, Brotchie H. Gender differences in depression. Int Rev Psychiatry 2010;22:429−36.ArticlePubMed
- 27. Dev S, Kim D. State-level income inequality and county-level social capital in relation to individual-level depression in middle-aged adults: a lagged multilevel study. Int J Environ Res Public Health 2020;17:5386. ArticlePubMedPMC
- 28. Boden JM, Fergusson DM. Alcohol and depression. Addiction 2011;106:906−14.ArticlePubMed
- 29. Lawrence D, Mitrou F, Zubrick SR. Smoking and mental illness: results from population surveys in Australia and the United States. BMC Public Health 2009;9:285. ArticlePubMedPMC
- 30. Hammen C. Risk factors for depression: an autobiographical review. Annu Rev Clin Psychol 2018;14:1−28.ArticlePubMed
- 31. Read JR, Sharpe L, Modini M, et al. Multimorbidity and depression: a systematic review and meta-analysis. J Affect Disord 2017;221:36−46.ArticlePubMed
- 32. Kozela M, Bobak M, Besala A, et al. The association of depressive symptoms with cardiovascular and all-cause mortality in Central and Eastern Europe: prospective results of the HAPIEE study. Eur J Prev Cardiol 2016;23:1839−47.ArticlePubMedPMC
- 33. Havranek EP, Mujahid MS, Barr DA, et al. Social determinants of risk and outcomes for cardiovascular disease: a scientific statement From the American Heart Association. Circulation 2015;132:873−98.ArticlePubMed
- 34. Wiernik E, Meneton P, Empana JP, et al. Cardiovascular risk goes up as your mood goes down: interaction of depression and socioeconomic status in determination of cardiovascular risk in the CONSTANCES cohort. Int J Cardiol 2018;262:99−105.ArticlePubMed
- 35. Versteylen MO, Joosen IA, Shaw LJ, et al. Comparison of Framingham, PROCAM, SCORE, and Diamond Forrester to predict coronary atherosclerosis and cardiovascular events. J Nucl Cardiol 2011;18:904−11.ArticlePubMedPMC
- 36. Kim MB, Park WJ, Jang KH, et al. Comparison of cardiovascular disease risk assessment tools by using coronary CT angiography. Korean J Occup Environ Med 2010;22:102−13. Korean.Article
- 37. Van der Kooy K, van Hout H, Marwijk H, et al. Depression and the risk for cardiovascular diseases: systematic review and meta analysis. Int J Geriatr Psychiatry 2007;22:613−26.ArticlePubMed
- 38. Keenan TE, Yu A, Cooper LA, et al. Racial patterns of cardiovascular disease risk factors in serious mental illness and the overall U.S. population. Schizophr Res 2013;150:211−6.ArticlePubMed
- 39. Kessler RC, Ustun TB. The WHO world mental health surveys: global perspectives on the epidemiology of mental disorders. New York: Cambridge University Press; 2008.
- 40. Naganuma Y, Tachimori H, Kawakami N, et al. Twelve-month use of mental health services in four areas in Japan: findings from the World Mental Health Japan Survey 2002-2003. Psychiatry Clin Neurosci 2006;60:240−8.ArticlePubMed
References
Figure & Data
References
Citations
Citations to this article as recorded by 
- Sex Differences in the Association Between Depression and Incident Cardiovascular Disease
Keitaro Senoo, Hidehiro Kaneko, Kensuke Ueno, Yuta Suzuki, Akira Okada, Katsuhito Fujiu, Taisuke Jo, Norifumi Takeda, Hiroyuki Morita, Kentaro Kamiya, Junya Ako, Koichi Node, Hideo Yasunaga, Issei Komuro
JACC: Asia.2024; 4(4): 279. CrossRef
 PubReader
 ePub Link
 Cite
Cite