Articles
- Page Path
- HOME > Osong Public Health Res Perspect > Volume 9(6); 2018 > Article
-
Original Article
Association between Beta-lactam Antibiotic Resistance and Virulence Factors in AmpC Producing Clinical Strains ofP. aeruginosa - Sanaz Dehbashia, Hamed Tahmasebib, Mohammad Reza Arabestania
-
Osong Public Health and Research Perspectives 2018;9(6):325-333.
DOI: https://doi.org/10.24171/j.phrp.2018.9.6.06
Published online: December 31, 2018
aDepartment of Microbiology, Faculty of Medicine, Hamadan University of Medical Sciences, Hamadan, Iran
bDepartment of Microbiology, Faculty of Medicine, Zahedan University of Medical Sciences, Zahedan, Iran
- *Corresponding author: Mohammad Reza Arabestani, Department of Microbiology, Faculty of Medicine, Brucellosis research center, Hamadan University of Medical Sciences, Hamadan, Iran, E-mail: mohammad.arabestani@gmail.com
• Received: July 10, 2018 • Revised: October 16, 2018 • Accepted: October 22, 2018
Copyright ©2018, Korea Centers for Disease Control and Prevention
This is an open access article under the CC BY-NC-ND license (http://creativecommons.org/licenses/by-nc-nd/4.0/).
Abstract
-
Objectives
- The purpose of this study was to determine the presence of IMP and OXA genes in clinical strains of Pseudomonas aeruginosa (P. aeruginosa) that are carriers of the ampC gene.
-
Methods
- In this study, 105 clinical isolates of P. aeruginosa were collected. Antibiotic resistance patterns were determined using the disk diffusion method. The strains carrying AmpC enzymes were characterized by a combination disk method. Multiplex-PCR was used to identify resistance and virulence genes, chi-square test was used to determine the relationship between variables.
-
Results
- Among 105 isolates of P. aeruginosa, the highest antibiotic resistance was to cefotaxime and aztreonam, and the least resistance was to colictin and ceftazidime. There were 49 isolates (46.66%) that showed an AmpC phenotype. In addition, the frequencies of the resistance genes were; OXA48 gene 85.2%, OXA199, 139 3.8%, OXA23 3.8%, OXA2 66.6%, OXA10 3.8%, OXA51 85.2% and OXA58 3.8%. The IMP27 gene was detected in 9 isolates (8.57%) and the IMP3.34 was detected in 11 isolates (10.47%). Other genes detected included; lasR (17.1%), lasB (18%) and lasA (26.6%). There was a significant relationship between virulence factors and the OX and IMP genes (p ≤ 0.05).
-
Conclusion
- The relationship between antibiotic resistance and virulence factors observed in this study could play an important role in outbreaks associated with P. aeruginosa infections.
- Beta-lactams are used globally as the appropriate choice to cure bacterial infections. These drugs inhibit cell wall construction and possess a beta-lactam central circle [1]. In the past decades, several extended spectrum beta-lactamases (ESBLs) have been discovered in gram negative bacteria and have been classified into 4 groups including; penicillinases, metallo beta-lactamases, oxacillinases and cephalosporinases. Class C has an enzyme named AmpC. All strains of Pseudmonas aeruginosa (P. aeruginosa) carry an attenuated transcript of the ampC gene on the chromosome which could be induced by exposure to first generation cephalosporines and produce AmpC enzymes. Also, P. aeruginosa produces a wide range of beta-lactamases which are transferred on plasmids and other mobile genetic elements [2].
- IMP-1 belongs to Class B of the beta-lactamases with extended spectrum metallo beta-lactamases, which hydrolyze all beta-lactams except for aztreonam, and are resistant to clavolanic acid and sulbactam [2]. Since these enzymes hydrolyse imipenem and meropenem, they are known as carbapenemase. IMP was firstly reported in P. aeruginosa as a gene carried on plasmid, and then subsequently discovered that it could be transferred on integrons. Therefore, this may explain why IMP spreads in some genus of entrobacteraceae [3]. The other group of beta-lactamases are oxacillinases. They are susceptible to cluvlanic acid (except for OXA-48) and hydrolyse ceftazidime and azteronam. Oxacillinases are carried on plasmids except for OXA-18. However, oxacillinases and their variants such as OXA-51, OXA-23 and OXA-58 are more prevalent in entrobacteriaceae, due to genetic circulation and Horizontal Gene Exchange (HGT) mechanisms observed in P. aeruginosa [4].
- One of the clinical significances of P. aeruginosa is its ability to secrete several virulence factors. Many virulence factors in P. aeruginosa are horizontally acquired, as reflected by the great diversity within the species. In addition, it is noteworthy that virulence factors are likely to perform a useful function for any organism within their natural environment, and that as P. aeruginosa is not an obligate parasite of humans, many factors harmful to humans expressed by this organism will most probably perform a more innocuous function within the organism’s natural habitat [5]. Quorum Sensing (QS) and biofilm formation are one of the most important virulence factors of this bacterium and several systems have been characterized, such as those from Vibrio fischeri, P. aeruginosa, and Staphylococcus aureus. P. aeruginosa utilizes two AHL (Acyl Homserine Lactone) based QS systems; Las, Rhl, a non AHL mechanism and the Pseudomonas Quinolone Signal (PQS) system [6].
- Among antibiotic resistant strains of P. aeruginosa, enhanced biofilm production and a coordinating regulatory protein to switch on and off antibiotic resistance have been observed [7]. Elastase (syn: pulmonary elastase, LasB) is the most powerful proteolytic enzyme secreted by P. aeruginosa, accounting for 90% of its proteolytic activity. Elastase is coded by lasB, the expression of which is controlled through the las QS pathway, and is produced in greatest quantity when cells are in the late logarithmic phase of growth or at high cell density [5,6]. P. aeruginosa also produces a second elastolytic enzyme, the serine protease LasA (coded by lasA). This enzyme was thought to nick elastin, exposing active sites for proteolysis by LasB. Subsequent studies have however shown that the enzyme is capable of elastolytic activity independent of LasB and Apr [6].
- From another point of view, AmpC producing P. aeruginosa could have intrinsic non-induced resistance against some antibiotics. Although uridopenicillins and third generation cephalosporines are unstable against AmpC, they do not induce AmpC synthesis [8]. Therefore, these antibiotics are active unless AmpC is induced, however, spontaneous mutants would be produced by intermediate frequency. Therefore, the aim of this study was to determine the association between beta-lactam antibiotic resistance and virulence factors in AmpC producing P. aeruginosa.
Introduction
- 1. Collection of specimens
- In this descriptive-analytic study, which was performed in a period of 7 months from May 2015 to April 2016, different clinical specimens were collected including blood, urine, cerebrospinal fluid, ulcer secretions, chip, burn wounds, catheters, and others, from the educational hospitals affiliated to Hamadan University of Medical Science. The criteria for entering individuals for sampling were patients who were hospitalized for a long time and suspected of bacterial infection. Collected samples were immediately placed in nutrient broth and transferred to the laboratory of the Microbiology Department, Faculty of Medicine, Hamadan University, Iran. This study was supported by the Vice-Chancellor for Research at Hamadan University of Medical Sciences (Grant No.: 9510075755) and was approved by the Ethics Committee of Hamadan University of Medical Sciences (Code No.: IR.UMSHA.REC.1395402).
- 2. Isolation and identification of P. aeruginosa
- The isolates were cultured on blood agar and MacConkey agar (Merck, Germany) and incubated at 42°C. P. aeruginosa showed a lactose non-fermenter appearance on MacConkey agar. The resulting colony was then transferred to the TSI (Merck, Germany). The isolates were all oxidative organisms when grown on Hugh and Liefson medium and were able to reduce nitrate to nitrite. Identification of tested isolates was confirmed with an API 20E (bioMérieux) identification kit. Stock cultures were stored in 0.05 M K-Na-phosphate buffer, pH 7.0, and containing 15% glycerol at −20°C.
- 3. Minimum inhibitory concentration testing
- All tested P. aeruginosa isolates were screened for minimum inhibitory concentration (MIC) testing to 10 different antimicrobials, Cefoxotin, Ceftazidime, Cefotaxime, Aztreonam, Ceftriaxone, Colistin, Meropenem, Doripenem, Ertapenem, and Imipenem using E- test strips (Liofilchem, Italy) on Mueller-Hinton agar media following the zone diameter criteria recommended by the Clinical and Laboratory Standards Institute. For the purpose of analysis, isolates with resistant phenotypes and also those classified as having intermediate resistance were included [9,10].
- 4. AmpC testing
- Based on Clinical and Laboratory Standards Institute recommendations, to investigate AmpC producing strains of P. aeruginosa, cefoxitin (30μg) disks (Mast. England) were used with AmpC inhibitors based on the study by Tam et al [3]. Klebsiella pneumoniae ATCC700603 and P. aeruginosa ATCC27853 were applied as positive and negative control, respectively [9–11].
- 5. Genomic DNA and plasmid extraction
- Strains were inoculated in LB broth (Merck, Germany) and incubated at 37°C. In order to extract genomic DNA and plasmid, an extraction kit (Qiagen, Germany) was used according to the manufacturer’s instructions.
- 6. PCR Amplification and Gel Electrophoresis
- For the amplification of resistance and virulence genes, sequences of primers proposed by Mlynarcik et al [11] and Fazeli et al [12] were used. The programmable thermal cycler (Eppendorf, Mastercycler® 5332, Germany) device was used in all PCR reactions. The first- third multiplex PCR reaction was used for the detection of betalactamas genes and fifth reaction was used for the detection of virulence genes of P. aeruginosa isolated from clinical samples. The PCR reaction was performed in a total volume of 50 μL, containing 1 μL of DNA template, 2 mM MgCl2, 250 μM dNTP (Fermentas, Waltham, Massachusetts, United States), 1 μM of each primer, 1.25 U Taq DNA polymerase (Fermentas, Fermentas, Waltham, Massachusetts, United States), and 5 μL PCR buffer 10X. The DNA was amplified using the following protocol: initial denaturation (94°C for 5 min), followed by 35 cycles of denaturation (94°C for 45 seconds), annealing and extension (72°C, from 1 min), with a single final extension of 5 min at 72°C. PCR products were separated in 1% agarose gel for 65 min at 85 volts, stained with Gel Red 3X (Biotium, Fremont, CA) and detected by UV transilluminator.
- 7. Sequencing
- PCR products (amplicons) were purified and sequenced by Bioneer Co., Korea mediated by Pishgam Co., Iran and the data were analyzed using the Chromas software and compared to the microbial genome using the Basic Local Alignment Search Tool (BLAST) in order to confirm the sequence authenticity.
- 8. Statistical analysis
- Statistical presentation and analysis of the present study was conducted, using the mean, standard error, chi-square and linear correlation coefficient tests of SPSS 16.0 for Windows (SPSS, Inc. Chicago, IL, USA).
Materials and Methods
- Out of 105 P. aeruginosa clinical isolates, 79 isolates (75.23%) were collected from women and 26 isolates (24.76%) from men, most of whom were between 20–40 years old. From the 105 clinical isolates, 55 isolates (48.57%) were obtained from burn wounds, 24 isolates (22.85%) from blood cultures, 14 isolates (13.33%) from urine, 9 isolates (15.78%) from catheters, and 3 isolates (2.85%) from discharges.
- 1. MIC and AmpC producer strains of P. aeruginosa
- An antibiotic resistance pattern and MIC test for various antibiotics are shown in Table 1. Based on these results, 74 isolates (70.74%) were resistant to cefotaxim, 19 isolates (18.09%) resistant to azteronam, 91 isolates (86.66%) resistant to ceftriaxone, 2 isolates (1.94%) resistant to ceftazidime, 49 isolates (46.66 %) resistant to cefoxitin, and 1 isolate with intermediate resistance to colistin. Out of 48 AmpC producer strains, 39 isolates (81.2%) were resistant to cefotaxime, 16 isolates (33.33%) resistant to azteronam, 44 isolates (91.6%) resistant to ceftriaxone, 2 isolates (4.16%) resistant to ceftazidime, and 46 (96%) resistant to cefoxotin were observed. Out of 105 isolates, 48 isolates (54.71%) were AmpC producing P. aeruginosa which were collected from burn wounds (21 isolates), blood (11 isolates), urine (9 isolates), and catheters (7 isolates). Patients colonized with AmpC producer strains were between 40–60 years old.
- 2. Frequency of resistance genes in AmpC and non-AmpC producer strains
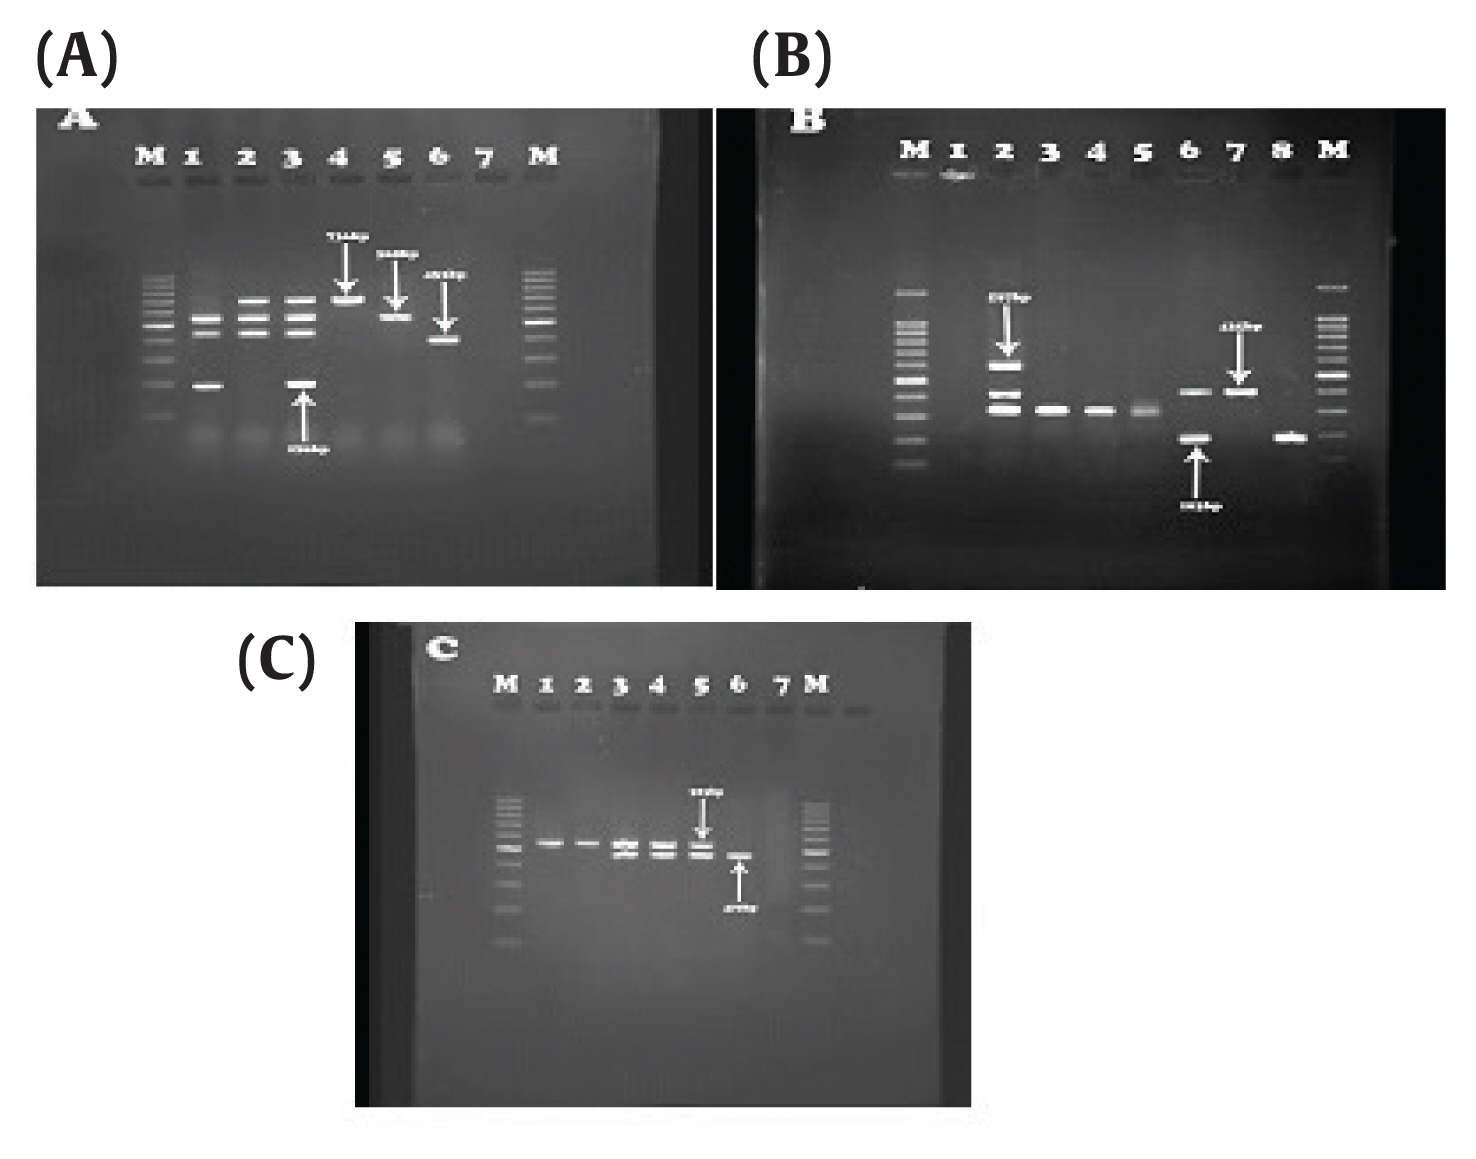
- Out of the 48 isolates that carried the AmpC encoding gene, 3 isolates (6.25%) were positive for OXA-48, 4 isolates (8.33%) positive for OXA-199,139, 4 isolates (8.33%) positive for OXA-23, 7 isolates (14.58%) positive for OXA- 2, 4 isolates (8.33%) were OXA- 10 producers, 3 isolates (6.25%) were OXA-51 producers, and 4 isolates (8.33%) positive for OXA-58 were observed. IMP3, 34 and IMPexpt-3, 16, 31, 35 were detected in 11 isolates (11%) and 10 isolates (20.83%), respectively (Tables 2, 3; Figure 1).
- 3. Relationship between Variants
- There was a significant correlation between antibiotic resistance and virulence factors (Tables 4 and 5). In addition, there was a significant relationship between the presence of AmpC enzymes and OXA and IMP genes. AmpC producing P. aeruginosa strains were significantly associated with resistance to cefoxitin, cefpodoxime, cefotaxime, ceftazidime, ciprofloxacin, colistin, azteronam, and ceftriaxone (p < 0.05), as determined using SPSS16 software.
- 4. Results of gene sequencing
- All our PCR products were assigned to the microbial genome using the Basic Local Alignment Search Tool (BLAST) and showed the same DNA sequences, therefore all PCR assay results were confirmed.
Results
- The relationship between antibiotic resistance patterns and the presence of virulence factors has been widely studied. Other factors may influence the activity of virulence factors in P. aeruginosa, including gender, type of clinical specimen, and even the activity of certain antibiotic resistance enzymes [12,13]. In this study, the highest frequency of virulence strains was isolated from female patients. The role of gender in the exacerbation of infections caused by P. aeruginosa were examined in this study. As previously mentioned in different studies from Iran, Canada and United States, the severity of infection may be affected by gender [14,15]. In accordance with studies in Iran, Pakistan, Sudan, Italy, and China, our data demonstrated high resistance to ceftriaxone and cefotaxime, and highest susceptibility to carbapenems. It seems that selection pressure occurs when there is exposure to microorganisms due to increased consumption of cephalosporin in healthcare settings and the community, resulting in enhanced resistance [16–19].
- Four isolates in our study were found to harbor both lasA and lasB, with 5 isolates carrying the lasR gene. These isolates included 4 isolates from the same patient. Therefore, previous assertions that these genes are mutually exclusive in clinical isolates were contradicted in this study, as also noted in a number of previous studies [12]. The frequency of pathogenic genes in our study differs from the results showing lasA, lasB and lasR genes being be present in a clinical specimen, but the effect of these genes on the abundance of each other has also been previously shown [11,12,14].
- One of the main reasons for the increased activity of P. aeruginosa in women may be the imbalances in the body’s hormonal system. Estrogen intensifies inflammation due to increases in neutrophils and other white blood cells which results in an elevated level of biofilm formation in P. aeruginosa strains and consequently antibiotic resistance [13]. Menstruation in women causes iron deficiency in the body. P. aeruginosa uses 2 siderophores for transferring trivalent iron. In the studies by Oglesby et al [13] and Tomaras et al [15], the effects of presence and absence of iron in the body of the patients were investigated, showing a significant relationship between the presence of iron and antibiotic resistance in P. aeruginosa. It was also reported that the bacterium was detected in the presence of iron and could increase its pathogenic activity. Although, the prevalence of infections in males was reported to be higher than females in some studies from Canada and Belgium [20,21].
- Variables such as antibiotic resistance, temperature variations, gene mutations, changes in the position of genes from chromosomal to plasmid, and the presence of certain elements can affect the appearance of virulence factors [15]. In our study, there was a significant relationship between antibiotic resistance and virulence factors. In a study by Schroeder et al [7], one of the bacterial resistance factors was antibiotic alteration of external structure and the production of certain specific proteins. In this way, the bacteria, when exposed to high concentrations of antibiotics, also changed the activity of their regulatory systems due to their adaptation, which produced biofilms and initiated QS activity. QS activates 2 component systems, and this triggers the occurrence of high levels of resistance in the bacteria [7].
- Meanwhile, virulence factors can affect some beta-lactamase enzymes. The study on AmpC type beta-lactamase began in the late 1970s. AmpC enzymes, which are often inducible by beta-lactams, are coded by chromosomal genes and are also found in many strains of P. aeruginosa [22]. Extended resistance to a wide range of antibiotics and even carbapenems may be developed in AmpC producer strains of P. aeruginosa. In the current study, more than half of isolates were AmpC producers with a high prevalence of resistance to cefoxitin and ciprofloxacin. Many studies in Malaysia, USA, Saudi Arabia and Iran, have demonstrated that induced phenotype of cefoxitin and ciprofloxacin in AmpC producing P. aeruginosa was more frequent than for other antibiotics. Antibiotic resistance patterns for P. aeruginosa strains could be influenced by various factors including gender, age and place of residence, so that, in this study, 72.23% of isolates were collected from females. This difference might be due to hormone levels in women affecting mutation of regulators of Class C ambler classification. As age increases, immune systems may become dysfunctional, that may lead to resistance to different antibiotics [11].
- In the current study, a meaningful relationship between strains expressing IMP and OXA genes and AmpC producer strains is observed, however, IMP and OXA genes were not frequently detected. In a study from Taiwan in 2005, OXA- type ESBLs were reported in 3.5% of cases, and the most prevalent type was OXA-17 [23]. Furthermore, in a number of studies performed to examine OXA gene prevalence, less than 10% of ESBLs producer strains in P. aeruginosa were shown to be of the OXA type [24–26]. Serine functions in the active site of beta-lactamases leads to changes in AmpC strains. In other words, AmpC mutated regulators could affect other resistance groups. Furthermore, function of these strains causes emergence of multidrug resistant strains. To illustrate, subtypes of OXA gene clusters like OXA-162, have been isolated from AmpC producer strains. As described by Rafiee et al [27] P. aeruginosa AmpC producers show 11.9% ESBLs, with MBLs produced simultaneously.
- AmpC activity in gram negative bacteria results in resistance to carbapenems. In this study, antibiotic resistance patterns demonstrated that AmpC could influence genotypic and phenotypic resistance patterns in a manner that may lead to increased IMP gene activity. All IMP genes were detected in AmpC producing P. aeruginosa. Although some studies mention no relationship between genotypic and phenotypic resistance in AmpC producer strains, there was no evidence for this in the current study [28].
- The present study showed that there was a significant relationship between the presence of beta-lactamase genes and AmpC enzymes. The genes responsible for the resistance of β-lactamase-resistant enzymes, such as AmpC and ESBLs, are in some cases transported onto the plasmid. This causes the transfer of genes between different gram-negative bacteria and causes the creation of resistant and pathogenic strains. In a study by Logan et al [29], genes located on plasmid were shown to be one of the most important reasons for the development of Enterobacteriaceae via the enzyme AmpC and ESBLs. However, ESBLs and AmpC can confer carbapenem resistance when associated with alteration or loss of porins, a family of proteins on the outer membrane of gram-negative bacteria [30].
- The results of this study showed that the genes responsible for resistance to various antibiotics were more frequent in isolates with a high pathogenicity. However, the prevalence of these isolates was highest in burn wounds and urine specimens. The presence of strains with QS element genes in burn wounds and urinary tract infections was due to the fact that bacteria increase their biofilm production and can resist external and environmental factors. As mentioned in studies by Heydari et al [31], Turk [32] and Ellappan et al [33] biofilm producer strains of P. aeruginosa indicated a high level resistance to ESBLs, MBLs and carbapenemases. In other words, P. aeruginosa has a high resistance to many antimicrobial and antiseptic agents. In addition, the widespread use of antibiotics in recent years has made the bacterium resistant to broad-spectrum antibiotics from various antibiotic groups.
- The results of this study showed that the samples obtained from burn and discharge wounds had the highest genetic distribution. Also, infections caused by catheter and urinary tract infections also had a remarkable distribution for ampC genes. Cornut et al [34] showed that samples that have been exposed to infections caused by high levels of antibiotics, are more resistant to antibiotics and treatment than other bacterial infections. Thus, this relationship indicates that the detection of strains carrying the enzyme AmpC can be prevented. Therefore, it is suggested that in subsequent studies, the measurement of the level of elastase (lasB) and serine protease (lasA) enzymes should be measured.
Discussion
- The association between antibiotic resistance and virulence factors may play a significant role in outbreaks of P. aeruginosa infections. Therefore, the presence of virulence factors in P. aeruginosa may cause some changes in beta-lactam resistance, so that QS and biofilm provide a basis for resistance to beta-lactamase enzymes. In addition, the activity and presence of certain enzymes such as elastase (lasB) and serine protease (lasA) in strains with resistance should be considered.
Conclusion
-
Acknowledgements
- The authors of this article are grateful to Hamadan University of Medical Sciences for their financial support in conducting research.
Acknowledgments
-
Conflicts of Interest
No potential conflicts of interest relevant to this article.
Article information
- 1. Voulgari E, Poulou A, Dimitroulia E, et al. Emergence of OXA-162 Carbapenemase- and DHA-1 AmpC Cephalosporinase-Producing Sequence Type 11 Klebsiella pneumoniae Causing Community-Onset Infection in Greece. Antimicrob Agents Chemother 2016;60(3). 1852−54. PMID: 10.1128/AAC.01514-15.Article
- 2. Easwaran S, Yerat R, Ramaswamy R. A study on detection of extended-spectrum beta-lactamases (ESBLs) and comparison of various phenotypic methods of AmpC detection in Pseudomonas aeruginosa from various clinical isolates in a tertiary care teaching hospital. Muller J Med Sci Res 2016;7(1). 35−9. PMID: 10.4103/0975-9727.174610.Article
- 3. Tam VH, Schilling AN, LaRocco MT, et al. Prevalence of AmpC over–expression in bloodstream isolates of Pseudomonas aeruginosa. Clin Microbiol Infect 2007;13(4). 413−8. PMID: 10.1111/j.1469-0691.2006.01674.x. PMID: 17359326.ArticlePubMed
- 4. Li Y, Li Q, Du Y, et al. Prevalence of Plasmid-Mediated AmpC β-Lactamases in a Chinese University Hospital from 2003 to 2005: First Report of CMY-2-Type AmpC β-Lactamase Resistance in China. J Clin Microbiol 2008;46(4). 1317−21. PMID: 10.1128/JCM.00073-07. PMID: 18305137. PMID: 2292923.ArticlePubMed
- 5. Khalil MA, Ibrahim Sonbol F, Mohamed AF, Ali SS. Comparative study of virulence factors among ESbetaL-producing and nonproducing Pseudomonas aeruginosa clinical isolates. Turk J Med Sci 2015;45(1). 60−9. PMID: 10.3906/sag-1311-102. PMID: 25790531.ArticlePubMed
- 6. El-Shaer S, Shaaban M, Barwa R, Hassan R. Control of quorum sensing and virulence factors of Pseudomonas aeruginosa using phenylalanine arginyl beta-naphthylamide. J Med Microbiol 2016;65(10). 1194−204. PMID: 10.1099/jmm.0.000327. PMID: 27498852.ArticlePubMed
- 7. Schroeder M, Brooks BD, Brooks AE. The Complex Relationship between Virulence and Antibiotic Resistance. Genes 2017;8:39PMID: 10.3390/genes8010039. PMID: 5295033.ArticlePubMedPMC
- 8. Tahmasebi H, Yousef Alikhani M, Dehbashi S, Arabestani MR. Investigation of the relationship between the presence of chromosomal and plasmid-encoded AmpC genes and type of clinical specimen in pseudomonas aeruginosa. J Babol Univ Med Sci 2018;20(3). 36−43.
- 9. Performance standards for antimicrobial susceptibility testing; twenty- fourth Informational Supplement M100-S24. Wayne (PA): CLSI; 2014.
- 10. Mlynarcik P, Roderova M, Kolar M. Primer Evaluation for PCR and its Application for Detection of Carbapenemases in Enterobacteriaceae. Jundishapur J Microbiol 2016;9(1). e 29314PMID: 10.5812/jjm.29314.Article
- 11. Fazeli N, Momtaz H. Virulence Gene Profiles of Multidrug-Resistant Pseudomonas aeruginosa Isolated From Iranian Hospital Infections. Iranian Red Crescent Med J 2014;16(10). e15722PMID: 10.5812/ircmj.15722.Article
- 12. Pereira SG, Rosa AC, Ferreira AS, et al. Virulence factors and infection ability of Pseudomonas aeruginosa isolates from a hydropathic facility and respiratory infections. J Applied Microbiol 2014;116(5). 1359−68. PMID: 10.1111/jam.12463.Article
- 13. Oglesby-Sherrouse AG, Djapgne L, Nguyen AT, Vasil AI, Vasil ML. The complex interplay of iron, biofilm formation, and mucoidy affecting antimicrobial resistance of Pseudomonas aeruginosa. Pathog Dis 2014;70(3). 307−20. PMID: 10.1111/2049-632X.12132. PMID: 24436170. PMID: 4084922.ArticlePubMedPDF
- 14. Toder DS, Ferrell SJ, Nezezon JL, Rust L, Iglewski BH. lasA and lasB genes of Pseudomonas aeruginosa: analysis of transcription and gene product activity. Infect Immun 1994;62(4). 1320−7. PMID: 8132339. PMID: 186279.ArticlePubMedPMC
- 15. Tomaras AP, Crandon JL, McPherson CJ, et al. Adaptation-Based Resistance to Siderophore-Conjugated Antibacterial Agents by Pseudomonas aeruginosa. Antimicrob Agents Chemother 2013;57(9). 4197−207. PMID: 10.1128/AAC.00629-13. PMID: 23774440. PMID: 3754284.ArticlePubMedPMC
- 16. Bonaventura G, Picciani C, Spedicato I, Piccolomini R. E-test method for detecting antibiotic synergy against Pseudomonas aeruginosa from neutropenic patients: A cost-effective approach. 2004. pp 263−72.
- 17. Ullah A, Javeid I, Khalid K, Hanif M, Sahrish J. In-vitro comparative Study Of Cefoperazone, Ceftazidime, Ceftizoxime, Cefotaxime, Ceftriaxone And Cefixime Against Pseudomonas Aeruginosa. Int Res J Pharm 2013;4(1). 135−7.Article
- 18. Chen H, Wang Z, Li H, et al. In Vitro Analysis of Activities of 16 Antimicrobial Agents against Gram-Negative Bacteria from Six Teaching Hospitals in China. Japanese J Infect Dis 2015;68(4). 263−7. PMID: 10.7883/yoken.JJID.2014.202.Article
- 19. Saeed HA, Awad AA. Susceptibility of pseudomonas aeruginosa to third generation cephalosporins. J Sci Tech 2009;10(2). 195−200.
- 20. Parkins MD, Pitout JD, Church DL, Conly JM, Laupland KB. Treatment of infections caused by metallo-beta-lactamase-producing Pseudomonas aeruginosa in the Calgary Health Region. Clinical microbiology and infection : the official publication of the European Society of Clinical Microbiology and Infectious Diseases. Eur J Clin Microbiol Infect Dis 2007;13(2). 199−202. PMID: 10.1111/j.1469-0691.2006.01591.x.Article
- 21. Yusuf E, Van Herendael B, Verbrugghe W, et al. Emergence of antimicrobial resistance to Pseudomonas aeruginosa in the intensive care unit: association with the duration of antibiotic exposure and mode of administration. Ann Intensive Care 2017;7(1). 72PMID: 10.1186/s13613-017-0296-z. PMID: 28664350. PMID: 5491427.ArticlePubMedPMCPDF
- 22. Nilsson O, Borjesson S, Landen A, Bengtsson B. Vertical transmission of Escherichia coli carrying plasmid-mediated AmpC (pAmpC) through the broiler production pyramid. J Antimicrob Chemother 2014;69(6). 1497−500. PMID: 10.1093/jac/dku030. PMID: 24550380.ArticlePubMedPDF
- 23. Yan JJ, Tsai SH, Chuang CL, Wu JJ. OXA-type beta-lactamases among extended-spectrum cephalosporin-resistant Pseudomonas aeruginosa isolates in a university hospital in southern Taiwan. J Microbiol J Immunol Infec 2006;39(2). 130−4.
- 24. Liu C-P, Chen T-L, Wang N-Y, Chow S-F, Lin J-C, Yan T-R. Detection of Pseudomonas aeruginosa isolates carrying the blaOXA-142 extended-spectrum β-lactamase gene in Taiwan. J Microbiol J Immunol Infec 2017;50(1). 68−74. PMID: 10.1016/j.jmii.2014.11.017.Article
- 25. Laudy AE, Rog P, Smolinska-Krol K, et al. Prevalence of ESBL-producing Pseudomonas aeruginosa isolates in Warsaw, Poland, detected by various phenotypic and genotypic methods. PloS one 2017;12(6). e0180121PMID: 10.1371/journal.pone.0180121. PMID: 28658322. PMID: 5489192.ArticlePubMedPMC
- 26. Ullah W, Qasim M, Rahman H, et al. CTX-M-15 and OXA-10 beta lactamases in multi drug resistant Pseudomonas aeruginosa: First report from Pakistan. Microb Pathog 2017;105:240−4. PMID: 10.1016/j.micpath.2017.02.039. PMID: 28258003.ArticlePubMed
- 27. Rafiee R, Eftekhar F, Tabatabaei SA, Minaee Tehrani D. Prevalence of Extended-Spectrum and Metallo β-Lactamase Production in AmpC β-Lactamase Producing Pseudomonas aeruginosa Isolates From Burns. Jundishapur J Microbiol 2014;7(9). e16436PMID: 10.5812/jjm.16436. PMID: 25485066. PMID: 4255381.ArticlePubMedPMC
- 28. Geyer CN, Hanson ND. Multiplex high-resolution melting analysis as a diagnostic tool for detection of plasmid-mediated AmpC beta-lactamase genes. J Clin Microbiol 2014;52(4). 1262−5. PMID: 10.1128/JCM.00214-14. PMID: 24478414. PMID: 3993522.ArticlePubMedPMC
- 29. Logan LK, Renschler JP, Gandra S, et al. Carbapenem-Resistant Enterobacteriaceae in Children, United States, 1999–2012. Emerg Infec Dis 2015;21(11). 2014−21. PMID: 10.3201/eid2111.150548.Article
- 30. Pitout JD, Laupland KB. Extended-spectrum beta-lactamase-producing Enterobacteriaceae: an emerging public-health concern. Lancet Infect Dis 2008;8(3). 159−66. PMID: 10.1016/S1473-3099(08)70041-0. PMID: 18291338.ArticlePubMed
- 31. Heydari S, Eftekhar F. Biofilm Formation and β-Lactamase Production in Burn Isolates of Pseudomonas aeruginosa. Jundishapur J Microbiol 2015;8(3). e15514PMID: 10.5812/jjm.15514. PMID: 25964848. PMID: 4417555.ArticlePubMedPMC
- 32. Turk M. Carbapenem resistant pseudomonas aeruginosa: oprd downregulation and the types of metallo-β-lactamases produced. University of Balamand; 2011. pp 56−62.
- 33. Ellappan K, Belgode Narasimha H, Kumar S. Coexistence of multidrug resistance mechanisms and virulence genes in carbapenem-resistant Pseudomonas aeruginosa strains from a tertiary care hospital in South India. J Glob Antimicrob Resist 2018;12:37−43. PMID: 10.1016/j.jgar.2017.08.018.ArticlePubMed
- 34. Cornut PL, Thuret G, Creuzot-Garcher C, et al. Relationship between baseline clinical data and microbiologic spectrum in 100 patients with acute postcataract endophthalmitis. Retina 2012;32(3). 549−57. PMID: 10.1097/IAE.0b013e3182205996.ArticlePubMed
References
Figure 1Results of IMP and OXA genes. (A) OXA-23 (736bp), IMP-27 (169 bp), OXA-10 (453bp) and OXA-2 (568 bp). Third well: Positive control, sixth well: Negative control. (B) OXA-19, 37 (597 bp), OXA-51 (435 bp), IMP (183 bp). Second well: positive control, First well: negative control. (C) OXA-58 (740 bp), IMP-31 (523 bp), Column 2: positive control, column 1: negative control.
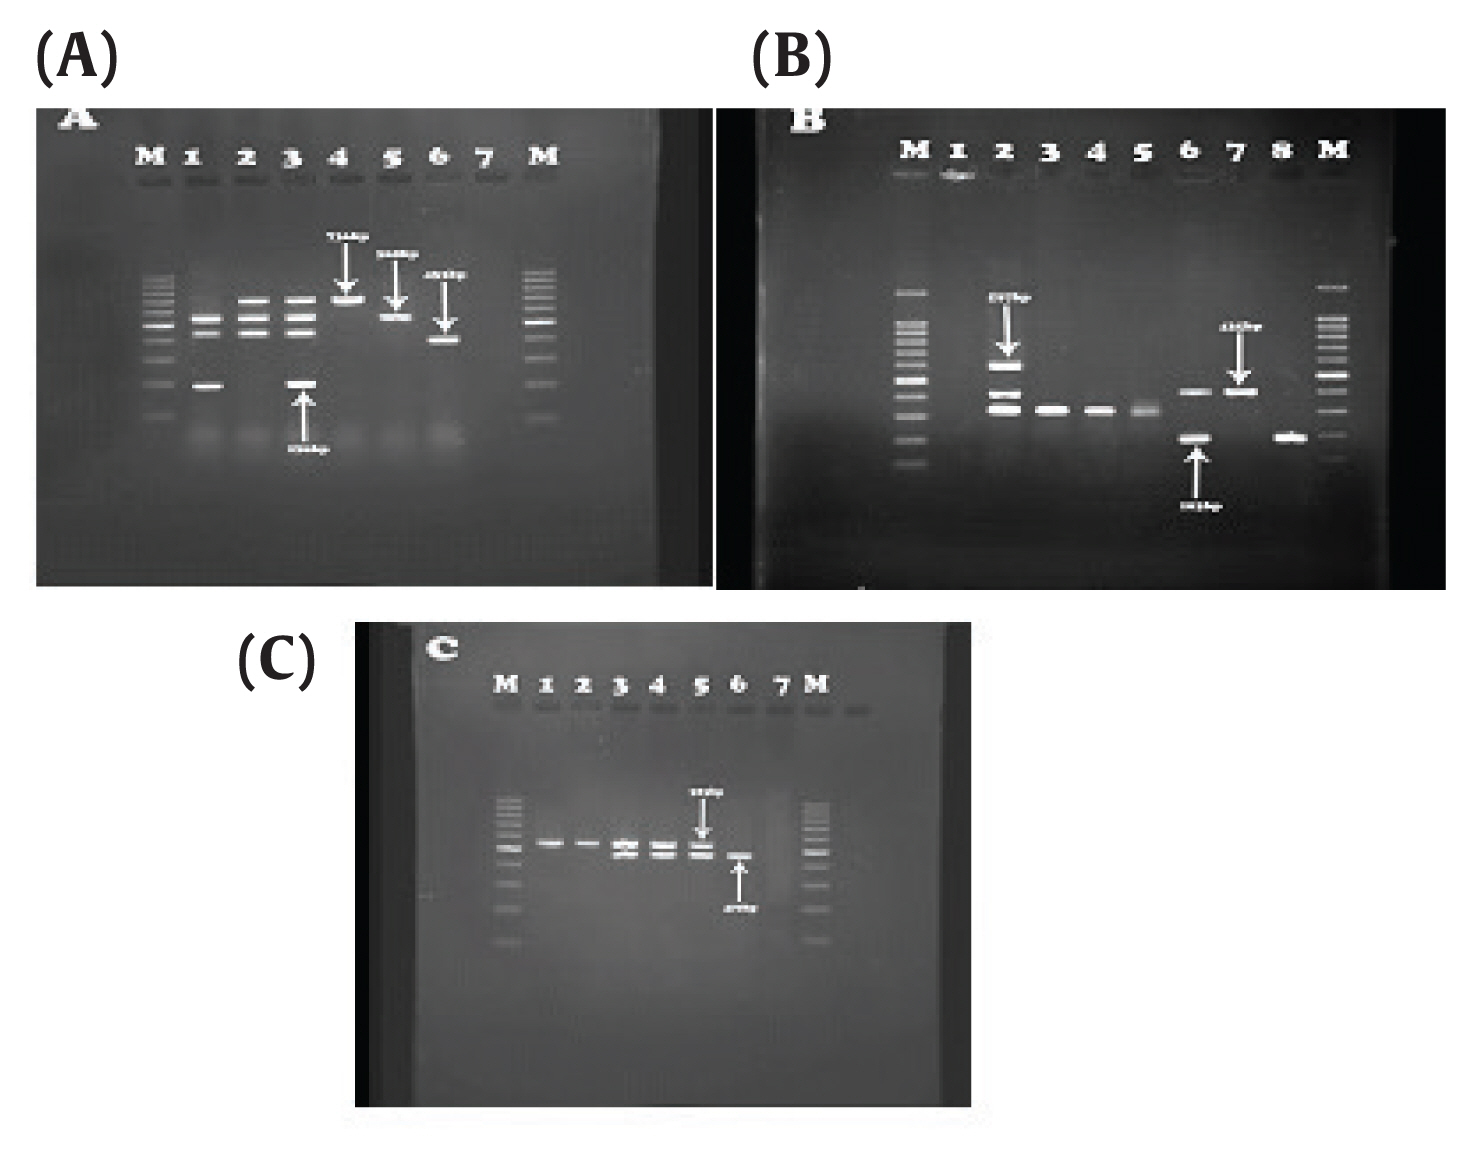
Table 1MIC antimicrobial resistance pattern in clinical isolates of P. aeruginosa with or non.
Table 2Distribution of antimicrobial resistance and virulence factors genes in clinical isolates of P. aeruginosa AmpC.
Table 3Distribution of antimicrobial resistance and virulence factors genes in clinical isolates of P. aeruginosa with non-AmpC.
Table 4Analysis of variables significantly associated with virulence factors, P. aeruginosa with antimicrobial resistance and P. aeruginosa without antimicrobial resistance.
| Variable | Level | P. aeruginosa with antimicrobial resistance | P. aeruginosa without antimicrobial resistance | p |
|---|---|---|---|---|
| Presence of virulence genes | ||||
| Presence of lasR | 0* | 2 | 18 | |
| 1* | 16 | 12 | 0.012 | |
| Presence of lasB | 0 | 4 | 25 | |
| 1 | 14 | 5 | 0.006 | |
| Presence of lasA | 0 | 7 | 23 | |
| 1 | 11 | 7 | 0.045 |
Table 5Analysis of variables significantly associated beta-lactamase resistance, virulence factor genes and AmpC- P. aeruginosa and non-AmpC-P. aeruginosa.
| Variable | Level | AmpC- P. aeruginosa | non-AmpC- P. aeruginosa | p |
|---|---|---|---|---|
| Presence of Antibiotic Resistance and Virulence Factors genes | ||||
| Presence of blaOX-2 | 0* | 41 | 57 | |
| 1* | 7 | 0 | 0.001 | |
| Presence of blaOX-10 | 0 | 44 | 57 | |
| 1 | 4 | 0 | 0.006 | |
| Presence of blaOX-23 | 0 | 44 | 57 | |
| 1 | 4 | 0 | 0.006 | |
| Presence of blaOX-27 | 0 | 39 | 57 | |
| 1 | 9 | 0 | 0.008 | |
| Presence of blaOX-48 | 0 | 41 | 57 | |
| 1 | 7 | 0 | 0.001 | |
| Presence of blaOX-51 | 0 | 41 | 57 | |
| 1 | 7 | 0 | 0.001 | |
| Presence of blaOX-58 | 0 | 44 | 57 | |
| 1 | 4 | 0 | 0.006 | |
| Presence of blaOX-199 | 0 | 44 | 57 | |
| 1 | 4 | 0 | 0.006 | |
| Presence of blaIMP-3,34 | 0 | 37 | 52 | |
| 1 | 11 | 5 | 0.04 | |
| Presence of blaIMP-27 | 0 | 44 | 57 | |
| 1 | 4 | 0 | 0.006 | |
| Presence of blaIMP-var | 0 | 42 | 53 | |
| 1 | 6 | 4 | 0. 45 | |
| Presence of lasR | 0 | 36 | 51 | |
| 1 | 12 | 6 | 0.05 | |
| Presence of lasB | 0 | 34 | 52 | |
| 1 | 14 | 5 | 0.006 | |
| Presence of lasA | 0 | 40 | 37 | |
| 1 | 8 | 20 | 0.04 |
Figure & Data
References
Citations
Citations to this article as recorded by 
- Comparative bacteriome and antibiotic resistome analysis of water and sediment of the Ganga River of India
Ankita Srivastava, Digvijay Verma
World Journal of Microbiology and Biotechnology.2023;[Epub] CrossRef - Prevalence of different virulence factors and their association with antimicrobial resistance among Pseudomonas aeruginosa clinical isolates from Egypt
Eva A. Edward, Marwa R. El Shehawy, Alaa Abouelfetouh, Elsayed Aboulmagd
BMC Microbiology.2023;[Epub] CrossRef - Molecular epidemiology and collaboration of siderophore-based iron acquisition with surface adhesion in hypervirulent Pseudomonas aeruginosa isolates from wound infections
Hamed Tahmasebi, Sanaz Dehbashi, Mona Nasaj, Mohammad Reza Arabestani
Scientific Reports.2022;[Epub] CrossRef - Decoding Genetic Features and Antimicrobial Susceptibility of Pseudomonas aeruginosa Strains Isolated from Bloodstream Infections
Tomasz Bogiel, Dagmara Depka, Mateusz Rzepka, Agnieszka Mikucka
International Journal of Molecular Sciences.2022; 23(16): 9208. CrossRef - Prevalence of the Genes Associated with Biofilm and Toxins Synthesis amongst the Pseudomonas aeruginosa Clinical Strains
Tomasz Bogiel, Dagmara Depka, Mateusz Rzepka, Joanna Kwiecińska-Piróg, Eugenia Gospodarek-Komkowska
Antibiotics.2021; 10(3): 241. CrossRef - A Comprehensive Study of the Relationship between the Production of β-Lactamase Enzymes and Iron/Siderophore Uptake Regulatory Genes in Clinical Isolates of Acinetobacter baumannii
Mahyar Porbaran, Hamed Tahmasebi, MohammadReza Arabestani, Joseph Falkinham
International Journal of Microbiology.2021; 2021: 1. CrossRef - Regulation of virulence and β-lactamase gene expression in Staphylococcus aureus isolates: cooperation of two-component systems in bloodstream superbugs
Sanaz Dehbashi, Hamed Tahmasebi, Behrouz Zeyni, Mohammad Reza Arabestani
BMC Microbiology.2021;[Epub] CrossRef -
New approach to identify colistin‐resistant
Pseudomonas aeruginosa
by high‐resolution melting curve analysis assay
H. Tahmasebi, S. Dehbashi, M.R. Arabestani
Letters in Applied Microbiology.2020; 70(4): 290. CrossRef - Resistant Pseudomonas aeruginosa carrying virulence genes in hospitalized patients with urinary tract infection from Sanandaj, west of Iran
Safoura Derakhshan, Aslan Hosseinzadeh
Gene Reports.2020; 20: 100675. CrossRef - Prevalence and molecular typing of Metallo-β-lactamase-producing Pseudomonas aeruginosa with adhesion factors: A descriptive analysis of burn wounds isolates from Iran
Hamed Tahmasebi, Sanaz Dehbashi, Mohammad Yousef Alikhani, Mahyar Porbaran, Mohammad Reza Arabestani
Gene Reports.2020; 21: 100853. CrossRef - Co-harboring of mcr-1 and β-lactamase genes in Pseudomonas aeruginosa by high-resolution melting curve analysis (HRMA): Molecular typing of superbug strains in bloodstream infections (BSI)
Hamed Tahmasebi, Sanaz Dehbashi, Mohammad Reza Arabestani
Infection, Genetics and Evolution.2020; 85: 104518. CrossRef - Relationship between Biofilm Regulating Operons and Various Β-Lactamase Enzymes: Analysis of the Clinical Features of Infections caused by Non-Fermentative Gram-Negative Bacilli (Nfgnb) from Iran
Mahyar Porbaran, Reza Habibipour
Journal of Pure and Applied Microbiology.2020; 14(3): 1723. CrossRef - Carbapenem-Resistant Pseudomonas aeruginosa Strains-Distribution of the Essential Enzymatic Virulence Factors Genes
Tomasz Bogiel, Małgorzata Prażyńska, Joanna Kwiecińska-Piróg, Agnieszka Mikucka, Eugenia Gospodarek-Komkowska
Antibiotics.2020; 10(1): 8. CrossRef - Biofilm Formation and β-lactamase Enzymes: A Synergism Activity in Acinetobacter baumannii Isolated from Wound Infection
Mahyar Porbaran, Reza Habibipour
Journal of Advances in Medical and Biomedical Rese.2019; 27(125): 34. CrossRef
 PubReader
 Cite
Cite