
Articles
- Page Path
- HOME > Osong Public Health Res Perspect > Volume 7(3); 2016 > Article
-
Original Article
The Mediating Role of Organizational Learning in the Relationship of Organizational Intelligence and Organizational Agility - Mohammad Amin Bahramia, Mohammad Mehdi Kianib, Raziye Montazeralfaraja, Hossein Fallah Zadehc, Morteza Mohammad Zadehc
-
Osong Public Health and Research Perspectives 2016;7(3):190-196.
DOI: https://doi.org/10.1016/j.phrp.2016.04.007
Published online: May 6, 2016
aHospital Management Research Center, Shahid Sadoughi Hospital, Yazd, Iran
bDepartment of Health Services Administration, Shahid Sadoughi University of Medical Sciences, Yazd, Iran
cDepartment of Biostatistics and Epidemiology, Shahid Sadoughi University of Medical Sciences, Yazd, Iran
- ∗Corresponding author. mehdi.kiyan92@gmail.com
• Received: April 5, 2016 • Revised: April 15, 2016 • Accepted: April 20, 2016
Copyright © 2016 Korea Centers for Disease Control and Prevention. Published by Elsevier Korea LLC.
This is an open access article under the CC BY-NC-ND license (http://creativecommons.org/licenses/by-nc-nd/4.0/).
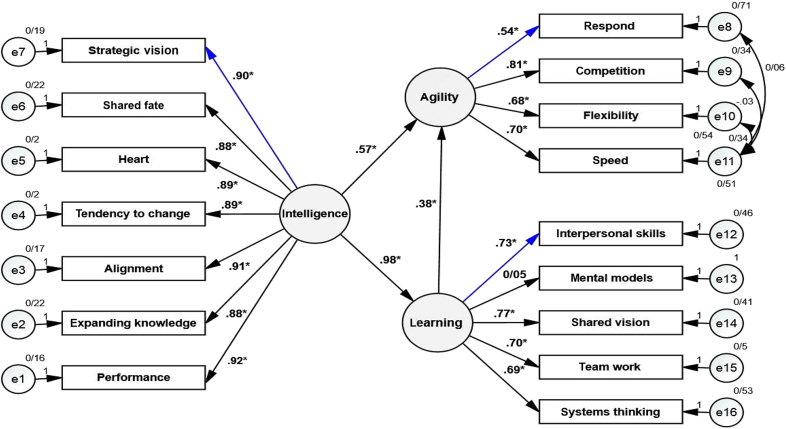
Figure & Data
References
Citations
Citations to this article as recorded by 
- Comparing Promotability Outlooks: Industry Professionals vs. MBA Student Perspectives
Vicente E. Montaño, Myrna S. Viado
European Journal of Contemporary Education and E-L.2024; 2(1): 112. CrossRef - Survey-Based Studies of the Agility Construct in the Healthcare Sector: A Systematic Literature Review
Jorge Flavio Sarmiento Falla, Waldemar Karwowski
Applied Sciences.2024; 14(3): 1097. CrossRef - Structural Equation Modeling: Effects of Master Adaptive Learner and Clinical Learning Environment Attributes on Career Satisfaction and Intention to Stay
Raine Osborne, Chloe Bailey, Daniel Dinsmore, Emily Lyter, Judy Burnfield, Holly Medearis, Amanda Roura
Physical Therapy.2024;[Epub] CrossRef - Social Media Engagement, Organizational Agility and Digitalization Strategic Plan to Improve SMEs’ Performance
Hasan Abdul Rozak, Ardian Adhiatma, Olivia Fachrunnisa, Tina Rahayu
IEEE Transactions on Engineering Management.2023; 70(11): 3766. CrossRef - Differential impact of work-based learning on employee agility, ambidexterity and proactive goal generation
Charles Hanu, Hayford Amegbe, Monica Dede Tekyi Ansah Yawson, Philip Mensah
Journal of Workplace Learning.2023; 35(1): 92. CrossRef - Understanding the role of organizational agility in the context of digital transformation: an integrative literature review
Cheng Gong, Vincent Ribiere
VINE Journal of Information and Knowledge Manageme.2023;[Epub] CrossRef - Learning Organization and Innovation Coaching Model Organizational Agility Approach: A Case Study
Samet GÜRSEV
European Journal of Science and Technology.2023;[Epub] CrossRef - Sağlık Kurumlarında Örgütsel Çeviklik: Kavramsal Bir Çerçeve
Pelinsu Buket DOĞANYİĞİT
Türkiye Sağlık Bilimleri ve Araştırmaları Dergisi.2023; 6(2): 66. CrossRef - Does learning culture enhance organizational performance? A serial mediator with knowledge management and organizational intelligence
Jamini Ranjan Meher, Rohita Kumar Mishra, Rashmi Ranjan Panigrahi, Gokulananda Patel, Lalatendu Kesari Jena
Knowledge Management Research & Practice.2023; : 1. CrossRef - Teachers' intrinsic and extrinsic motivation as mediators of the effect of principals' perceived distributed leadership on organizational learning capability
Izhak Berkovich, Tahani Hassan
International Journal of Educational Management.2023; 37(6/7): 1552. CrossRef - SAĞLIK KURULUŞLARINDA BİLGİ SİSTEMLERİ KULLANIMININ ÖRGÜTSEL ÇEVİKLİK VE ÇALIŞAN MEMNUNİYETİ ÜZERİNE ETKİSİ
Mustafa ALTINTAŞ, Musa ÖZATA
Anadolu Üniversitesi İktisadi ve İdari Bilimler Fa.2023; 24(4): 333. CrossRef - Why do I contribute to organizational learning when I am ostracized? A moderated mediation analysis
Muhammad Kashif Imran, Jawad Iqbal, Tehreem Fatima, Syed Muhammad Javed Iqbal, Warda Najeeb Jamal, Muhammad Shahid Nawaz
Journal of Management & Organization.2022; 28(2): 261. CrossRef - Examining the role of knowledge sharing on employee performance with a mediating effect of organizational learning
Jamini Ranjan Meher, Rohita Kumar Mishra
VINE Journal of Information and Knowledge Manageme.2022; 52(2): 205. CrossRef - Influence of workforce agility on crisis management: Role of job characteristics and higher administrative support in public administration
Pradeep Kumar Raut, Jyoti Ranjan Das, Jyotiranjan Gochhayat, Kalyan Prasad Das
Materials Today: Proceedings.2022; 61: 647. CrossRef - Organisational agility, environmental knowledge and green product success
Jose Rabal-Conesa, Daniel Jiménez-Jiménez, Micaela Martínez-Costa
Journal of Knowledge Management.2022; 26(9): 2440. CrossRef - Towards Examining the Link Between Workplace Spirituality and Workforce Agility: Exploring Higher Educational Institutions
Imran Saeed, Jawad Khan, Muhammad Zada, Rezwan Ullah, Alejandro Vega-Muñoz, Nicolás Contreras-Barraza
Psychology Research and Behavior Management.2022; Volume 15: 31. CrossRef - A qualitative analysis and a conceptual model for organizational stupidity
Samaneh Karimi-Ghartemani, Naser Khani, Ali Nasr Isfahani
Journal of Organizational Change Management.2022; 35(3): 441. CrossRef - ENDÜSTRİYEL ÇEVİK İŞLETME İÇİN DENGELENMİŞ BAŞARI GÖSTERGELERİ
Alperen Ekrem ÇELİKDİN
Çukurova Üniversitesi Sosyal Bilimler Enstitüsü De.2022; 31(1): 38. CrossRef - Organizational learning culture and business intelligence systems of health-care organizations in an emerging economy
Md. Shamsul Arefin, Md. Rakibul Hoque, Tareq Rasul
Journal of Knowledge Management.2021; 25(3): 573. CrossRef - Investigating the role of social networking technology on the organizational agility: a structural equation modeling approach
Shadi Ahmadi, Mohammad Javad Ershadi
Journal of Advances in Management Research.2021; 18(4): 568. CrossRef - Mediating Effect of Organizational Learning Capacity on the Relationship between Relational Embeddedness and Innovation Performance in Freight Logistics Service
Pengxia Bai, Qunqi Wu, Qian Li, Chenlei Xue, Lei Zhang, Zhihan Lv
Complexity.2021; 2021: 1. CrossRef - Creating a Work Environment Conducive to Organizational Learning
Bret Lyman, Marisa E. Biddulph, V. Grace Hopper, Morgan K. Horton, Camille R. Mendon, Kylie C. Thorum, Emily L. Smith
The Journal of Continuing Education in Nursing.2021; 52(6): 281. CrossRef - Organizational Intelligence and Market Expansion in Jordanian Pharmaceutical Companies
Najm A. Najm, Amany A. H. Alfaqih
Organizations and Markets in Emerging Economies.2021; 12(1): 222. CrossRef - Modeling organizational intelligence, learning, forgetting and agility using structural equation model approaches in Shiraz University of Medical Sciences Hospitals
Zahra Kavosi, Sajad Delavari, Mohammad Mehdi Kiani, Peivand Bastani, Mohebat Vali, Marzieh Salehi
BMC Research Notes.2021;[Epub] CrossRef - KESAN INTEGRASI KELAKUAN KUMPULAN PENGURUSAN ATASAN KE ATAS KETANGKASAN ORGANISASI DI MALAYSIA: KAPASITI PENYERAPAN SEBAGAI PEMBOLEH UBAH PENGANTARA (The Effects of Top Management Team Behavioural Integration on Organisational Agility in Malaysia: Absorp
Khairul Naziya Kasim, Sofiah Md Auzair, Amizawati Mohd Amir, Nor Liza Abdullah
International Journal of Management Studies.2021;[Epub] CrossRef - Estudio bibliométrico de la relación del Cambio Organizacional con el Aprendizaje Organizacional
Luis Alberto Bellon Álvarez, Francisco Javier López Cerpa, Margarita Isabel Islas Villanueva
Vinculatégica.2021;[Epub] CrossRef - Dynamic talent management capabilities and organizational agility—A qualitative exploration
Katharina Harsch, Marion Festing
Human Resource Management.2020; 59(1): 43. CrossRef - Study of the impact mechanism of inter-organizational learning on alliance performance—with relationship capital as the mediator
Lu Shan, Li Dan, Yu-mou Qiu
Neural Computing and Applications.2020; 32(1): 117. CrossRef - Workforce agility and its links to emotional intelligence and workforce performance: A study of small entrepreneurial firms in India
Deepanjana Varshney, Nirbhay Krishna Varshney
Global Business and Organizational Excellence.2020; 39(5): 35. CrossRef - Love your mistakes!—they help you adapt to change. How do knowledge, collaboration and learning cultures foster organizational intelligence?
Wioleta Kucharska, Denise A.D. Bedford
Journal of Organizational Change Management.2020; 33(7): 1329. CrossRef - ÖRGÜT KÜLTÜRÜ ALGISININ ÖRGÜTSEL ÇEVİKLİK ÜZERİNDEKİ ETKİSİNİN İNCELENMESİ
Suzan BASRI, Kürşad ZORLU
Sosyal Ekonomik Araştırmalar Dergisi.2020; 20(39): 147. CrossRef - Investigating the Impact of Using Knowledge Management on Organisational Agility through Competitive Intelligence and Strategic Thinking
Hossein Sayyadi Tooranloo, Sepideh Saghafi
Journal of Information & Knowledge Management.2019; 18(02): 1950016. CrossRef - The effect of knowledge management, e-learning systems and organizational learning on organizational intelligence
Zeynab Soltani, Batool Zareie, Leila Rajabiun, Ali Agha Mohseni Fashami
Kybernetes.2019; 49(10): 2455. CrossRef - Knowledge management infrastructures and organizational intelligence in Iranian research centers
Hamid Keshavarz, Mohammad Reza Esmaili Givi, Mohammad Reza Shekari
Data Technologies and Applications.2018; 52(1): 2. CrossRef - Örgütsel Çeviklik Ölçeğinin Türkçeye Uyarlanması: Geçerlik ve Güvenirlik Çalışması
Bülent AKKAYA, Akif TABAK
İş ve İnsan Dergisi.2018; 5(2): 185. CrossRef - Evaluating indicators of the agility of the green supply chain
Hossein Sayyadi Tooranloo, Masoume Alavi, Sepideh Saghafi
Competitiveness Review.2018; 28(5): 541. CrossRef - Design thinking is ambidextrous
Dan-Ling Zheng
Management Decision.2018; 56(4): 736. CrossRef
 PubReader
 Cite
Cite
