Articles
- Page Path
- HOME > Osong Public Health Res Perspect > Volume 10(3); 2019 > Article
-
Original Article
Morbidity Profile of Cases Attended Oncology Center of Mansoura University (OCMU), Egypt: A Cross-Sectional Study - Miada M. F. Elmetwalya, Ziad A. Emarahb, Abd Elhamied M. Abd Elhamieda, Mohamed A. Hegazyc, Emily A. Kamela, Adel I. Al-Wehedya
-
Osong Public Health and Research Perspectives 2019;10(3):177-186.
DOI: https://doi.org/10.24171/j.phrp.2019.10.3.09
Published online: June 30, 2019
aDepartment of Community Medicine and Public Health, Faculty of Medicine, Mansoura University, Mansoura, Egypt
bDepartment of Medical Oncology, Oncology Center of Mansoura University, Mansoura, Egypt
cDepartment of Surgical Oncology, Oncology Center of Mansoura University, Mansoura, Egypt
- *Corresponding author: Miada M. F. Elmetwaly, Department of Community Medicine and Public Health, faculty of Medicine, Mansoura University, Mansoura, Egypt, E-mail : m_fahmi@mans.edu.eg
Copyright ©2019, Korea Centers for Disease Control and Prevention
This is an open access article under the CC BY-NC-ND license (http://creativecommons.org/licenses/by-nc-nd/4.0/).
Abstract
-
Objectives
- In Egypt, the National Cancer Registry Program integrates hospital-based data from multiple Egyptian governorates to obtain representative rates. Unfortunately, Dakahlia (one of the largest Egyptian governorates) was not integrated in the National Cancer Registry Program. This research aimed to acquire malignancy rates from the Oncology Center of Mansoura University, which is one of the two oncology centers present in Dakalia Governorate in Egypt.
-
Methods
- Electronic records of patients who attended the Oncology Center of Mansoura University during 2016 were accessed with permission. Analysis was performed to extract diagnostic categories (age, gender, and geographic distribution of cases).
-
Results
- Most commonly diagnosed malignancies were breast cancer which represented about 10% of cases in the Oncology Center of Mansoura University during 2016. This was followed by leukemia (3.80%), lymphoma (3.59%), and liver cancer (3.44%). Diagnoses encountered included benign and malignant tumors as well as non-tumor diagnoses. The Mansoura district had the highest proportionate rate of breast cancer cases. Females in the age group ≥ 35 < 60 years had the highest incidence of malignancy cases across all diagnoses.
-
Conclusion
- The burden of breast cancer in Mansoura district is high. Risk factors need further evaluation with a recommendation to perform an environmental risk assessment.
- Cancer is the second most common cause of mortality worldwide after cardiovascular diseases, and is responsible for more than 8 million deaths yearly [1]. It represents a burden on almost every country in the world [2]. In spite of recent advances in therapeutic options for many cancer types, the number of newly diagnosed cases is increasing. This is in part due to demographic ageing of the population worldwide, and the evolution of industries and technologies in almost every field, with continuous introduction of new chemicals, techniques and exposures. All of these advances are useful to humanity, yet, have major known and unknown health risks [3]. In 2011, the World Health Organization published a factsheet which documented that more than 60% of all cancer deaths come from middle and low income countries [4]. This is a warning for policy makers to consider cancer risk factors and prevention, a research priority. This would save the vast amount of resources that are spent on cancer management strategies that are not always successful.
- Unless genetic makeup predisposes an individual to cancer, environmental and occupational risk factors may be implicated. In fact, the most realistic model to explain cancer evolution is the “gene-environment interaction” [5]. Potentially, preventable cancer could be attributable to occupational and environmental risk factors. Controlling this will have an impact on global cancer morbidity and mortality rates [6].
- Careful analysis of the burden of different types of cancer is of great importance for the appropriate allocation of resources to screen, diagnose, treat, and prevent cancer in Egypt. This current study is a preliminary step in the establishment of an epidemiologic data base for cancer cases in Mansoura city and Dakahlia Governorate.
- In Egypt, the National Cancer Registry Program is a hospital-based data registry that was established in 2007. Currently, it is the only formal source for cancer statistics in Egypt. It integrates data from multiple Egyptian governorates to provide cancer statistics [7]. Dakahlia is one of the largest Egyptian Governorates but has never been integrated in the National Cancer Registry Program. This research aimed to analyze data obtained from the Oncology Center of Mansoura University (OCMU) which is one of the two oncology centers that serve Dakahlia Governorate. The objective of the current research was to study the most common types of cancer diagnosed, age, gender, and geographic distribution of cases who attended the OCMU during 2016.
Introduction
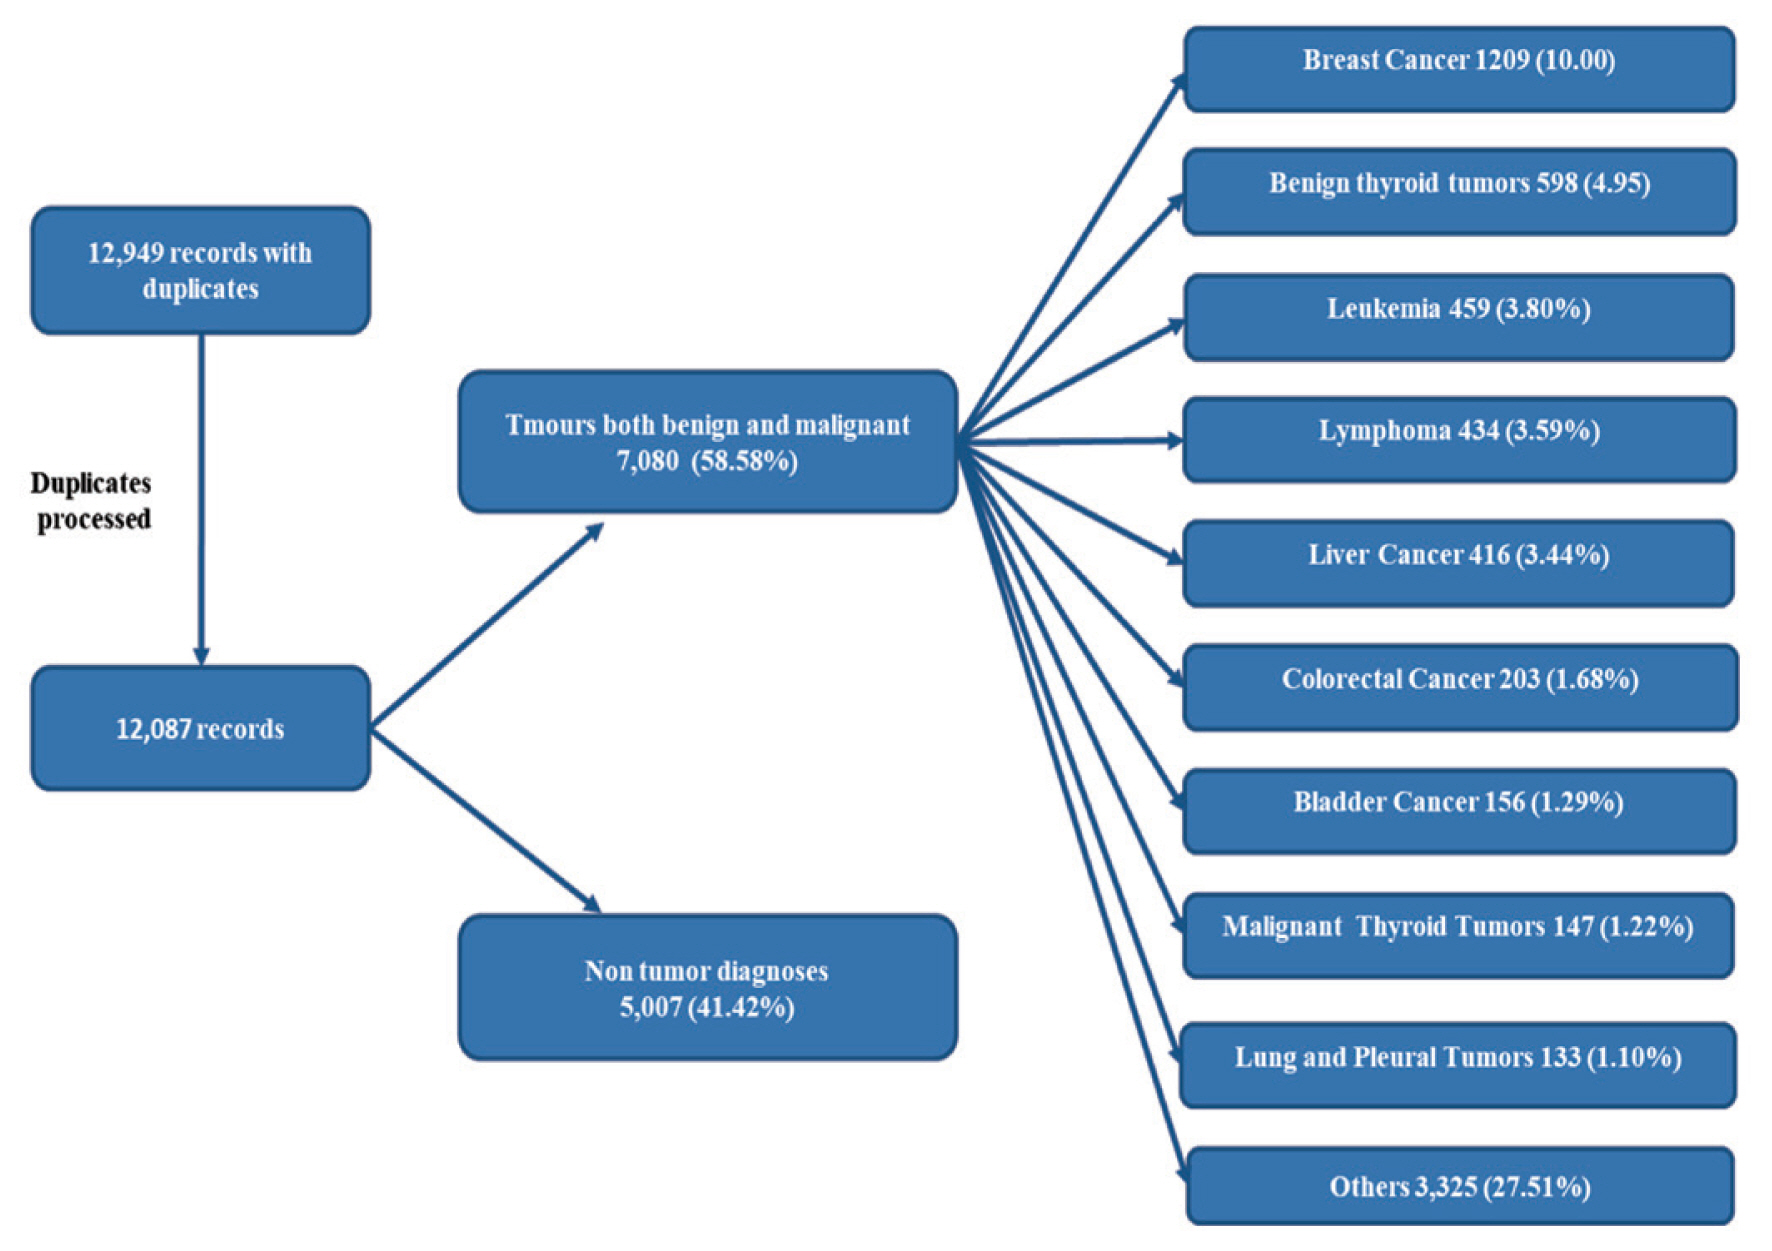
- The current descriptive record based cross-sectional study was conducted at the OCMU. It is one of the two oncology centers that serve Dakahlia Governorate in Egypt. Electronic records of all cases who attended the OCMU during 2016 were obtained with permission to be used in the study. There were 12,949 records including double and sometimes triple entries for one case. Records with double or triple entries were processed manually so that each patient had only one electronic record. Data was cleaned and prepared for analysis yielding a total of 12,087 records.
- Each electronic record had the following variables; identity, age, gender, address, and diagnosis of the patient. The most common cancer statistics were categorized within 16 age groups separated by 5 years beginning as the group 0–4 years and the last 2 age groups 70–74, and 75+ [7]. The current study used 4 categories that were relevant to the selected cancer types in the study. Frequencies of different diagnoses were generated. The range of diagnoses given to patients who attended the OCMU during 2016 was very large (353 diagnoses) and included malignant, benign, non-tumor, and even nonspecific diagnostic classes. For classification purposes, this study assigned these heterogeneous diagnoses into 24 major categories. The most common types of tumor diagnosed at the OCMU during 2016 were selected for further analysis regarding catchment areas of cases (breast cancer, benign thyroid tumors, leukemia, lymphoma, liver cancer, colorectal cancer, bladder cancer, malignant thyroid tumors, finally, lung and pleural tumors). Frequencies of the selected tumor types were related to the population census of different districts of Dakahlia Governorate in 2016 to obtain proportionate rates that were expressed per 100,000 population. A cartographic presentation is made for catchment areas of cases with breast cancer, benign thyroid tumors, and leukemia (Figures 1–3). Maps of Dakahlia Governorate were obtained from the Egyptian General Organization of Physical Planning, a governmental organization responsible for planning of housing and new cities in Egypt [8]. Population censuses of 2016 were obtained from the Central Agency for Public Mobilization and Statistics, the official agency responsible for collection and statistical analysis of census data in Egypt [9]. All statistical analyses in this current study were performed using IBM SPSS V. 23 (IBM Corp., Armonk, NY, USA). All patients’ records were confidential and used only for research purposes. The research protocol was approved by the Institutional Review Board of Mansoura Faculty of Medicine (MD/16.12.17).
Materials and Methods
- During 2016, the total number of cases who attended the OCMU was 12,087. A considerable portion of cases were diagnosed as non-tumors. Breast cancer is the most commonly encountered diagnosis among tumor cases, followed by benign thyroid tumors, leukemia, lymphoma, liver, colorectal, bladder, thyroid, and lung tumors (Figure 4).
- Age and gender distribution among all diagnoses (both tumor and non-tumor), are shown in Figure 5. Women aged ≥ 35 < 60 years were the most prevalent, representing more than 1/3 of cases, whilst girls under 15 years represented the smallest category.
- Breast related diseases such as fibroadenosis and breast cancer represented the most common diagnostic category encountered among cases in 2016 (32.92%). This was followed by hematological diseases (such as leukemia), reticuloendothelial system related diseases (such as lymphoma) and gastrointestinal tract related diseases (Table 1).
- Patients who attended the OCMU were not exclusively from Dakahlia Governorate. A considerable percentage of cases were inhabitants of other governorates that came to Dakahlia Governorate to seek medical and surgical management (26.90% of total cases). This is shown in Table 2. Percentage was expressed as part of the total number of cases in each selected tumor type. Leukemia cases had the highest percentage where 39.43% of cases came from other governorates. Colorectal and bladder cancer cases occurred in 38.92% and 37.82% of cases came from other governorates, respectively.
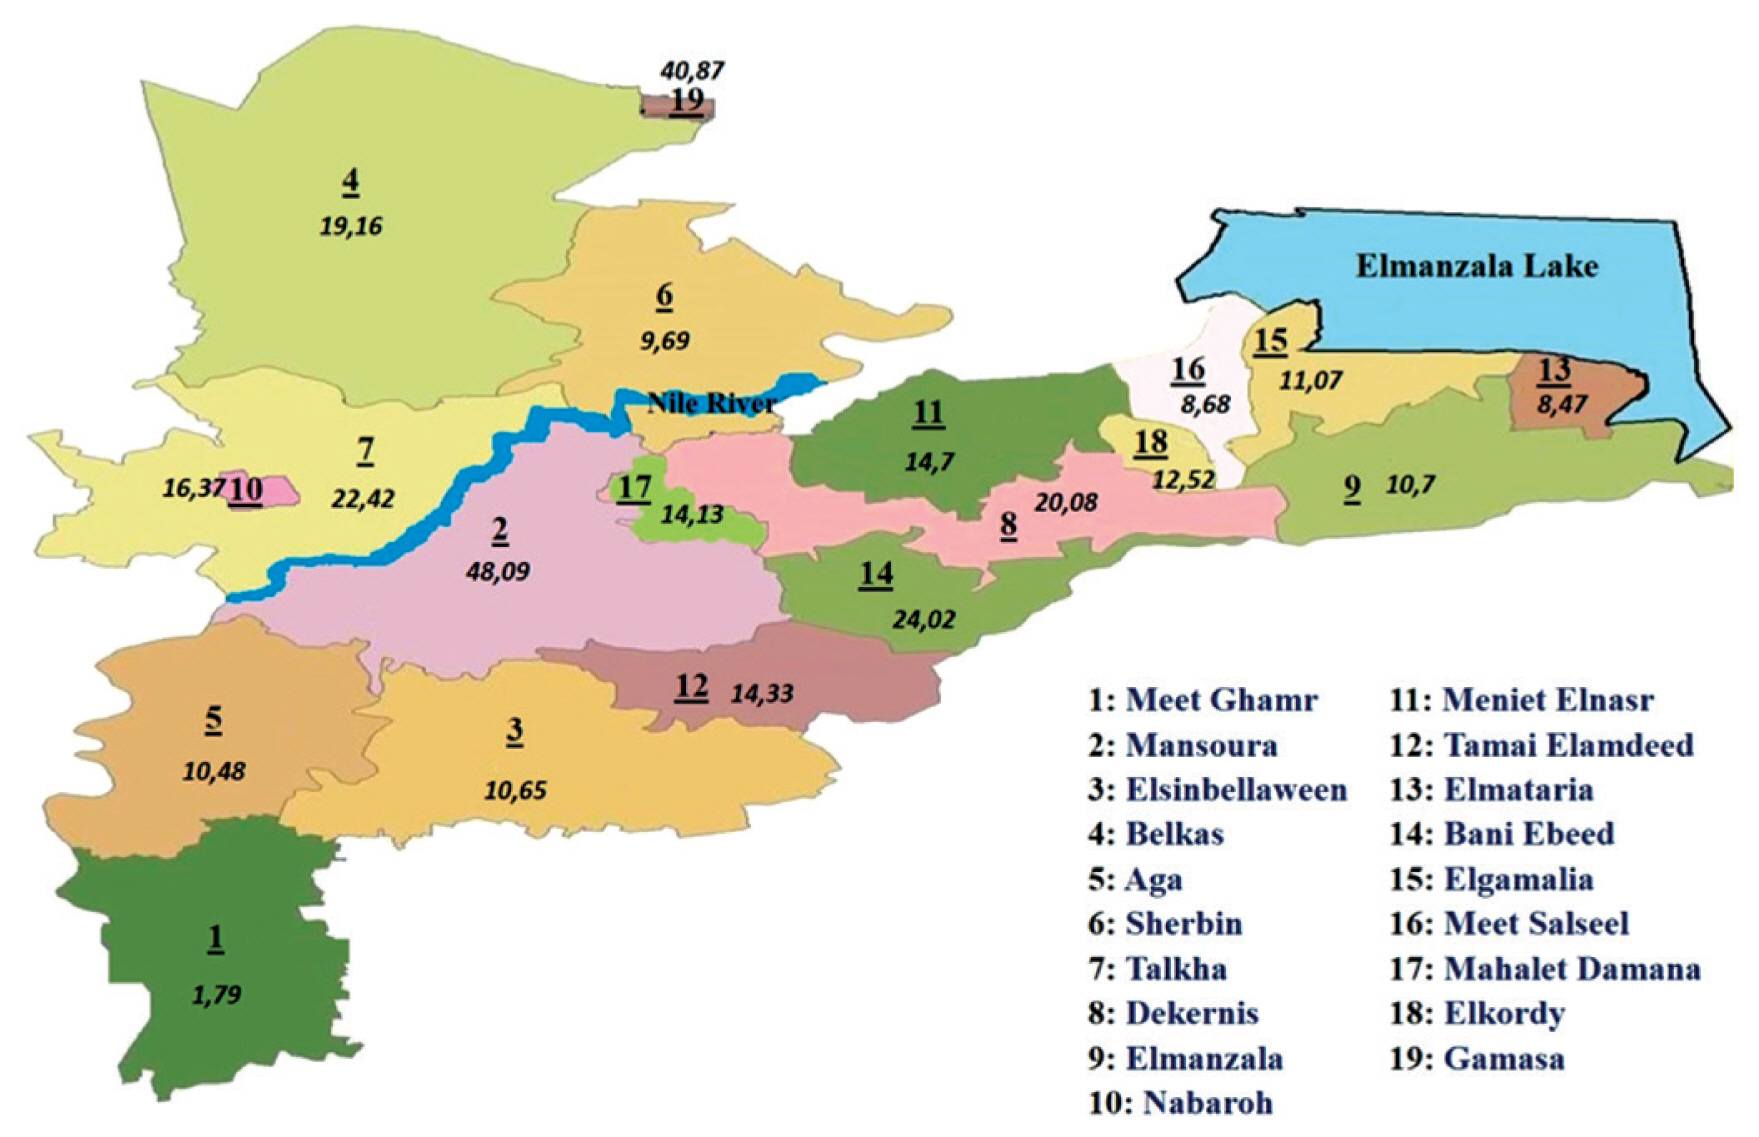
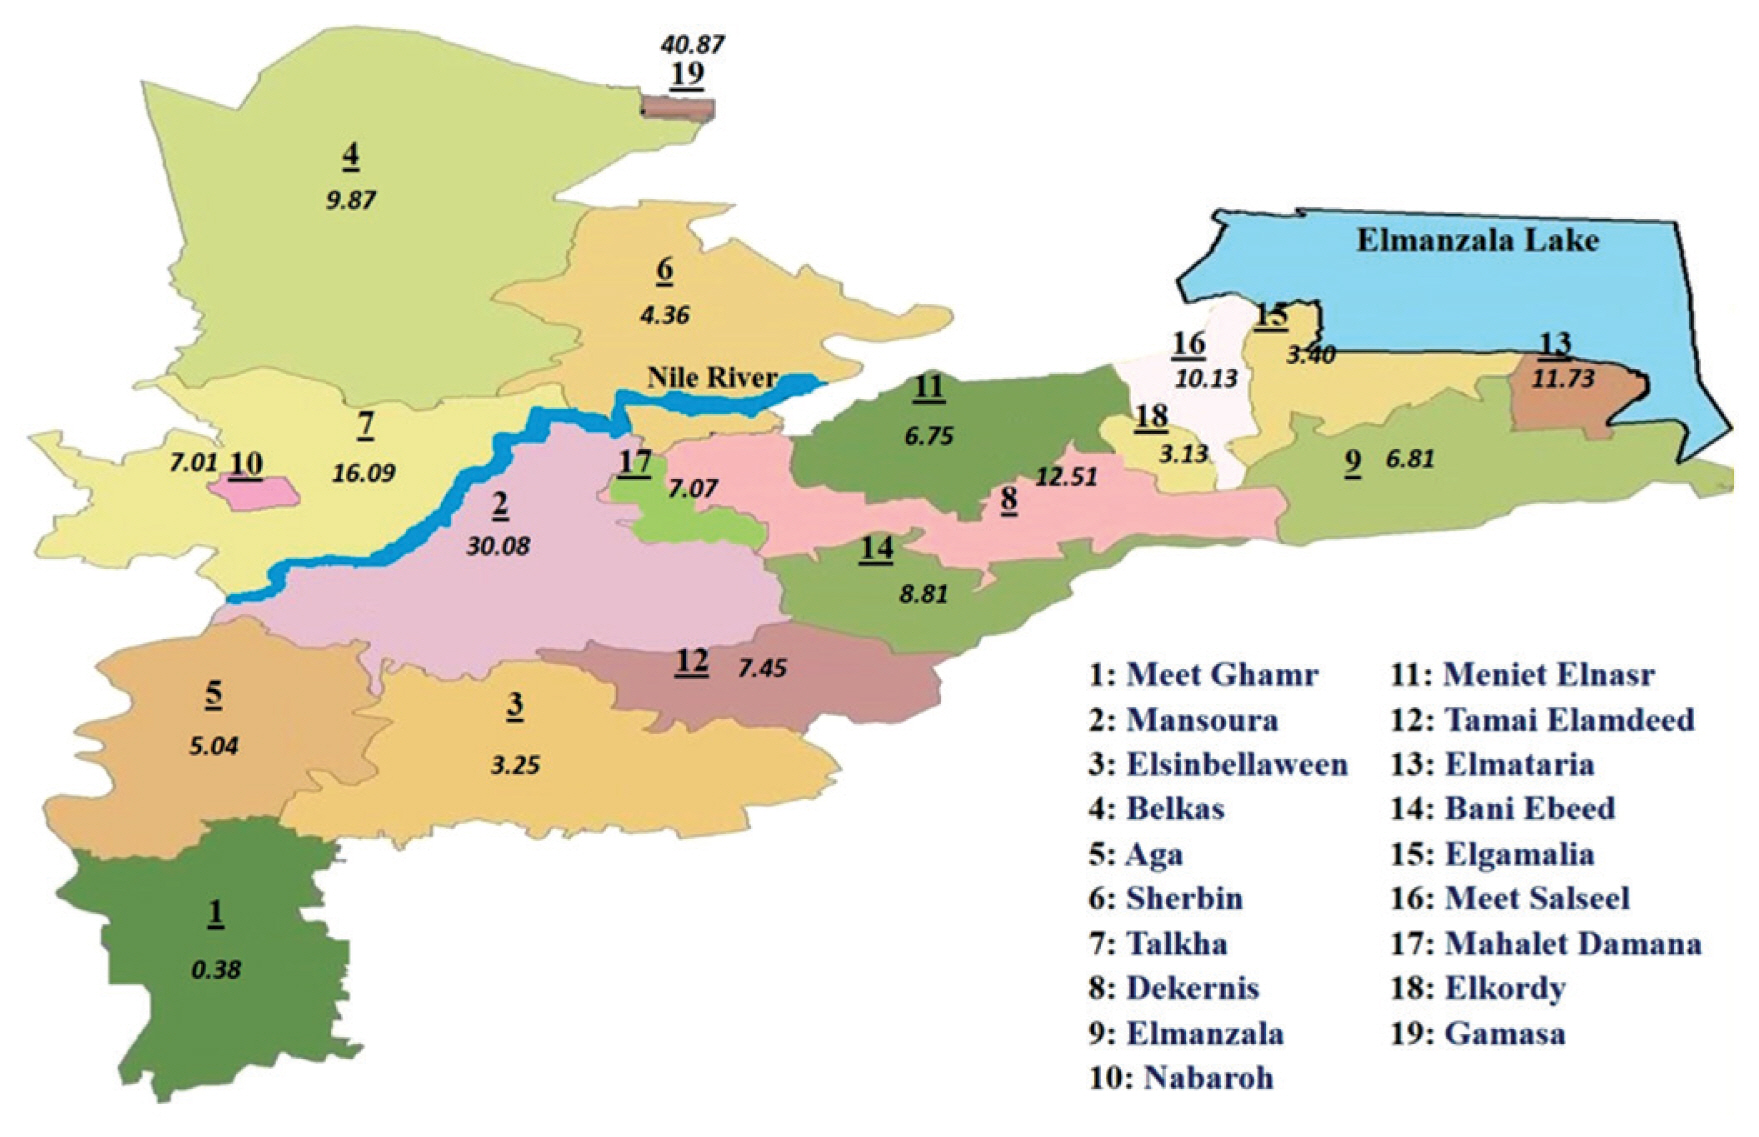
- Dakahlia Governorate is divided into 19 districts: Meet Ghamr, Mansoura, Elsinbellaween, Belkas, Aga, Sherbin, Talkha, Dekernis, Elmanzala, Nabaroh, Meniet Elnasr, Tamai Elamdeed, Elmataria, Bani Ebeed, Elgamalia, Meet Salseel, Mahalet Damana, Elkordy, Gamasa. Proportionate rates of the selected tumor types in different districts of Dakahlia Governorate have been expressed as per 100,000 population (Table 3). Districts were arranged in a descending manner according to the population census from Central Agency for Public Mobilization and Statistics, Egypt Statistics 2016. Meet Ghamr, the most populated district, had less than expected rates. Mansoura district, which had the second largest population, had the highest rate in breast cancer. Gamasa district had the highest rate in benign thyroid tumors. Mahalet Damana had the highest proportionate rate in leukemia. Meet Salseel district had the highest incidence in 3 tumor types: lymphoma, liver, and bladder cancer. Elkordy district had the highest rate of colorectal cancer cases. Elgamalia had the highest rate of malignant thyroid tumors. Tamai Elamdeed had the highest proportionate rate for lung and pleural tumors.
- Cartographical presentation of the catchment areas of cases was constructed. The current study chose 3 of the most common tumor types that were encountered among cases in 2016. Proportionate rates are presented on the maps per 100,000 population according to the Central Agency for Public Mobilization and Statistics, Egypt Statistics census 2016 (Figures 1–3). The Dakahlia districts were given numbers from 1 to 19 according to the population census in 2016 (where number 1 was the most populated district).
- Age and gender distribution of the most common tumor types encountered during 2016 have been illustrated in Table 4. Breast cancer peaked in females aged ≥ 35 < 60 years. There were no cases in girls less than 15 years, and only 5 % of cases were ≥ 15 < 35 years. There were 17 cases of male breast cancer, all were 35 years and older. More than 85% of benign thyroid tumors were diagnosed in females. About half of the cases were in the age group ≥ 35 < 60 years. Males younger than 15 years represented the group with the smallest number of cases. Regarding leukemia, there was a slight male predominance in all age groups. The percentage of leukemia increased gradually with age groups, peaking at the group ≥ 35 < 60 years before slightly decreasing afterwards. About half of the cases diagnosed with lymphoma were in the age group ≥ 35 < 60 years, 1/3 of cases were older, and the rest of the cases were younger with slight male predominance in all age groups. Almost all of the cases of liver cancer were 35 years and older. There was only 1 case in the age group ≥ 15 < 35 years, and there were no cases younger than 15 years. More than half of the cases were 60 and older. There was a big gap between the number of male and female cases, showing male predominance. There was a slight female predominance in colorectal cancer cases in the total number of cases. This was true for all age groups except for the group aged ≥ 15 < 35 years. About a 1/5 of cases were in this age group. Half of the cases were in the age group ≥ 35 < 60 years. Cases 60 years and above represented approximately 2/5 of all the colorectal cancer cases. Like liver cancer, no cases under the age of 15 years were diagnosed. More than 80% of cases of bladder cancer were in males. There was only 1 case of male bladder cancer younger than 35 years. Bladder cancer gradually increased after the age of 35 years. One quarter of cases were in the age group ≥ 35 < 60 years, and the rest were in the 60 years and older group. Regarding malignant thyroid tumors, about 2/3 of cases were females, and this predominance was true for all age groups until 60 years, where the number of male cases increased to be the same as female cases. There was 1 case of a male who was younger than 15 years. More than half of the cases were in the group ≥ 35 < 60 years. There were no cases of lung or pleural tumors below the age of 15 years. Only few were younger than 35. About half of the cases were in the group ≥ 35 < 60 years. As observed in colorectal cancer. The other half of the cases were 60 years and older. In all age groups, males predominated. The number of male cases was about double the number of male cases of lung and pleural tumors.
- Figure 6 shows that, among patients with breast related diseases, fibroadenosis of the breast represented 37% of cases. Breast cancer was diagnosed in 30% of cases. Benign neoplasms of the breast represented 20% of cases. The remaining 13% of cases were assigned other diagnoses such as breast abscess or inflammatory disorders.
Results
- This current study observed that breast cancer was the most commonly diagnosed cancer in those who attended the OCMU during 2016, followed by leukemia, lymphoma, liver, colorectal, bladder cancers, lung and pleural tumors. A study that was based upon the National Cancer Registry Program reported that the most common cancer type was liver cancer (23.8%), followed by breast cancer (15.4%), then bladder cancer (6.9%) [7]. There was no contradiction between the 2 studies; the current study analyzed data from the OCMU only, and liver cancer cases in the Gastroenterology Surgery Center. The same was true regarding bladder cancer cases in the Urology Center. Both were specialized centers in the Mansoura University Hospitals. A study that integrates data from all the specialized centers in Mansoura University Hospitals may be expected to yield the same results as Ibrahim et al [7].
- More than 1/4 of all cases who attended the OCMU during 2016 were inhabitants of other governorates according to the current study. This may be explained by the long course of disease for many cancer types accompanied by many therapeutic options that can be undertaken. The OCMU is a highly reputable oncology center in Egypt with a new Bone Marrow Transplant Unit and hospice care unit that will be available to patients, providing facilities that are not yet offered in all oncology centers in Egypt.
- With regards to the proportionate rates of different tumor types in the 19 districts of the Dakahlia Governorate, Mansoura district had the highest rates for breast cancer. This may require further investigations of environmental influences such as endocrine disruptors. Meet Salseel district had the highest proportionate rates in 3 cancer types; lymphoma, liver, and bladder cancers. This may be due to the Meet Salseel district being a largely agricultural community, where a report has shown an association between non Hodgkin lymphoma and pesticide exposure [10]. Schistosomiasis infection is the main risk factor of bladder cancer in Egypt [11]. It is expected to be high in an agricultural district such as Meet Salseel. Regarding liver cancer, the main risk factor in Egypt is Hepatitis C infection [12]. This may require further investigations of risk factors involved in infection.
- Rates cannot be considered as prevalence rates for many reasons; in the data registry used to extract these results, old cases were not delineated from the new cases of those who attended the OCMU for the first time. A portion of cancer patients that lived in some Dakahlia districts attended Oncology Centres in other governorates and they were registered in their data systems but not in the OCMU data system, so the frequencies generated in this study cannot be relied upon to express the real prevalence rates. Another reason is that, in Mansoura, the OCMU covers only some types of cancers; liver cancer is managed in the Gastroenterology Surgery Center in Mansoura University Hospitals; bladder cancer is managed in the Urology Center of Mansoura University Hospitals; tumors that require radiotherapy such as brain tumors are managed in the Nuclear Medicine Center of Mansoura University Hospitals. A considerable portion of cases seek treatment in the Egyptian Ministry of Health Hospitals, or in private clinics. In Egypt, both are considered independent of the OCMU. Finally, the OCMU is 1 of 2 oncology centers in Dakahlia Governorate; the other center is in Meet Ghamr district, this explains the low proportionate rates of all tumor types in this district, because of physical accessibility of Meet Ghamr Oncology Center.
- The current study observed that about 2/3 of breast cancer cases were in the age group ≥ 35 < 60 years; and only 1/3 were older. This finding may suggest endogenous hormonal influences in early reproductive years [13]. Genetic susceptibility could have played a role [14], but the records used in the study did not include a genetic profile of the cases. Exposure to endocrine disruptors such as Bisphenol A (BPA) [15], dioxin exposure [16], and Dichloro Diphenyl Trichloroethane (DDT) [17] exposure may explain the age distribution of cases which is considered less than expected. This raises the suspicion in environmental exposures especially endocrine disruptors. Male breast cancer cases represented 1.4% of cases in this study. In 2005, male breast cancer represented 1% of cases [18]. Currently, it may be expected to be higher because of the progressive nature of the disease [19]. The higher proportion observed in this current study may be suggestive of the impact of endocrine disruption because of the possible association between male breast cancer and hormonal influences as targeted in therapy [20]. About half of the male breast cancer cases in the study were in the age group ≥ 35 < 60 years and the rest were 60 years and older. It has been reported that male breast cancer is a disease of old age, and the median age of diagnosis is 67 years [21]. This provides further support that exposure to endocrine disruptors may be involved in male breast cancer. The current study suggests further investigation of environmental endocrine disruptor exposure for both female and male breast cancer cases is required.
- The current study observed a predominance of benign and malignant thyroid tumors in females, similar to findings by Vanderpump et al [22] in 2011. It was observed in 2015 that thyroid cancer was previously a disease of the 4th and 5th decades of life, but recently, it has been increasingly diagnosed in the 2nd and 3rd decades of life [23]. It was also reported that thyroid cancer peaks in the 4th decade of life in females and later in males [24]. The age group ≥ 35 < 60 years included most of thyroid cancer cases of this current study for both males and females, which was a greater than expected increase in thyroid tumors in males. This may suggest environmental exposure to excess radiation and requires further investigations.
- In the Western world, chronic lymphocytic leukemia is the most common type of adult leukemia and in 2012 the median age of diagnosis was reported to be 65 to 70 years [25]. Another study in 2010 reported that only 11% of patients diagnosed with chronic lymphocytic leukemia were younger than 55 years [26]. Regards acute myeloid leukemia, the median age of diagnosis was 65 years [27]. The current study did not differentiate the pathologic types of leukemia, but patients in the age group ≥ 35 < 60 years represented the highest percentage. This may be suggestive of environmental exposure. Karakosta and Delicha [28] reported that environmental exposure to petroleum products and pesticides may be associated with chronic lymphocytic leukemia. Tsai et al [29] observed that acute myeloid leukemia may be linked to exposure to benzene, ionizing and non-ionizing radiation, and pesticides. Further investigations of environmental exposures may be required. In the current study, there was a predominance of male cases that had acute myeloid leukemia which was similar to findings in a report by Diehl et al [30] in 1999.
- Lymphoma was more common in males in this current study, similar to other recent findings in the UK [31] and Roman et al [32]. The median reported age of diagnosis of lymphoma was 72.4 years with a considerable subtype heterogeneity; for example, the median age of diagnosis of acute myeloid leukemia ranged from 20.3 to 73.7 years [31] in the article of Roman et al [32]. In the current study, about half of the cases were in the age group ≥ 35 < 60 years, but without the subtypes of lymphoma conclusions cannot be made.
- Hepatitis C infection is endemic in Egypt [33]. This may be in part due to parenteral antischistosomal therapy in the last century [34]. Hepatitis C is a known risk factor for liver cancer (25% of cases) [12]. The current study observed that liver cancer increased with age; this may be explained by increased duration of chronic Hepatitis C infection. There was a striking predominance of liver cancer cases in males in this current study similar to a report in 2002 [35].
- The current study reported a slight predominance of male cases of colorectal cancer. Gao et al [36] observed that males and females contribute equally to colorectal cancer cases, but similar to this current study males tended to have a higher proportion of cancers of the distal colon. The current study observed that about half of the cases were in the age group ≥ 35 < 60 years, and 40% of cases were older. Sadeghi Gandomani et al [37] reported that colorectal cancer increased significantly during the 4th decade of life. There was no contradiction between the current study and previous research into colorectal cancer.
- Schistosomiasis infection is endemic in Egypt [38]. It is a well-documented risk factor of bladder cancer [11]. Successful control strategies were applied in 1980 and schistosomiasis infection as well as the incidence of bladder cancer, gradually decreased [39]. The current study suggests that because of the decline of schistosomiasis infection rates, bladder cancer cases in the age group ≥ 35 < 60 years were only 1/4 of the cases, while the rest were cases who were older and were infected before control strategies were in place. Further investigations of the pathologic types of bladder cancer may be informative; transitional cell carcinoma may be due to occupational and environmental exposure (solvents [40]), whereas squamous cell carcinoma was mostly due to schistosomiasis infection [41]. The male to female ratio of bladder cancer has been reported to be 2:1 [42]. In the current study the gap between male and female percentages is larger. This may be because males were more exposed to schistosomiasis infection than females in the Egyptian community [43].
- In the current study male cases of lung and pleural tumors were double the female cases. Global statistics reported in 2002 suggest that the age standardized ratios of lung cancer in males and females were 35.5 and 12.1, respectively [44]. An American study in 2011 observed that incidences of lung cancer in males and females were 76.2 and 52.4 per 100,000 population respectively [45]. Data used in the current study did not include the smoking history of lung cancer female patients, but in Egyptian society, smoking among females is relatively uncommon [46]. Further investigations of environmental exposures may be required. Factors that can be suspected are cooking in confined areas without smoke extractors [47], and second hand smoke [48]. About half of the cases in the current study were in the age group ≥ 35 < 60 years and the other half were older. This may be due to the accumulation of the effects of lung carcinogen exposures such as smoking [49], occupational exposures such as asbestos [50], and environmental exposures such as residential radon gas [51].
- The current study observed that among breast disease cases, fibroadenosis is the most common (more than 1/3 of cases), followed by breast cancer (1/3 of the cases). One fifth of cases were benign breast tumors. These findings contradict a study that reported benign breast tumors as the most common and accounted for more than 1/3 of the cases recruited, and fibroadenosis which accounted for about 1/3 of cases [52]. Thorough investigation of the environmental and hormonal risk factors relevant in the study population is required.
- An important limitation of this study was that not all cancer cases in Dakahlia Governorate were registered in the data system of the OCMU. Some cases were managed in other specialized centers in Mansoura University Hospitals. Other cases seek treatment in Health Insurance Hospitals, or attend oncology centers in other governorates, so prevalence rates cannot be generated. Integration of data from all centers and hospitals that manage cancer cases in the Dakahlia Governorate is required for generalization. The overall conclusion of this current research suggests possible associations between environmental exposure and the cancer types studied. Further confirmation requires a thorough environmental risk assessment.
Discussion
- Breast cancer followed by benign thyroid tumors, then leukemia, were the most frequently diagnosed tumors among cases who attended the OCMU during 2016 in Egypt. Lymphomas, liver, colorectal, bladder, malignant thyroid, and lung cancers were the next most frequent cancers. The Mansoura district of Dakahlia Governorate had the highest proportionate rate of breast cancer. Cases were mostly in the age group ≥ 35 < 60 years. The Meet Salseel district had 3 of the highest rates of tumor types (lymphoma, liver, and bladder cancers). Environmental risk factors may be causal and need to be further investigated in a systemized comprehensive environmental risk assessment.
Conclusion
- 1. Modification of data entry system in the OCMU to
Minimize duplicate entries. After reaching the final diagnosis, all the records with provisional diagnoses should be erased.
Reformulation of the diagnostic categories to be more specific and relevant. This study recommends assigning diagnoses into fewer major diagnostic categories. It would be preferable to follow 1 of the national cancer registry systems to pave the way for integrating data from multiple national registries and improve the quality of national cancer statistics.
- 2. Collaboration between Mansoura University medical and surgical centres
Research that integrates cancer patients’ data from all Mansoura University Hospitals and Centres is needed to explore the prevalence of liver and bladder cancers.
Multi-Centre studies including all oncology centres in Egypt are needed. This would provide the actual burden of different types of cancer in Egypt that could be used to set priorities for prevention programs.
- 3. Environmental studies
More research is needed to explain the high prevalence of breast cancer in some of the Dakahlia districts. This would highlight environmental and occupational risk factors.
Research on environmental and occupational risk factors in the Dakahlia governorates for the most common types of tumor is needed, because these cancers are preventable. This can largely be fulfilled via an environmental risk assessment in the geographical areas that raised suspicion. To date, Mansoura, Mahalet Damana, and Meet Salseel districts are strongly recommended to perform a thorough environmental risk assessment to investigate environmental risk factors.
Recommendations
-
Conflicts of Interests
The authors declare that there is no conflicts of interests.
Article information
- 1. Nagai H, Kim YH. Cancer prevention from the perspective of global cancer burden patterns. J Thorac Dis 2017;9(3). 448−51. PMID: 10.21037/jtd.2017.02.75. PMID: 28449441. PMID: 5394024.ArticlePubMedPMC
- 2. Lozano R, Naghavi M, Foreman K, et al. Global and regional mortality from 235 causes of death for 20 age groups in 1990 and 2010: a systematic analysis for the Global Burden of Disease Study 2010. Lancet 2012;380(9859). 2095−128. PMID: 10.1016/S0140-6736(12)61728-0. PMID: 23245604.ArticlePubMedPMC
- 3. Allemani C, Weir HK, Carreira H, et al. Global surveillance of cancer survival 1995–2009: analysis of individual data for 25 676 887 patients from 279 population-based registries in 67 countries (CONCORD-2). Lancet 2015;385(9972). 977−1010. PMID: 10.1016/S0140-6736(14)62038-9. PMID: 4588097.ArticlePubMed
- 4. WHO. Environmental and occupational cancers. 2011.
- 5. Brennan P. Gene–environment interaction and aetiology of cancer: what does it mean and how can we measure it? Carcinogenesis 2002;23(3). 381−7. PMID: 10.1093/carcin/23.3.381. PMID: 11895852.ArticlePubMedPDF
- 6. Li P, Deng SS, Wang JB, et al. Occupational and environmental cancer incidence and mortality in China. Occup Med (Lond) 2012;62(4). 281−7. PMID: 10.1093/occmed/kqs016.ArticlePubMedPDF
- 7. Ibrahim AS, Khaled HM, Mikhail NN, et al. Cancer incidence in Egypt: results of the national population-based cancer registry program. J Cancer Epidemiol 2014;2014:437971. PMID: 10.1155/2014/437971. PMID: 25328522. PMID: 4189936.ArticlePDF
- 8. General Organization of Physical Planning [Internet]. Maps of Dakahlia Governorate 2018 [cited 2018 Jan 5]. Available from: http://www.gopp.gov.eg/MasterPages/index.aspx.
- 9. Central Agency for Public Mobilization and Statistics [Internet]. Egypt Statistics 2016 [cited 2018 Jun 20]. Available from: http://www.capmas.gov.eg/.
- 10. Dreiher J, Kordysh E. Non-Hodgkin lymphoma and pesticide exposure: 25 years of research. Acta Haematol 2006;116(3). 153−64. PMID: 10.1159/000094675. PMID: 17016033.ArticlePubMed
- 11. Mostafa MH, Sheweita SA, O’Connor PJ. Relationship between schistosomiasis and bladder cancer. Clin Microbiol Rev 1999;12(1). 97−111. PMID: 10.1128/CMR.12.1.97. PMID: 9880476. PMID: 88908.ArticlePubMedPMC
- 12. Perz JF, Armstrong GL, Farrington LA, et al. The contributions of hepatitis B virus and hepatitis C virus infections to cirrhosis and primary liver cancer worldwide. J Hepatol 2006;45(4). 529−38. PMID: 10.1016/j.jhep.2006.05.013. PMID: 16879891.ArticlePubMed
- 13. Hulka BS, Moorman PG. Breast cancer: hormones and other risk factors. Maturitas 2001;38(1). 103−13. discussion 113–6.PMID: 10.1016/S0378-5122(00)00196-1. PMID: 11311599.ArticlePubMed
- 14. Wooster R, Bignell G, Lancaster J, et al. Identification of the breast cancer susceptibility gene BRCA2. Nature 1995;378(6559). 789−92. PMID: 10.1038/378789a0. PMID: 8524414.ArticlePubMedPDF
- 15. Soto AM, Sonnenschein C. Environmental causes of cancer: endocrine disruptors as carcinogens. Nat Rev Endocrinol 2010;6(7). 363−70. PMID: 10.1038/nrendo.2010.87. PMID: 20498677. PMID: 3933258.ArticlePubMedPMCPDF
- 16. Brown NM, Manzolillo PA, Zhang JX, et al. Prenatal TCDD and predisposition to mammary cancer in the rat. Carcinogenesis 1998;19(9). 1623−9. PMID: 10.1093/carcin/19.9.1623. PMID: 9771934.ArticlePubMedPDF
- 17. Cohn BA, Wolff MS, Cirillo PM, et al. DDT and breast cancer in young women: new data on the significance of age at exposure. Environ Health Perspect 2007;115(10). 1406−14. PMID: 10.1289/ehp.10260. PMID: 17938728. PMID: 2022666.ArticlePubMedPMC
- 18. Weiss JR, Moysich KB, Swede H. Epidemiology of male breast cancer. Cancer Epidemiol & Prev Biomarkers 2005;14(1). 20−6.ArticlePDF
- 19. Joshi MG, Lee AK, Loda M, et al. Male breast carcinoma: an evaluation of prognostic factors contributing to a poorer outcome. Cancer 1996;77(3). 490−8. PMID: 10.1002/(SICI)1097-0142(19960201)77:3<490::AID-CNCR10>3.0.CO;2-#. PMID: 8630956.ArticlePubMed
- 20. Fentiman IS, Fourquet A, Hortobagyi GN. Male breast cancer. Lancet 2006;367(9510). 595−604. PMID: 10.1016/S0140-6736(06)68226-3. PMID: 16488803.ArticlePubMed
- 21. Anderson WF, Althuis MD, Brinton LA, et al. Is male breast cancer similar or different than female breast cancer? Breast Cancer Res Treat 2004;83(1). 77−86. PMID: 10.1023/B:BREA.0000010701.08825.2d. PMID: 14997057.ArticlePubMed
- 22. Vanderpump MP. The epidemiology of thyroid disease. Br Med Bull 2011;99:39−51. PMID: 10.1093/bmb/ldr030. PMID: 21893493.ArticlePubMedPDF
- 23. Shah JP. Thyroid carcinoma: epidemiology, histology, and diagnosis. Clin Adv Hematol Oncol 2015;13(4 Suppl 4). 3−6. PMID: 26430868. PMID: 5526593.PMC
- 24. Rahbari R, Zhang L, Kebebew E. Thyroid cancer gender disparity. Future Oncol 2010;6(11). 1771−9. PMID: 10.2217/fon.10.127. PMID: 21142662. PMID: 3077966.ArticlePubMedPMC
- 25. Parikh SA, Rabe KG, Kay NE, et al. Chronic Lymphocytic Leukemia in Young (≤ 55 years) Patients: A Comprehensive Analysis of Prognostic Factors and Outcomes. Haematologica 2014;99(1). 140−7. PMID: 10.3324/haematol.2013.086066. PMID: 4007929.ArticlePubMedPMC
- 26. Ferrajoli A. Treatment of younger patients with chronic lymphocytic leukemia. Hematology Am Soc Hematol Educ Program 2010;2010:82−9. PMID: 10.1182/asheducation-2010.1.82.ArticlePubMedPDF
- 27. Deschler B, Lübbert M. Acute myeloid leukemia: epidemiology and etiology. Cancer 2006;107(9). 2099−107. PMID: 10.1002/cncr.22233. PMID: 17019734.ArticlePubMed
- 28. Karakosta M, Delicha E-M, Kouraklis G, et al. Association of various risk factors with chronic lymphocytic leukemia and its cytogenetic characteristics. Arch Environ Occup Health 2016;71(6). 317−29. PMID: 10.1080/19338244.2015.1116429.ArticlePubMed
- 29. Tsai RJ, Luckhaupt SE, Schumacher P, et al. Acute myeloid leukemia risk by industry and occupation. Leuk Lymphoma 2014;55(11). 2584−91. PMID: 10.3109/10428194.2014.894189. PMID: 24547710. PMID: 4534715.ArticlePubMedPMC
- 30. Diehl LF, Karnell LH, Menck HR. The National Cancer Data Base report on age, gender, treatment, and outcomes of patients with chronic lymphocytic leukemia. Cancer 1999;86(12). 2684−92. PMID: 10.1002/(SICI)1097-0142(19991215)86:12<2684::AID-CNCR13>3.0.CO;2-V. PMID: 10594864.ArticlePubMed
- 31. Smith A, Crouch S, Lax S, et al. Lymphoma incidence, survival and prevalence 2004–2014: sub-type analyses from the UK’s Haematological Malignancy Research Network. Br J Cancer 2015;112(9). 1575−84. PMID: 10.1038/bjc.2015.94. PMID: 25867256. PMID: 4453686.ArticlePubMedPMCPDF
- 32. Roman E, Smith A, Appleton S, et al. Myeloid malignancies in the real-world: occurrence, progression and survival in the UK’s population-based Haematological Malignancy Research Network 2004–15. Cancer Epidemiol 2016;42:186−98. PMID: 10.1016/j.canep.2016.03.011. PMID: 27090942. PMID: 4911595.ArticlePubMedPMC
- 33. Guerra J, Garenne M, Mohamed MK, et al. HCV burden of infection in Egypt: results from a nationwide survey. J Viral Hepatitis 2012;19(8). 560−7. PMID: 10.1111/j.1365-2893.2011.01576.x.Article
- 34. Frank C, Mohamed MK, Strickland GT, et al. The role of parenteral antischistosomal therapy in the spread of hepatitis C virus in Egypt. Lancet 2000;355(9207). 887−91. PMID: 10.1016/S0140-6736(99)06527-7.ArticlePubMed
- 35. De Maria N, Manno M, Villa E. Sex hormones and liver cancer. Mol Cell Endocrinol 2002;193(1–2). 59−63. PMID: 10.1016/S0303-7207(02)00096-5. PMID: 12161002.ArticlePubMed
- 36. Gao R-N, Neutel CI, Wai E. Gender differences in colorectal cancer incidence, mortality, hospitalizations and surgical procedures in Canada. J Public Health 2008;30(2). 194−201. PMID: 10.1093/pubmed/fdn019.ArticlePDF
- 37. Gandomani HS, Yousefi SM, Aghajani M, et al. Colorectal cancer in the world: incidence, mortality and risk factors. Biomed Res Ther 2017;4(10). 1656−75. PMID: 10.15419/bmrat.v4i10.372.Article
- 38. Lotfy WM. Human schistosomiasis in Egypt: historical review, assessment of the current picture and prediction of the future trends. J Med Res Inst 2009;30:1−7.
- 39. Salem S, Mitchell RE, El-Alim El-Dorey A, et al. Successful control of schistosomiasis and the changing epidemiology of bladder cancer in Egypt. BJU Int 2011;107(2). 206−11. PMID: 10.1111/j.1464-410X.2010.09622.x. PMID: 21208365.ArticlePubMed
- 40. Sadetzki S, Bensal D, Blumstein T, et al. Selected risk factors for transitional cell bladder cancer. Med Oncol 2000;17(3). 179−82. PMID: 10.1007/BF02780525. PMID: 10962527.ArticlePubMedPDF
- 41. Shokeir AA. Squamous cell carcinoma of the bladder: pathology, diagnosis and treatment. BJU Int 2004;93(2). 216−20. PMID: 10.1111/j.1464-410X.2004.04588.x.ArticlePubMed
- 42. Horstmann M, Witthuhn R, Falk M, et al. Gender-specific differences in bladder cancer: a retrospective analysis. Gend Med 2008;5(4). 385−94. PMID: 10.1016/j.genm.2008.11.002. PMID: 19108811.ArticlePubMed
- 43. El-Katsha S, Watts S. Gender, behavior, and health: schistosomiasis transmission and control in rural. Egypt: American Univ in Cairo Press; 2002.
- 44. Parkin DM, Bray F, Ferlay J, et al. Global cancer statistics, 2002. CA Cancer J Clin 2005;55(2). 74−108. PMID: 10.3322/canjclin.55.2.74. PMID: 15761078.ArticlePubMed
- 45. Kratzke R, Franklin MJ. Lung cancer epidemiology. Encyclopedia of Cancer. Springer; 2011. pp 2100−4. PMID: 10.1007/978-3-642-16483-5_6893.Article
- 46. Youssef RM, Abou-Khatwa SA, Fouad HM. Prevalence of smoking and age of initiation in Alexandria, Egypt. East Mediterr Health J 2002;8(4–5). 626−37.ArticlePubMed
- 47. Ko Y-C, Lee C-H, Chen M-J, et al. Risk factors for primary lung cancer among non-smoking women in Taiwan. Int J Epidemiol 1997;26(1). 24−31. PMID: 10.1093/ije/26.1.24. PMID: 9126500.ArticlePubMedPDF
- 48. North CM, Christiani DC. Women and lung cancer: what is new? Semin Thorac Cardiovasc Surg 2013;25(2). 87−94. PMID: 10.1053/j.semtcvs.2013.05.002. PMID: 24216523. PMID: 3827695.ArticlePubMed
- 49. Thun MJ, Lally CA, Flannery JT, Calle EE, Flanders WD, Heath CW Jr. Cigarette smoking and changes in the histopathology of lung cancer. J Natl Cancer Inst 1997;89(21). 1580−6. PMID: 10.1093/jnci/89.21.1580. PMID: 9362155.ArticlePubMed
- 50. Subramanian J, Govindan R. Lung cancer in never smokers: a review. J Clin Oncol 2007;25(5). 561−70. PMID: 10.1200/JCO.2006.06.8015. PMID: 17290066.ArticlePubMed
- 51. Field RW, Steck DJ, Smith BJ, et al. Residential radon gas exposure and lung cancer: the Iowa Radon Lung Cancer Study. Am J Epidemiol 2000;151(11). 1091−102. PMID: 10.1093/oxfordjournals.aje.a010153. PMID: 10873134.ArticlePubMedPDF
- 52. Srivastava P, Arya PK, Khetarpal H, et al. Spectrum of benign breast diseases in a tertiary care hospital of punjab. J Evol Med Dent Sci 2017;6(79). 5602−6. PMID: 10.14260/jemds/2017/1216.ArticlePDF
References


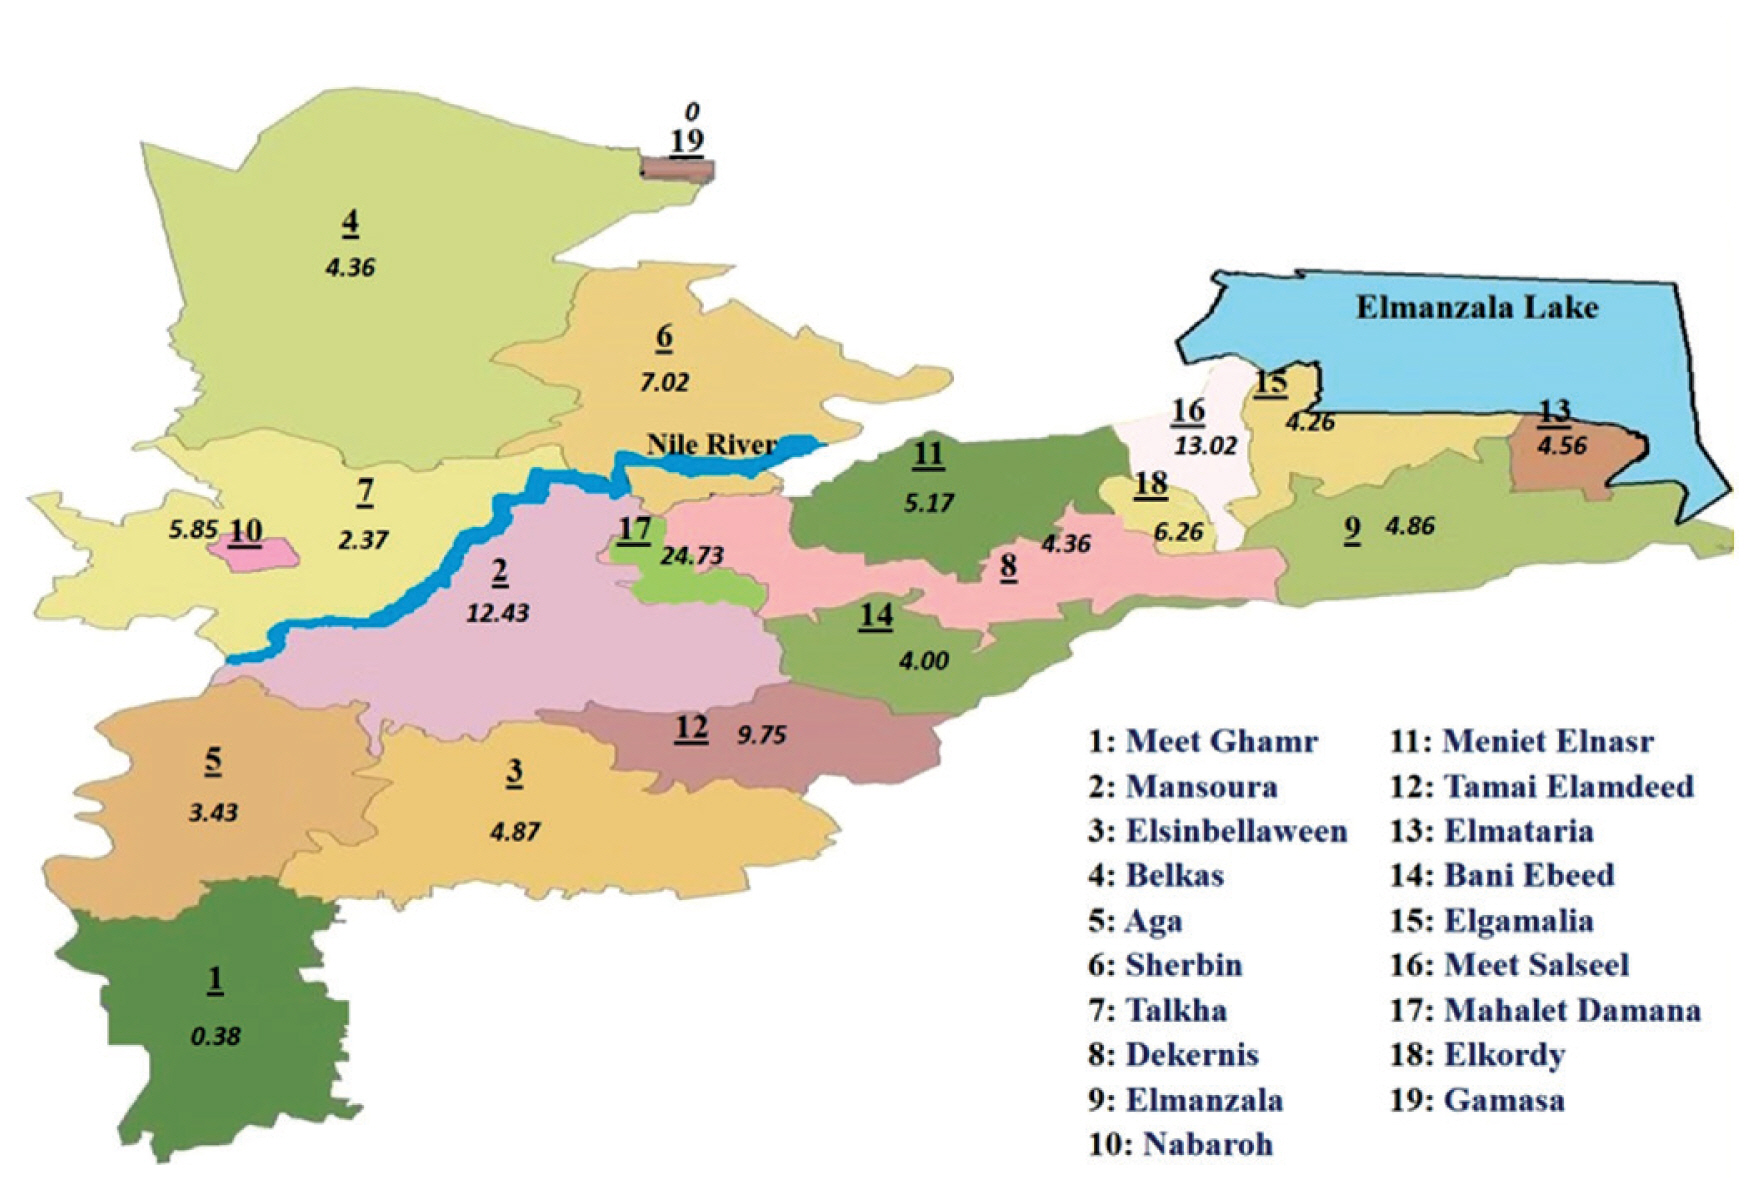

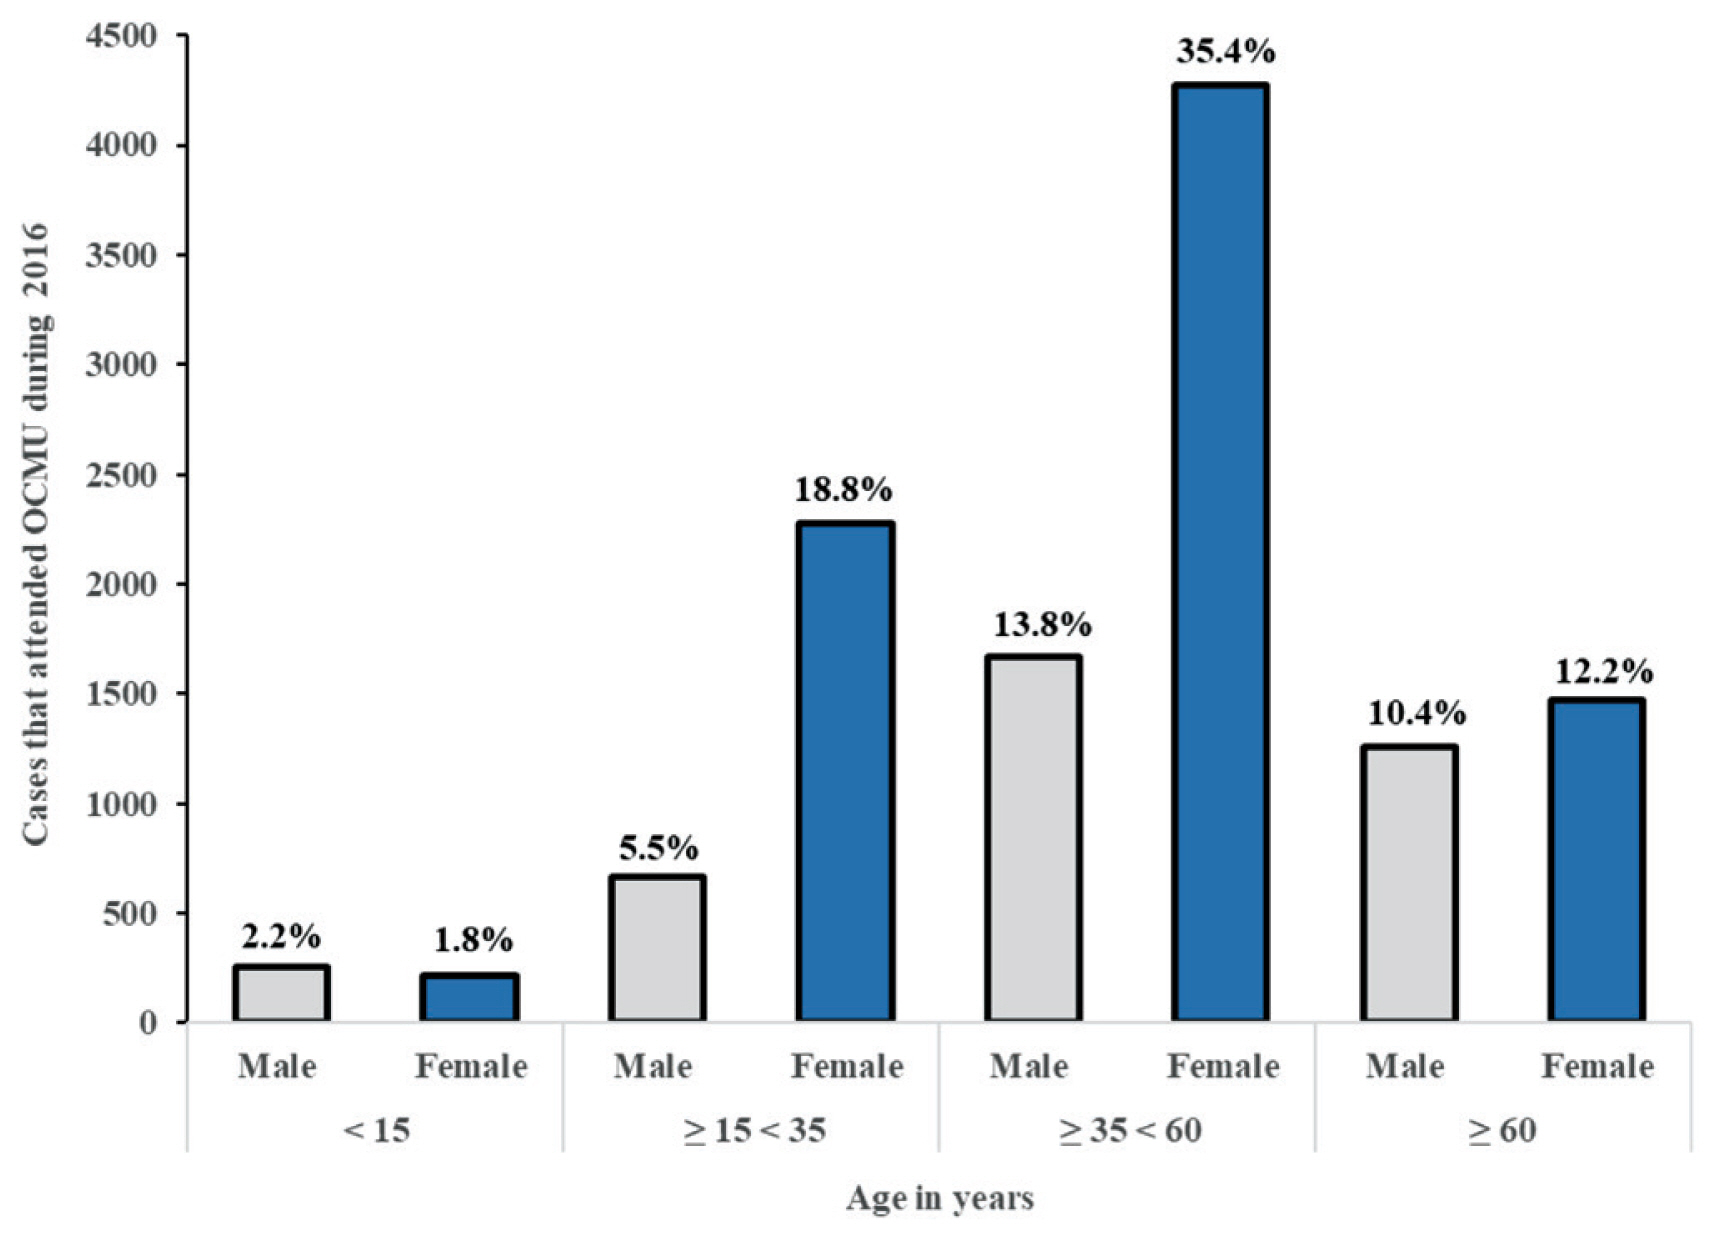
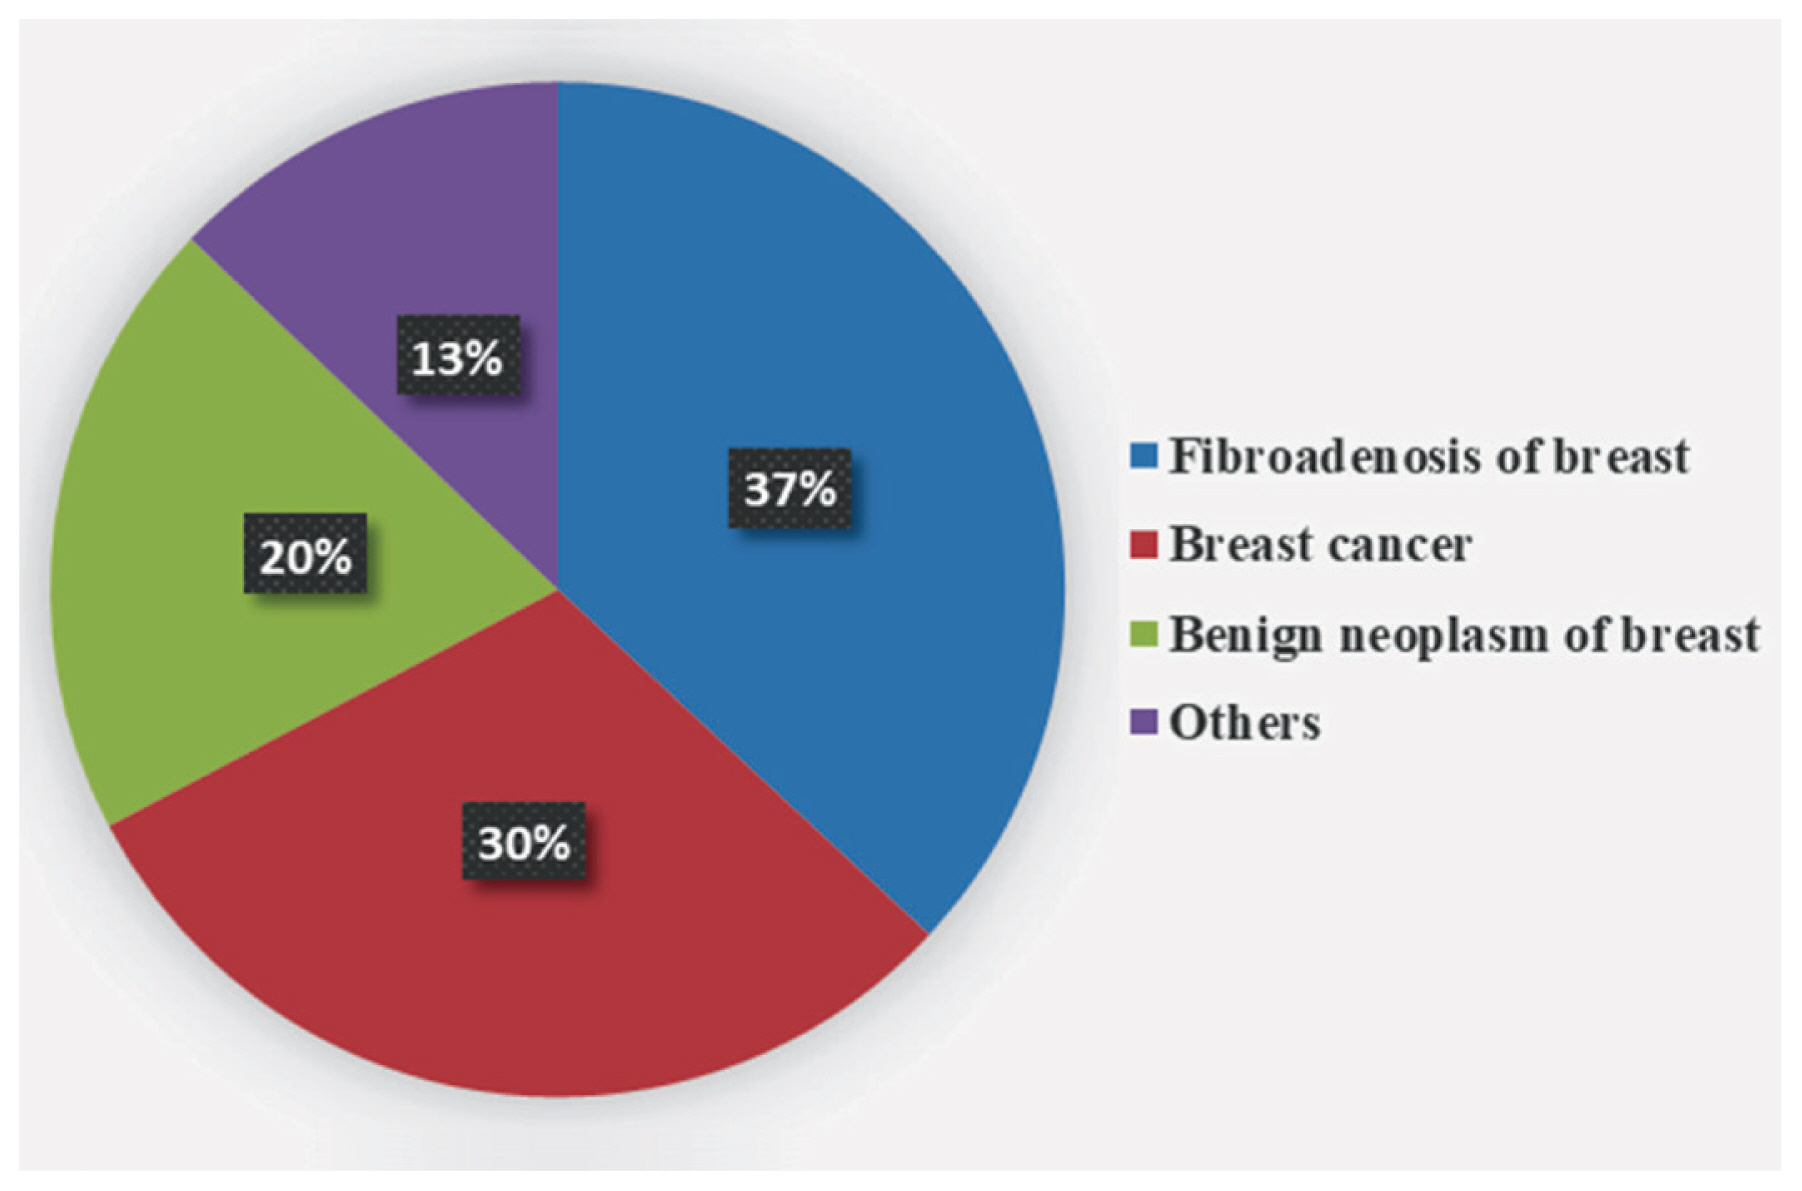
Figure & Data
References
Citations
- Parental occupational and environmental risk factors for childhood bone cancer in Mansoura oncology center: a case control study
S El-Helaly, E Khashaba, H El Domiaty, A Darwish
International Journal of Environmental Health Rese.2024; 34(1): 248. CrossRef
 PubReader
 ePub Link
 Cite
Cite