
Articles
- Page Path
- HOME > Osong Public Health Res Perspect > Volume 4(5); 2013 > Article
-
Original Article
Community-Based Home Healthcare Project for Korean Older Adults - TaeBum Lee
-
Osong Public Health and Research Perspectives 2013;4(5):233-239.
DOI: https://doi.org/10.1016/j.phrp.2013.09.002
Published online: October 31, 2013
Advanced Medical Device Research Center, Korea Electrotechnology Research Institute, Ansan, Korea
© 2013 Published by Elsevier B.V. on behalf of Korea Centers for Disease Control and Prevention.
This is an Open Access article distributed under the terms of the Creative Commons Attribution Non-Commercial License (http://creativecommons.org/licenses/by-nc/3.0) which permits unrestricted non-commercial use, distribution, and reproduction in any medium, provided the original work is properly cited.
Abstract
-
Objectives
- The aim of this study was to identify the effects of community-based home healthcare projects that influence service performances with regard to Korean national long-term care insurance services in older adults.
-
Methods
- The project's applicants were 18 operational agencies in national long-term care institutions in Korea, and participants were care recipients (n = 2263) registered in long-term care institutions. We applied our healthcare system to the recruited participants for a 3-month period from October 2012 to December 2012. We measured the community-based home healthcare services such as long-term care, health and medical service, and welfare and leisure service prior to and after applying the community-based home healthcare system.
-
Results
- After the implementation of community-based home healthcare project, all community-based home healthcare services showed an increase than prior to the project implementation. The nutrition management service was the most increased and its increase rate was 628.6%. A comparison between the long-term care insurance beneficiaries and nonbeneficiaries showed that health and medical services’ increase rate of nonbeneficiaries was significantly higher than beneficiaries (p < 0.001).
-
Conclusion
- Our community-based home healthcare project might improve the service implementation for older adults and there was a difference in the increase rate of health and medical services between Korean national long-term care insurance beneficiaries and nonbeneficiaries.
- Rapid erosion of family support and provision of affordable and accessible social care services to elderly persons are urgent issues that need to be addressed [1]. In addition, declines in health status and other personal issues among aging population have been exacerbated by recent reductions in public support [2].
- There are a lot of problems in elderly people such as wake after sleep onset, decreased sleep time, and osteoporosis [3,4]. In addition, negative mood is an important factor that should be considered while assessing the health of older persons [5], and therefore, lonely older people have nursing implications in that nurses must seek to identify those who need help in managing their loneliness and give guidance and support to such persons [6]. Furthermore, those who report unmet need for new activity-of-daily living disabilities after they return home from the hospital are particularly vulnerable to readmission [7,8]. However, there is little evidence about physical hospital environments for end-of-life care of older adults and their families [9], and the institutional elderly population was reported to be more vulnerable to the risk of excess hospitalization in winter [10].
- There are more vulnerable community-dwelling seniors who tend to be treated in more specialized emergency departments, which have worse linkages to community services [11]. In addition, counteracting the loss of function in activities of daily living after acute hospital admission with more intensive rehabilitation may partly reduce the need for institutionalization [12].
- A comparison of long-term care through home- and community-based services with nursing homes that affect outcome trajectories of older adults is difficult [13]. However, deinstitutionalized care settings maximize opportunities for older people to participate in decision-making models of care, which are community orientated [14]. Therefore, there are some community-based care programs for older adults. Some older adults with subjective memory complaints who continued the pleasant physical exercise programs showed improvement in some aspects of cognitive function [15]. In addition, the cognitive behavioral group program is currently made available in geriatric care settings nationwide in The Netherlands [16]. The integrated service-delivery networks model in Canada appears to offer an effective response to the long-term care needs of the elderly [17].
- It is thought to be of benefit to modify the healthcare-associated pneumonia criteria considering the healthcare and social health insurance system in Japan [18]. Under the Israel Long-Term Care Insurance law, disabled persons can receive in-kind home- and community-based services to enable frail older adults to age in place [19]. However, there are some issues about community care for older adults. The inter-resident assessment instrument might be suitable for comprehensive geriatric assessment tools designed for various healthcare settings [20]. Older adults living with their spouse were much less likely to use paid help than those living with adult children [21], and supporting caregivers is an important strategy in allowing clinically complex older adults to remain safely at home [22].
- In general, social networks play an important role in helping older adults monitor symptoms and manage chronic conditions [23]. The American aging services provider network plays a role in identifying, preventing, and collaborating in the treatment of depression among community-dwelling older adults [24]. In addition, the Korean Ministry of Health and Welfare conducted a pilot project on community-based home healthcare service for older adults.
- Although a majority of older people who needed help received enough support in daily care, the need for care is more demanded in disadvantaged groups [25]. In addition, home- and community-based program services’ unmet needs highlighted an inadequate workforce, transportation barriers, and limited supportive housing options [26]. Therefore, the aim of this study was to evaluate the performance of Korean community-based home healthcare project for older adults.
Introduction
- 2.1 Community-based home healthcare system
- For this community-based home healthcare system, major Korean public institutions participated in the pilot project, including the Ministry of Health and Welfare, National Health Insurance Corporation, 13 local governments, and they played a role in the selection of participants together with operation agencies. The Korean Ministry of Health and Welfare handled everything on the project with Namseoul University (Cheonan, Korea) as the research institute.
- Operation agencies conducted a demand survey of service requests from their service recipients prior to the project, and since then they designed the community-based home healthcare plan for their participants. After the completion of the care plan, operation agencies linked the service network with other service organizations such as the service provider, long-term care institutions, public health centers, welfare centers, professional group, educational institutions, and volunteer agencies.
- For the community-based home healthcare service, we developed the service management system online, which consists of the following three parts: long-term care service, health and medical service, welfare and leisure service.
- The long-term care service consists of five items, namely, visit care, visit bathing, day and night care, visit nursing, and assistive device. The health and medical service consists of 11 items, namely, doctor visit, nurse visit, home healthcare, dental hygiene, nutrition management, physical therapy, health promotion program, outpatient clinic, oriental clinic, dementia screening, and health education. The welfare and leisure service consists of nine items, namely, hairstyling, lunch box, side dish, art program, exercise program, senior products, residential environment improvement, education on prevention of elderly people abuse, and telephone greeting.
- The architecture and contents of the proposed system are depicted in Figure 1. This community-based home healthcare service system is managed online.
- 2.2 Participants
- This study included Korean long-term care insurance beneficiaries and nonbeneficiaries who are registered in the Korean national long-term care insurance system.
- All participants were care recipients from their long-term care institutions, which are the operation agencies of the community-based home healthcare project.
- A total of 41 long-term care institutions from all over the country applied for this community-based home healthcare pilot project, and the Ministry of Health and Welfare selected 18 operation agencies based on the capabilities of the applied organizations.
- Each operation agency recruited their participants by considering their networking service provider and participants’ demand, and the number of participants ranged from 48 to 175 for each long-term care institution. A total of 2263 Korean older adults participated in this study.
- Participants included Korean national long-term care insurance beneficiaries and nonbeneficiaries. Beneficiaries were judged based on their severe health condition by the National Health Insurance Corporation, and the severe health condition of nonbeneficiaries who registered in long-term care institutions was not judged.
- 2.3 Outcome measure
- After the internet-based home healthcare project system was developed, the system was applied to the 2263 participants for a 3-month period (October 2012 to December 2012). Every care manager from the long-term care institutions (operation agencies) was connected to the community-based home healthcare system, and they entered the data about their service performance online. The Korean Ministry of Health and Welfare and Namseoul University monitored the input data and performed data analysis.
- We measured the community-based home healthcare service items that provided data on participants prior to and after this project. In addition, we counted the service items provided to the participants, and calculated the increase rate of use of the services during the study period.
- The health condition of participants was classified as mild, moderate, and severe. The survey tool was based on Japanese older adults’ condition questionnaires, which included questions on physical and mental health conditions, activities of daily living, and social lifestyles [27].
- 2.4 Statistical analysis
- All results were expressed as n (%) and mean ± standard deviation. Prior to performing statistical analysis, normal distribution and homogeneity of variances were tested. A parametric analysis of the Student t test was used to compare the increase rate of community-based home healthcare service between beneficiaries and nonbeneficiaries in the Korean national long-term care insurance system. Statistical software IBM SPSS statistics 20 (Armonk, NY, U.S.) was used for the analysis.
Materials and Methods
- 3.1 Characteristics of participants
- A total of 2263 Korean older adults participated in this project conducted over a 3-month period from October 2012 to December 2012. The characteristics of the project participants are described in Table 1.
- The study participants included 1543 beneficiaries (68.2%) and 720 nonbeneficiaries (31.8%) in Korean national long-term care insurance system.
- A total of 517 men (22.4%) and 1796 women (77.6%) participated in the project through their long-term care institutions. The mean age of the participants was 78.9 ± 8.6 years.
- A total of 901 participants (39.0%) did not have a housemate and 1066 participants (47.1%) lived in an apartment. Physical status was classified as mild (44.4%), moderate (41.0%), and severe (14.6%), and mental status was also classified as mild (58.2%), moderate (27.4%), and severe (14.4%).
- 3.2 Community-based home healthcare service implementation
- The community-based home healthcare service was divided into three parts, namely, long-term care service, health and medical service, and welfare and leisure service.
- The average increase rate was 203.2%, and the most increased comprehensive home healthcare services were the health and medical service (145.9%) and welfare and leisure service (142.1%). The increase rate of the long-term care service was just 102.9%.
- The most increased home healthcare services were nutrition management (628.6%), health promotion program (589.5%), and residential environment improvement (440.6%), whereas the least increased home healthcare services were visit care (101.8%), visit bathing (104.8%), and assistive device (110.8%) as Table 2.
- 3.3 Increase rate between beneficiaries and nonbeneficiaries
- The community-based home healthcare services’ increase rate of Korean national long-term care insurance beneficiaries was lower than nonbeneficiaries as Table 3, but this was not significant statistically. However, health and medical services’ increase rate of Korean national long-term care insurance nonbeneficiaries was higher than beneficiaries, and this was significant statistically.
Results
- The most important finding of this study was the service increase effect of community-based home healthcare project for Korean older adults. A previous study reported that educational programs targeting nursing staff might not be effective in reducing the use of physical restraints in geriatric long-term care [28]. However, our results show that the participation in the education program on the prevention of elderly abuse increased by 160.2% through this project. Therefore, an appropriate community-based educational program might be effective in the home healthcare services of older adults.
- By contrast, protein-calorie malnutrition in older adults results in a decreased quality of life, declining functionality, the inability to live independently, and increased healthcare costs [29]. To solve this problem, the American federal food and nutrition programs implemented by the Administration on Aging seek to enable older adults to remain in their homes and communities [30]. These nutrition programs might be effective in maintaining the health condition of older adults, and our study results showed similar results.
- We measured the health condition of participants prior to the project, but we did not measure it after the project owing to the rejection of long-term care institutions. Therefore, we could not evaluate the change in the health condition of participants through this community-based home healthcare project. Although the project’s period was too short to alter the health condition of participants, this was a limitation of this study and requires a further study for a detailed evaluation of the health condition of participants through the community-based home healthcare project.
- Originally, the Korean Ministry of Health and Welfare planned a 6-month pilot project for this community-based home healthcare service, but the preparatory period took a longer time than expected. In addition, a number of long-term care institutions applied for this project, and therefore, the government took a longer time to evaluate the ability of the operation agencies. It also took time to link operation agencies and service providers, because long-term care institutions did not have a wide network with service providers prior to this project. Therefore, they had to make a new service network with various service providers for this project, which took time. The Ministry of Health and Welfare defined the total project period until December 2012 due to their policy situation, and therefore, we had only 3 months to complete the project; however, it is anticipated that the government will develop a new project based on the results of this project in the near future.
- According to our study, the long-term care services’ increase rate had a slight increase than other services. Under the Korean long-term care insurance, long-term care services can be provided through the registration of national long-term care insurance system, and it might be a reason for the little increase in the rate of long-term care service through this project. In addition, there was a difference in the increase rate of health and medical service between long-term care insurance beneficiaries and nonbeneficiaries, and nonbeneficiaries’ service increase rate was higher than that of the beneficiaries. However, we could not even distribute the sample size in long-term care beneficiaries and nonbeneficiaries, because participants were recruited by the long-term care institutions and not by the research institute. Therefore, there was a different characteristic between long-term care beneficiaries and nonbeneficiaries, and this was another the limitation of this study.
- Our project’s major byproduct was an internet-based community-based home healthcare system, and we developed the system for 6 months. We could observe the project’s progress situation by this system, and analyzed the project’s performance in real time. Every interested party was satisfied with this system, which monitors the performance of the project’s operation agencies, and this system might be used by other community-based home healthcare services as well.
- Consequently, our community-based home healthcare project could improve the service implementation for older adults and there was a difference in health and medical services’ increase rate between Korean national long-term care insurance beneficiaries and nonbeneficiaries. The most increased community-based home healthcare service was nutrition management and the least increased service was visit care that provided the national long-term care insurance system.
Discussion
-
Acknowledgements
- This work was supported by the Korean Ministry of Health and Welfare (2012-374).
Acknowledgments
-
This is an Open Access article distributed under the terms of the Creative Commons Attribution Non-Commercial License (http://creativecommons.org/licenses/by-nc/3.0) which permits unrestricted non-commercial use, distribution, and reproduction in any medium, provided the original work is properly cited.
Article information
- 1. Wong Y.C., Leung J.. Long-term care in China: issues and prospects. J Gerontol Soc Work 55(7). 2012;570−586. PMID: 22963116.ArticlePubMed
- 2. Kietzman K.G., Durazo E.M., Torres J.M., Choi A.S., Wallace S.P.. Independence at risk: older Californians with disabilities struggle to remain at home as public supports shrink. Policy Brief UCLA Cent Health Policy Res 2011 Dec;(PB2011–10):1–8.
- 3. Spira A.P., Covinsky K., Rebok G.W., Stone K.L., Redline S., Yaffe K.. Objectively measured sleep quality and nursing home placement in older women. J Am Geriatr Soc 60(7). 2012 Jul;1237−1243. PMID: 22702839.ArticlePubMed
- 4. Tarride J.E., Guo N., Hopkins R.. The burden of illness of osteoporosis in Canadian men. J Bone Miner Res 27(8). 2012 Aug;1830−1838. PMID: 22461152.ArticlePubMed
- 5. Leung D.Y., Leung A.Y., Chi I.. A psychometric evaluation of a negative mood scale in the MDS-HC using a large sample of community-dwelling Hong Kong Chinese older adults. Age Ageing 41(3). 2012 May;317−322. PMID: 22126988.ArticlePubMed
- 6. Depalma G., Xu H., Covinsky K.E., Craig B.A., Stallard E., Thomas J. 3rd. Hospital readmission among older adults who return home with unmet need for ADL disability. Gerontologist 53(3). 2013 Jun;454−461. PMID: 22859438.ArticlePubMed
- 7. Foglia E., Restelli U., Napoletano A.M., Coclite D., Porazzi E., Bonfanti M.. Pressure ulcers management: an economic evaluation. J Prev Med Hyg 53(1). 2012 Mar;30−36. PMID: 22803317.PubMed
- 8. Kirkevold M., Moyle W., Wilkinson C., Meyer J., Hauge S.. Facing the challenge of adapting to a life ‘alone’ in old age: the influence of losses. J Adv Nurs 69(2). 2013 Feb;394−403. PMID: 22524167.ArticlePubMed
- 9. Brereton L., Gardiner C., Gott M., Ingleton C., Barnes S., Carroll C.. The hospital environment for end of life care of older adults and their families: an integrative review. J Adv Nurs 68(5). 2012 May;981−993. PMID: 22211398.ArticlePubMed
- 10. Chau P.H., Wong M., Woo J.. Challenge to long term care for the elderly: cold weather impacts institutional population more than community-dwelling population. J Am Med Dir Assoc 13(9). 2012 Nov;788−793. PMID: 22985623.ArticlePubMed
- 11. McCusker J., Roberge D., Ciampi A.. Outcomes of community-dwelling seniors vary by type of emergency department. Acad Emerg Med 19(3). 2012 Mar;304−312. PMID: 22435863.ArticlePubMed
- 12. Portegijs E., Buurman B.M., Essink-Bot M.L., Zwinderman A.H., de Rooij S.E.. Failure to regain function at 3 months after acute hospital admission predicts institutionalization within 12 months in older patients. J Am Med Dir Assoc 13(6). 2012 Jul;569e1–e7. PMID: 22572555.Article
- 13. Wysocki A., Butler M., Kane R.L., Kane R.A., Shippee T., Sainfort F.. Long-term care for older adults: a review of home and community-based services versus institutional care [Internet]. Report No.: 12(13)-EHC134-EF. 2012. Agency for Healthcare Research and Quality (US); Rockville: [accessed November 2012].
- 14. McCormack B., Roberts T., Meyer J., Morgan D., Boscart V.. Appreciating the ‘person’ in long-term care. Int J Older People Nurs 7(4). 2012 Dec;284−294. PMID: 23164250.ArticlePubMed
- 15. Kamegaya T.. Long-Term-Care Prevention Team of Maebashi City, Maki Y, Yamagami T, Yamaguchi T, Murai T, Yamaguchi H. Pleasant physical exercise program for prevention of cognitive decline in community-dwelling elderly with subjective memory complaints. Geriatr Gerontol Int 12(4). 2012 Oct;673−679. PMID: 22469534.ArticlePubMed
- 16. Zijlstra G.A., van Haastregt J.C., Kempen G.I.. “A matter of balance—Netherlands”: an effective intervention to reduce concerns about falls and related avoidance of activity in older people. Tijdschr Gerontol Geriatr 43(4). 2012 Sep;164−174. PMID: 23082409.ArticlePubMed
- 17. Dubuc N., Dubois M.F., Raîche M., Gueye N.R., Hébert R.. Meeting the home-care needs of disabled older persons living in the community: does integrated services delivery make a difference? BMC Geriatr 11:2011 Oct;67PMID: 22029878.ArticlePubMed
- 18. Ishida T., Tachibana H., Ito A., Yoshioka H., Arita M., Hashimoto T.. Clinical characteristics of nursing and healthcare-associated pneumonia: a Japanese variant of healthcare-associated pneumonia. Intern Med 51(18). 2012;2537−2544. PMID: 22989823.ArticlePubMed
- 19. Iecovich E.. The long-term care insurance law in Israel: present and future. J Aging Soc Policy 24(1). 2012;77−92. PMID: 22239283.ArticlePubMed
- 20. Wellens N.I., Flamaing J., Moons P., Deschodt M., Boonen S., Milisen K.. Translation and adaption of the interRAI suite to local requirements in Belgian hospitals. BMC Geriatr 12:2012 Sep;53PMID: 22958520.ArticlePubMed
- 21. Ku L.J., Liu L.F., Wen M.. Trends and determinants of informal and formal caregiving in the community for disabled elderly people in Taiwan. Arch Gerontol Geriatr 56(2). 2013 Mar–Apr;370−376. PMID: 23218520.ArticlePubMed
- 22. Foebel A.D., Hirdes J.P., Heckman G.A.. Caregiver status affects medication adherence among older home care clients with heart failure. Aging Clin Exp Res 24(6). 2012 Dec;718−721. PMID: 22732397.ArticlePubMedPDF
- 23. Abbott K.M., Bettger J.P., Hanlon A., Hirschman K.B.. Factors associated with health discussion network size and composition among elderly recipients of long-term services and supports. Health Commun 27(8). 2012 Nov;784−793. PMID: 22292979.ArticlePubMed
- 24. Richardson T.M., Friedman B., Podgorski C., Knox K., Fisher S., He H., Conwell Y.. Depression and its correlates among older adults accessing aging services. Am J Geriatr Psychiatry 20(4). 2012 Apr;346−354. PMID: 22434017.ArticlePubMed
- 25. Hoi le V., Thang P., Lindholm L.. Elderly care in daily living in rural Vietnam: need and its socioeconomic determinants. BMC Geriatr 11:2011 Dec;81PMID: 22136507.ArticlePubMed
- 26. Robison J., Shugrue N., Porter M., Fortinsky R.H., Curry L.A.. Transition from home care to nursing home: unmet needs in a home- and community-based program for older adults. J Aging Soc Policy 24(3). 2012;251−270. PMID: 22720886.ArticlePubMed
- 27. Shibui Y., Murayama H., Kawashima T.. Classification of Japanese elderly in an urban area at risk of becoming homebound: knowledge for improving prevention strategies. Nihon Koshu Eisei Zasshi 58(11). 2011 Nov;935−947. [Article in Japanese]. PMID: 22352066.PubMed
- 28. Möhler R., Richter T., Köpke S., Meyer G.. Interventions for preventing and reducing the use of physical restraints in long-term geriatric care—a Cochrane review. J Clin Nurs 21(21–22). 2012 Nov;3070−3081. PMID: 22978254.ArticlePubMed
- 29. Skates J.J., Anthony P.S.. Identifying geriatric malnutrition in nursing practice: the Mini Nutritional Assessment (MNA®)-an evidence-based screening tool. J Gerontol Nurs 38(3). 2012 Mar;18−27. PMID: 22329392.Article
- 30. Buys D.R., Borch C., Kilgore M., Zizza C.A., Locher J.L.. A state-level examination of the association between home and community-based services and rates of nursing home residency with special attention to nutrition programs. J Nutr Gerontol Geriatr 31(4). 2012 Oct;404−424. PMID: 23157217.ArticlePubMed
References
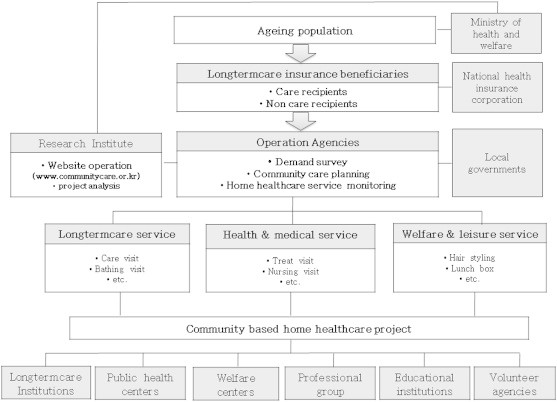
Figure & Data
References
Citations
- Perceived availability of home‐ and community‐based services and self‐reported depression among Chinese older adults: A cross‐sectional study
Yushan Yu, Jun Zhang, Chao Song, Mirko Petrovic, Xiaomei Pei, Wei‐Hong Zhang
Health & Social Care in the Community.2022;[Epub] CrossRef - Community-based health financing: empirical evaluation of the socio-demographic factors determining its uptake in Awka, Anambra state, Nigeria
Felix O. Iyalomhe, Paul O. Adekola, Giuseppe T. Cirella
International Journal for Equity in Health.2021;[Epub] CrossRef - Factors Influencing Burnout in Primary Family Caregivers of Hospital-based Home Care Patients
Ju Ok Yang, Hye Kyung Lee
Journal of Korean Academy of Community Health Nurs.2018; 29(1): 54. CrossRef - A Systematic Literature Review Comparing Primary and Community Health Care Indicators and Measurement Frameworks
Nour El Kadri, Liam Peyton
Procedia Computer Science.2017; 113: 384. CrossRef - Economic Effect of Home Health Care Services for Community-dwelling Vulnerable Populations
Eunhee Lee, Jinhyun Kim
Journal of Korean Academy of Nursing.2016; 46(4): 562. CrossRef
 PubReader
 Cite
Cite
