
Articles
- Page Path
- HOME > Osong Public Health Res Perspect > Volume 4(1); 2013 > Article
-
Original Article
Willingness to Pay for Avoiding Infection of Climate Change Diseases, in Particular Tsutsugamushi Disease - Hae-Chun Rhee
-
Osong Public Health and Research Perspectives 2013;4(1):16-20.
DOI: https://doi.org/10.1016/j.phrp.2012.12.003
Published online: February 28, 2013
School of Economics, Sungkyunkwan University, Seoul, Korea.
- E-mail: rheehc@skku.edu, rheehc@gmail.com
• Received: December 17, 2012 • Revised: December 21, 2012 • Accepted: December 22, 2012
Copyright ©2013, Korea Centers for Disease Control and Prevention
This is an Open Access article distributed under the terms of the Creative Commons Attribution Non-Commercial License (http://creativecommons.org/licenses/by-nc/3.0) which permits unrestricted non-commercial use, distribution, and reproduction in any medium, provided the original work is properly cited.
Abstract
-
Objectives:
- As the prevalence of tsutsugamushi disease has tripled over the past decade to affect 8307 people in October 2012, this study is conducted to estimate the willingness to pay (WTP) to avoid infection of tsutsugamushi disease in order to analyze the loss of value caused by climate change diseases.
-
Methods:
- The double-bounded dichotomous choice of contingent valuation method was used to estimate the WTP to avoid infection of tsutsugamushi disease, through surveys conducted in the patient group (n = 120) and the control group (n = 240).
-
Results:
- More young people in the family, higher level of awareness of risks caused by climate change, more male members (as opposed to female), higher income, lower suggested bid, and greater WTP, is better positioned to avoid infection of disease. The mean of the amount of WTP has been estimated to be 3689 Kwon per month.
-
Conclusion:
- As people have become increasingly aware of climate change diseases, WTP to avoid infection of tsutsugamushi disease has increased accordingly. The implicit loss of value due to climate change diseases is becoming increasingly higher. Therefore, there should be stronger and more aggressive promotional activities to prevent people from being infected with tsutsugamushi disease and to build a healthier society free from climate change diseases.
- Of the many types of infectious climate change diseases (CCDs) caused by either insects or rodents reported by the World Health Organization (WHO), tsutsugamushi disease is most common in Korea. Although tsutsugamushi has been considered an infectious disease that mostly affects women and the elderly in agricultural areas, it has begun to spread across the country and across different age groups. The number of patients infected tsutsugamushi (based on patient reports) grew sharply from 2637 in 2001 to 6780 in 2005, after which the number fell moderately over next several years but grew again rapidly to 8307 (as estimated in October 2012). The number of persons infected by tsutsugamushi increased more than three times during the period 2001–2012. The prevalence of this disease in Korea has been on a steady rise over the past few years (Figure 1). As indicated by the WHO, the reason for such high prevalence of tsutsugamushi disease is climate change.
- One of the major methods used to estimate the loss caused by diseases is the contingent valuation (CV) method that encompasses all the implicit values. Diener et al [1] compared research results based on the CV method, while Yen et al [2] estimated the value of vaccines used to block the infection of SARS in Taiwan. Krupnick et al [3] analyzed the loss of value caused by death-causing diseases in Ontario, Canada. Alberini et al [4] estimated the WTP for the value of a statistical life in EU countries such as the UK, Italy, and France. The CV method was used for estimating the loss of social values due to avian influenza and other zoonotic diseases in Korea [5–7]. This study analyzed the social loss caused by tsutsugamushi disease in Korea and aimed at making policy suggestions on prevention and control of the CCDs, including tsutsugamushi disease, which is one of the major CCDs in Korea affecting a growing number of patients.
Introduction
- 2.1. Survey
- The contents of a face-to-face survey included questions regarding explanation on damage caused by tsutsugamushi disease, awareness of human safety (risks), awareness about the CCDs, WTP to avoid infection from these diseases, and the respondent’s characteristics. In order to provide respondents with information on tsutsugamushi disease, two explanation cards were used. Card 1 had detailed information on the infection route, treatment, prevention, and symptoms of tsutsugamushi disease, while Card 2 had cartoons to help people understand tsutsugamushi disease better.
- The survey procedures included training the survey conductors, performing pilot tests, and conducting face-to-face survey during January–April 2012.
- The stratified sampling method was used to select samples from patients at local public health centers across different age, regions (provinces in agricultural regions), gender, and education groups. The control group sample was selected randomly, considering demographic characteristics of the patient group. The patient group had 120 patients and the control group 240 patients. Among them, 114 patients in the patient group and 231 in the control group—a total of 345 patients—participated in the survey. The grades of first suggested bids were 1000, 5000, 10,000, and 50,000 Kwon.
- 2.2. Statistical model
- WTP to avoid infection of tsutsugamushi disease was estimated based on the double-bounded dichotomous choice (DBDC) CV method. DBDC questions were formed and asked in the following way [8–10]: The first bid (B) was suggested to the respondent (i). If the respondent was willing to pay the first bid (responded “yes”), then a higher second bid (
where πyy(Bi;
(1)
- The log-logistic cumulative distribution function, F(B; θ) is established as follows: where α is a constant, xi is the vector for the characteristics of respondents, and β is the coefficient parameter vector of xi; βbid is the coefficient parameter of ln B and B is the bid that has a positive value. F(B) is the logistic distribution function or the normal distribution function.
- If we create a log probability function by transforming the response probability of each respondent by applying parameters conditionally in Equations (1) and (2), the probability of observing a specific response observation (1, …, N) from a specific N number of respondents can be expressed by the following likelihood function:
where N is the number of observations, and
- The maximum likelihood estimator of parameter θ is the θ value maximizing the value of the likelihood function in Equation (3). This requires finding the maximum value of the log likelihood function ln L(θ) by setting the differential value of θ at “0”. The calculation is as follows:
- If we substitute vector xi, which is composed of the estimated parameters and the mean of each attribute in Equation (2), we can calculate the acceptance probability of the bid amount B of an average respondent. This probability function is hypothesized using the logistic (or normal) function.
- The mean is generally calculated through the integral calculus of the probability function for the total WTP. However, if this function converges to “0”, the mean value may diverge, so in some cases the truncated mean is used [11,12]. If the acceptance probability of each bid amount B of average respondents is S(WTP) and the acceptance probability of the maximum bid amount is S(WTPMAX), the adjust truncated mean is calculated as follows:
- The median of WTP is used to facilitate a comparison with the mean value. The median can be calculated using the relation in Equation (6):
- The confidence interval for the representative value is estimated using the bootstrap method based on resampling. In this study, WTP to avoid infection of tsutsugamushi disease was estimated in the above method using the program Limdep 8.0.
Materials and Methods
- 3.1. Characteristics of respondents and awareness of CCD
- Of 114 respondents in the patient group, 69% of the patients were aged 60s and older, while 27% and 3% were in their 50s and 40s, respectively. The patient group and the control group A had the same age composition, but the control group B sample was selected randomly. The average monthly income of the respondents was 1.78 million won; average monthly income of the patient group (1.68 million won) was smaller than that of the control group (1.84 million won).
- An analysis of the respondents’ or their family members’ exposure to CCDs over the past 3 years demonstrated that about 7.7% of the respondents were exposed to CCDs during the period; among them 13.4% in the patient group and 10.5% in the control group said that they were exposed to CCDs caused by flooding/ draught, followed by diseases caused by high temperature (heat wave) and air pollution. The respondents who said that they were exposed to vector-borne diseases accounted for the lowest proportion at less than 2%.
- 3.2. Results of WTP estimation
- In the patients group, 44.7% of the patients were willing to pay, while 53% and 51.7% of the respondents in the control groups A and B, respectively, were willing to pay to avoid infection of tsutsugamushi disease.
- The variables used for WTP estimation were the degree of awareness of CCDs, level of understanding of the burden-sharing system, demographic characteristics, incomes, and the suggested amount of bid (Table 1).
- WTP for avoiding to tsutsugamushi disease was estimated using the WTP equation. The dependent variable was to accept the suggested bid or not (yes = 1, no = 0). Let us take a look at t test statistics indicating the significance of the estimated valuables. Variables such as level of understanding of the burden-sharing system (UND), income level (INCL), and suggested bid (BID) are significant at the 95% confidence level, while experience of CCD and the number of young family (FA18) are significant at the 90% confidence level.
- The results of WTP estimation (Table 2) demonstrate that respondents with a better understanding of the burden-sharing system, higher number of family members under the age of 18, higher level of awareness of risks associated with CCD, higher income level, lower suggested bid have increased willingness to pay.
- Figure 2 presents a probability curve showing the WTP to avoid infection of tsutsugamushi disease. The x-axis shows the suggested bid and y-axis the probability of acceptance of bids. The integral value of the probability curve indicates the average WTP value.
- The mean WTP value was estimated to be 4368 Kwon/mo, the truncated mean 3689 won/mo, and the median value 1194 won/mo. The difference between the mean value and the median value is huge, indicating that the acceptance rate falls drastically when the suggested bid gets higher. Hence, the truncated mean value can be chosen as a representative WTP value (Table 3).
Results
- Results of this study and the previous studies were compared to examine changes over time. In the research on WTP estimation conducted by Rhee et al [7], which used the CV method, the WTP value for avoiding infection of tsutsugamushi disease was estimated to be 2918 won/mo. A comparison of the results of this study indicates that people have become increasingly aware of tsutsugamushi disease and are increasingly willing to pay to avoid its infection. Considering the fact that tsutsugamushi disease is increasingly being considered to be one of the major CCDs in Korea, it can be inferred that the loss of value caused by CCD has increased in recent years.
- In another research by Rhee and Lim [5], the WTP value to avoid avian influenza was found to be 6399 Kwon/mo in Korea, while in the study by Kim et al [6] WTP to avoid infection of brucellosis was estimated to be 9149 won/mo. These research results highlight the fact that the loss of value caused by CCDs is highest for brucellosis (9149 won/mo), followed by avian influenza (6399 won/mo) and tsutsugamushi (3689 won/mo). Such results are related to the effects of CCDs on preventive medicines, industry, and economy. That is, zoonoses affect both humans and animals through various infection routes and hence can spread at a much faster rate than other infectious diseases, thus having more significant effects on the society and economy.
- When compared with previous researches conducted using the CV method, it is clear that people have become increasingly aware of tsutsugamushi disease over the past 3 years and the amount they are willing to pay to avoid infection has increased accordingly, indicating that the loss of social and economic values caused by CCDs is increasing. Moreover, a comparison of various CCDs shows that the loss of social and economic values caused by zoonoses such as brucellosis and avian influenza, which are increasingly affecting a larger number of people, is relatively bigger than that caused by vector-borne diseases such as tsutsugamushi disease.
- As indicated in the study results, although tsutsugamushi disease is increasingly affecting urban regions, it is mostly prevalent among those who work outside in rural agricultural areas. Although the number of tsutsugamushi patients decreased slightly over the past few years, thanks to strong prevention efforts, it increased rapidly in 2012 due to abnormal weather conditions. Strong disease prevention efforts and campaigns also helped boost people’s awareness on CCDs, making people willing to pay more to avoid infection of tsutsugamushi disease or the implicit loss caused by CCDs.
Discussion
-
Acknowledgements
- This work was supported by the National Research Foundation of Korea Grant funded by the Korean Government (NRF-2011-358-B00007).
- 1. Diener A, O’Brien B, Gafni A. Health care contingent valuation studies: a review and classification of the literature. Health Econ 1998;6;7(4). 313−26. PMID: 9683092.ArticlePubMed
- 2. Yen ZS, Chang CJ, Chen SY, et al. How much would you be willing to pay for preventing a new dangerous infectious disease: a willingness-to-pay study in medical personnel working in emergency department. Am J Infect Control 2007;10;35(8). 516−20. PMID: 17936142.ArticlePubMedPMC
- 3. Krupnick A, Alberini A, Cropper M, et al. Age, health and the willingness to pay for mortality risk reductions: a contingent valuation survey of Ontario residents. J Risk Uncertainty 2002;3;24(2). 161−86.Article
- 4. Alberini A, Hunt A, Markandya A. Willingness to pay to reduce mortality risks: evidence from a three-country contingent valuation study. Environ Resource Econ 2006;2;33(2). 251−64.Article
- 5. Rhee HC, Lim HS. The economic cost of zoonoses: in the case of avian influenza. Korean J Health Econ Policy 2007;6;13(1). 19−40. Korean..
- 6. Kim TJ, Rhee HC, Lim HS. Socio-economic Assessment of Loss Brucella. Seoul: KNIH; 2007. Jul.;Korean..
- 7. Rhee HC, Kim JH, Lee E. Estimation of willingness to pay for avoiding infection of Tsutsugamushi disease in Korea: using contingent valuation method. Korean J Health Econ Policy 2009;6;15(1). 131−55. Korean..
- 8. Carson RT. Three essays on contingent valuation. Berkeley: Ph. D. thesis, University of California;. 1985.
- 9. Hanemann WM. Some issues in continuous and discrete response contingent valuation studies. Northeast J Agric Econ 1985;4;14(1). 5−13.Article
- 10. Hanemann WM, Loomis JB, Kanninen B. Statistical efficiency of double-bounded dichotomous choice contingent valuation. Am J Agric Econ 1991;11;73(4). 1255−63.Article
- 11. Bishop RC, Heberlein TA. Measuring values of extramarket goods: are indirect methods biased? Am J Agric Econ 1979;12;61(5). 926−30.Article
- 12. Seller C, Stoll JR, Chavas JP. Validation of empirical measures of welfare change: a comparison of nonmarket techniques. Land Econ 1985;5;61(2). 156−75.Article
References
Figure 1Change in the number of tsutsugamushi disease patients. Note. From Korea Centers for Disease Control and Prevention, infectious disease website.
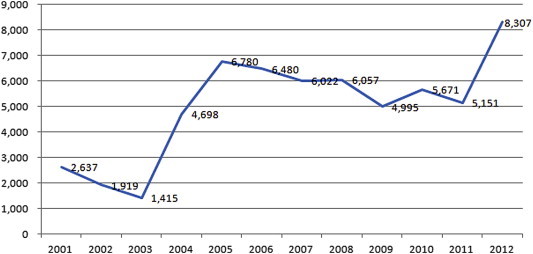
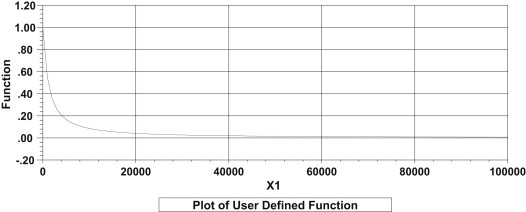
Table 1Basic statistics of major variables
Table 2Results of WTP estimation
Figure & Data
References
Citations
Citations to this article as recorded by 
- Consumers's willingness to pay for avoiding Salmonella infection
Á. Vajda, Cs. Mohácsi-Farkas, L. Ózsvári, Gy. Kasza
Acta Alimentaria.2020; 49(1): 76. CrossRef - A Case of Scrub Typhus Related Encephalopathy Presenting as Rapidly Progressive Dementia
Jeong Hoon Park, Jae-Won Jang, Seung-Hwan Lee, Won Sup Oh, Sam Soo Kim
Dementia and Neurocognitive Disorders.2017; 16(3): 83. CrossRef - Geographical Distribution and Seasonal Indices of Chigger Mites on Small Mammals Collected on the East Coast of the Republic of Korea
Gab-Man Park, Ho-Sung Shin
Journal of Parasitology.2016; 102(2): 193. CrossRef - Integrated framework for the external cost assessment of nuclear power plant accident considering risk aversion: The Korean case
Sang Hun Lee, Hyun Gook Kang
Energy Policy.2016; 92: 111. CrossRef - The Geographical and Economical Impact of Scrub Typus, the Fastest-growing Vector-borne Disease in Korea
Hae-Wol Cho, Chaeshin Chu
Osong Public Health and Research Perspectives.2013; 4(1): 1. CrossRef
 PubReader
 Cite
Cite

