
Articles
- Page Path
- HOME > Osong Public Health Res Perspect > Volume 6(2); 2015 > Article
-
Original Article
Effects of Fenugreek Seed Extract and Swimming Endurance Training on Plasma Glucose and Cardiac Antioxidant Enzymes Activity in Streptozotocin-induced Diabetic Rats - Sajad Arshadia, Salar Bakhtiyarib, Karimeh Haghanib, Ahmad Valizadehc
-
Osong Public Health and Research Perspectives 2015;6(2):87-93.
DOI: https://doi.org/10.1016/j.phrp.2014.12.007
Published online: February 19, 2015
aDepartment of Exercise Physiology, Faculty of Physical Education, Islamic Azad University, South Tehran Branch, Tehran, Iran
bDepartment of Clinical Biochemistry, Faculty of Medicine, Ilam University of Medical Sciences, Ilam, Iran
cKhatamal Al-Anbia University of Technology, Behbahan, Iran
- ∗Corresponding author. bakhtiyaribio@gmail.combakhtiyari-s@medilam.ac.ir
© 2015 Published by Elsevier B.V. on behalf of Korea Centers for Disease Control and Prevention.
This is an Open Access article distributed under the terms of the CC-BY-NC License (http://creativecommons.org/licenses/by-nc/3.0).
Abstract
-
Objective
- Diabetes mellitus is a group of metabolic diseases characterized by chronic hyperglycemia condition resulting from defective insulin secretion or resistance insulin action, or both. The purpose of this study was to evaluate the effect of 6 weeks swimming training and Trigonella foenum-graecum seed (fenugreek) extract, alone and in combination, on plasma glucose and cardiac antioxidant enzyme activity of streptozotocin-induced diabetic rats.
-
Methods
- Fifty male Wistar rats were divided into five groups: diabetic control (DC, n = 8); healthy control (HC, n = 11); swimming training (S, n = 11); swimming training + fenugreek seed extract (1.74 g/kg body weight; SF1, n = 11); and swimming training + fenugreek seed extract (0.87 g/kg body weight; SF2, n = 9). Streptozotocin was used for the induction of diabetes. Results were analyzed using one-way analysis of variance followed by Tukey test.
-
Results
- In comparison with the DC group, all groups exhibited a significant decrease in body weight (p < 0.05), except for the HC group. SF1 and HC groups showed significant decreases in plasma glucose levels compared with the DC group (p < 0.05). S, SF1, SF2, and HC groups showed significant elevations in cardiac antioxidant enzymes activity in comparison with the DC group.
-
Conclusion
- The results indicated that the combination of endurance swimming training and fenugreek seed extract can significantly reduce the plasma glucose levels and increase cardiac antioxidant enzymes activity in diabetic rats. Our findings suggest that this combination could be useful for the treatment of hyperglycemia and cardiac oxidative stress induced by diabetes mellitus.
- Diabetes mellitus is a group of metabolic diseases characterized by hyperglycemia resulting from defects in insulin secretion or insulin action, or both [1]. Hyperglycemia may perturb cellular antioxidant defense systems and damage cells. Free radicals are formed disproportionately in diabetes by glucose oxidation, nonenzymatic glycation of proteins, and the subsequent oxidative degradation of glycated proteins. Oxidative stress plays an important role in the etiology of diabetes and diabetic complications [2]. Oxidative stress may constitute a focal point for multiple therapeutic interventions, and for therapeutic synergy. There is considerable evidence that oxidative stress from superoxide and other reactive oxygen species (ROS) contributes to the development of cardiovascular diseases, diabetes, and renal insufficiency [3]. Ihara et al [4] examined oxidative stress marked in diabetic rats and found increased ROS in pancreatic islets. Cells continuously produce free radicals and ROS as part of metabolic processes. These free radicals are neutralized by an elaborate antioxidant defense system consisting of enzymes such as catalase, superoxide dismutase, and glutathione peroxidase [4].
- Diabetes is associated with significant oxidative stress, and oxidative damage to tissues may be a contributory factor in several diabetic complications [5]. Diabetic patients have an increased incidence of vascular disease and it has been shown that oxidative stress elevated during diabetes [6]. Abnormally high levels of free radicals and the simultaneous decline of antioxidant defense mechanisms can lead to damage of cellular organelles and enzymes, increased lipid peroxidation, and development of insulin resistance [7].
- Much controversy exists concerning the effects of endurance training on the oxidative status and antioxidant defense systems of the myocardium, which may decrease, increase, or even remain unchanged [8,9]. Some controversy might arise from the different methodologies used for determinations, and differences in the models employed (running vs. swimming, rats vs. mice, male vs. female). Among various forms of treatments for diabetes mellitus, exercise and diet are of vital importance. The hypoglycemic effects of fenugreek seed have been studied in many animal model systems [10,11], as well as in humans in diabetic patients [12], but the results were controversial. In addition, fenugreek seeds have been shown to possess an encouraging antioxidant property [13] and can be a valuable candidate in the treatment and prevention of diabetes complications.
- In several previous studies, the effects of training and fenugreek seed extract on the metabolic traits of diabetes were examined alone, and the results were controversial. To our knowledge, this is the first study to evaluate the effect of physical exercise and fenugreek seed extract in combination on the cardiac antioxidants in diabetic rats.
Introduction
- 2.1 Animals
- Fifty male Wistar albino rats, weighing 200–250 g, and averaging 12 weeks old were used in this study. They were housed in metal cages under standard laboratory condition (12:12 hours light–dark cycle and were fed regular pellets and distilled water ad libitum. The room had a temperature of 20–25°C, humidity of 50–60%, and average luminance of 150–200 lux in the daytime. The rats were randomly divided into five groups: (1) swimming training-fenugreek extract [1.74 g/kg body weight (BW); SF1, n = 11]; (2) swimming training (S, n = 11); (3) swimming training-fenugreek extract (0.87 g/kg BW; SF2, n = 9); (4) healthy control (HC, n = 11); and (5) diabetic control (DC, n = 8) this group received normal saline (5 mL/kg BW). Fenugreek and saline were treated orally by gastric gavage separately. The procedures used were in accordance with the guiding principle of the responsible committee for the care and use of animals.
- 2.2 Induction of diabetes
- After fasting for 12 hours, the animals received an intraperitoneal injection (60 mg/kg BW) of streptozotocin (STZ; Sigma–Aldrich, St Louis, MO, USA), diluted in 1.0 mL of sodium citrate buffer (0.1M, pH 4.5). Seven days after application of STZ and fasting for 12 hours, blood glucose was measured. Blood samples were collected by tail nipping and assessed for glucose by an electronic glucometer. Animals with levels of fasting blood glucose above 300 mg/dL were considered diabetic. Fasting blood glucose and BW were monitored at the beginning and end of the experimental period.
- 2.3 Plant material
- Fenugreek seeds were purchased from the local herbal market, cleaned, dried, and finely powdered in a grinding machine. The powdered fenugreek (1.5 kg) was boiled in 15 L distilled water for 30 minutes. The decoction was cooled for 30 minutes at room temperature, then filtered twice through a coarse sieve. Finally, the filtrate was concentrated by flash evaporation at 358°C to a thick paste (total 300 g).
- 2.4 Endurance training program
- The swimming training protocol was conducted in two phases, adaptation and training. The adaptation phase consisted of the first 7 days of training. On the 1st day, the animals exercised in a round plastic tank (140 cm × 60 cm × 45 cm, water temperature 34–36°C) for 10 minutes. The exercise period was extended by 10 minutes every day until the rats could swim for 60 minutes. The training phase consisted of swimming 60 min/d, 5 d/wk for a total of 6 weeks. Swimming exercise was selected because it does not cause foot injuries, and is physically less traumatic for the animal.
- 2.5 Heart tissue and plasma preparation
- At the end of the training programs, 24 hours after the last exercise-training session and 12 hours fasting, the rats were weighed, sacrificed by decapitation and then blood samples were obtained from the heart and collected into EDTA tubes. The blood was centrifuged for 10 minutes at 1500 g at 4°C. Plasma was separated carefully in tubes and then stored at −80°C until analysis.
- The heart was quickly removed, washed with ice-cold saline, and blotted. After removing atria and great blood vessels, the ventricles were weighed, and the apex was cut and quickly frozen in liquid nitrogen. The duration of this process was < 2 minutes. Cardiac homogenates were prepared at 4°C. Ventricle muscle (50 mg) was homogenized on ice in 1 mL of ice-cold lysis buffer (10mM NaCl, 1.5mM MgCl2, 20mM HEPES, 20% glycerol, 0.1% Triton X-100, and 1mM dithiothreitol, pH 7.4). Tissue homogenates were centrifuged at 1500 g for 10 minutes at 4°C. The supernatants containing the cytoplasmic protein fraction were collected and protease inhibitor cocktail (104mM AEBSF, 0.08mM aprotinin, 2mM leupeptin, 4mM bestatin, 1.5mM pepstatin A, and 1.4mM E-64; P8340; Sigma–Aldrich) was added to them and stored at −80°C until use.
- 2.6 Plasma glucose measurement
- Plasma glucose was measured by biochemical auto-analyzer system (BT 3000; Biotecnica, Rome, Italy).
- 2.7 Superoxide dismutase activity
- Superoxide dismutase (SOD) activity was determined using a RANSOD kit (Randox Labs, Crumlin, Antrim, UK) according to the method previously described [14]. SOD activity was measured in the supernatant using a spectrophotometer at 505 nm. In this method, xanthin (0.05M) and xanthin oxidase were used to generate superoxide radicals that react with 2-(4 iodophenyl)-3-(4-nitrophenol)-5-phenyl tetrazolium chloride (0.025mM) to form a red formazan dye. SOD was measured by the degree of inhibition of this reaction.
- 2.8 Catalase activity
- Catalase activity (CAT) was measured as previously described by Aebi [15]. The decomposition of H2O2 was followed directly by the decrease in absorbance at 240 nm and 20°C. An adequate amount of supernatant (60 μL for 1.5 mg tissue wet weight) was added to a reaction mixture that contained 0.002% Triton X-100, 0.1mM EDTA, 0.5M potassium phosphate buffer, pH 7.0, and 15mM H2O2 in 1 mL final volume. Activity was calculated with the initial 30 seconds decomposition rate.
- 2.9 Glutathione peroxidase activity
- Glutathione peroxidase (GPX) activity was determined using a RANSEL kit (Randox Labs), according to the method previously described [16]. GPX catalyzes the oxidation of glutathione (at a concentration of 4mM) by cumene hydroperoxide. In the presence of glutathione reductase (at a concentration ≥ 0.5 units/L) and 0.28mM of NADPH, the oxidized glutathione is immediately converted to the reduced form with a concomitant oxidation of NADPH to NAD+. The decrease in absorbance at 340 nm was measured using a spectrophotometer.
- 2.10 Statistical analysis
- All data are presented as means ± standard deviation and analyzed using one-way analysis of variance (ANOVA). A probability value of p < 0.05 was considered statistically significant.
Materials and methods
- In the beginning of the study, there was no significant difference between groups. At the end of treatment, BW was reduced in all groups, except for the HC group. BW reduction was greater in the DC and S groups than other groups (p < 0.05; Table 1).
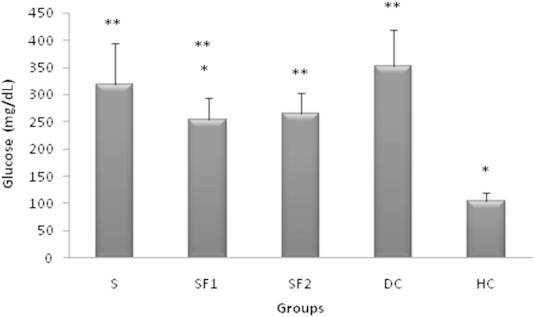
- ANOVA results showed that there was a significant difference in plasma glucose, SOD, CAT, and GPX in between groups (p < 0.05; Table 2).
- The results showed significant differences in plasma glucose concentration between the groups: SF1 versus DC (p = 0.029); HC versus DC (p < 0.001); SF1 versus HC (p = 0.002); S versus HC (p = 0.001); and SF2 versus HC (p = 0.001). The greatest reduction was observed in SF1 and HC groups, as compared with the DC group. In comparison with the HC group, the plasma glucose levels of all other groups were found to be significantly increased (p < 0.05; Figure 1).
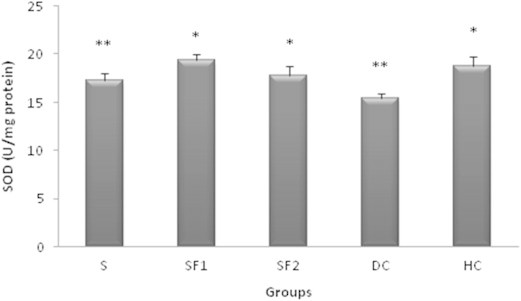
- As shown in Figure 2, we found significant differences between groups for cardiac SOD activity: SF1 versus DC (p < 0.001); S versus DC (p < 0.001); HC versus DC (p < 0.001); SF2 versus DC (p = 0.000), and S versus HC (p = 0.002; Figure 2). The maximum SOD activity was observed in the SF1 group, and it was approximately equal to the HC group.
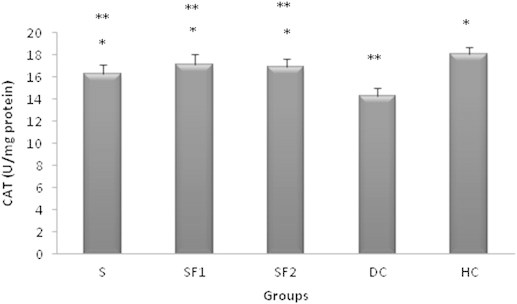
- The results indicated that there were significant differences between the groups with respect to the cardiac CAT activity; SF1 versus DC (p = 0.001); S versus DC (p = 0.004); HC versus DC (p < 0.001); SF2 versus DC (p = 0.002); S versus HC (p = 0.001); and SF2 versus HC (p = 0.001; Figure 3).
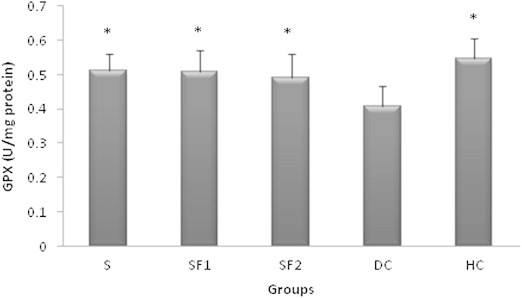
- There were significant differences in cardiac GPX activity between groups; SF1 versus DC (p = 0.008); S versus DC (p = 0.006); HC versus DC (p < 0.001); and SF2 versus DC (p = 0.04), but no significant difference between other groups was observed (p > 0.05). Thus, significant increase observed at all of the groups other than the DC group (p < 0.05; Figure 4).
Results
- The current study determined the effect of swimming training and fenugreek seed extract combination on plasma glucose and heart tissue antioxidants in diabetic rats. We showed that swimming training and fenugreek seeds extract combination leads to a significant reduction in plasma glucose, as compared with the diabetic control rats (p < 0.05). Treatment with this combination also leads to a significant increase in SOD, CAT, and GPX activities in the heart tissue of diabetic rats, as compared with the diabetic control rats (p < 0.05).
- Diabetic animal models exhibit high oxidative stress due to persistent and chronic hyperglycemia, thereby depleting the activity of the antioxidative defense system and thus promoting free radical generation. It has been recently shown that oxidative stress is responsible, at least in part, for the β-cell dysfunction caused by glucose toxicity. Swimming was chosen as a suitable model since it is a natural behavior of animals. The method causes less mechanical stress and injury, and leads to a better redistribution of blood flow among tissues without significant variations in cardiac output and heart rate, which in turn may minimize the magnitude of injury caused due to the generation of ROS [17]. In agreement with our results, previous study has shown that endurance exercise decrease serum glucose in diabetic animals and humans [18]. Since skeletal muscle responds to endurance exercise via a series of structural and functional adaptations, the increased responsiveness to insulin induced by swimming exercise in rat skeletal muscle may result partly from modulation of the insulin signaling pathway at different molecular levels. In particular, the insulin receptor substrate/phosphatidylinositol-3-kinase pathway may be involved in the activation of glucose transport and glycogen synthesis in muscle, and an increase in this association in the muscle of trained animals and humans may have an important role in the responsiveness to insulin. Hyperglycemia increases the production of ROS through protein glycation and patients with type 1 diabetes mellitus have higher plasma concentrations of free radicals than healthy individuals [19]. In this way, increased glucose level is an important factor implicated in the development of the diabetes-associated complications. Previous researchers analyzed the effects of exercise training on myocardial antioxidant systems, but the overall results are controversial [9,20,21]. To our knowledge, no study has used the combination of endurance swimming training and fenugreek seed extract in combination on plasma glucose and antioxidants in heart tissue of diabetic rats.
- Several studies have shown changes in antioxidant activity in various tissues follow different patterns, which are not yet known. Previous studies have shown increased antioxidant enzymes after endurance training [22–25]. These findings are consistent with our results, but we used combinations of endurance swimming training and fenugreek seed extract, and observed the greater elevation in antioxidant enzymes levels, as compared with those treated with swimming training or extract alone. In contrast to our results, some studies have reported decreased cardiac antioxidant enzymes after endurance training [26,27]. Overall, inconsistent results could be due to some factors such as age, sex and animal breed, different techniques used in the assessment, type of exercise, duration and intensity of exercise, and the tissue used.
- Several mechanisms have been suggested to explain the hypoglycemic action of fenugreek. These include modulation of insulin secretion, insulin-mimetic effect, inhibition of intestinal glucosidase activity, and the presence of coumarins and the alkaloid trigonelline [28]. Therefore, fenugreek may be a secondary mechanism for hypoglycemic and antioxidative stress effect. Overall, the present study provides evidence that the combination of endurance training and fenugreek are capable of influencing plasma glucose and antioxidant enzymes in cardiac muscle of diabetic rats. We showed that this combination increases the extent of antioxidant enzymes in cardiac muscle such that it can lead to decreases in apoptosis in cardiac cells.
Discussion
- The authors declare that they have no competing interests.
Conflicts of interest
-
Acknowledgements
- We thank for Islamic Azad University South Tehran Branch, Tehran, Iran for their great assistance and financial support.
Acknowledgments
-
This is an Open Access article distributed under the terms of the Creative Commons Attribution Non-Commercial License (http://creativecommons.org/licenses/by-nc/3.0) which permits unrestricted non-commercial use, distribution, and reproduction in any medium, provided the original work is properly cited.
Article information
- 1. Braun B., Zimmermann M.B., Kretchmer N.. Effects of exercise intensity on insulin sensitivity in women with non-insulin-dependent diabetes mellitus. J Appl Physiol 78(1). 1995 Jan;300−306. PMID: 7713829.ArticlePubMed
- 2. Baynes J.W., Thorpe S.R.. Glycoxidation and lipoxidation in atherogenesis. Free Radic Biol Med 8(12). 2000 Jun;1708−1716. PMID: 10946212.Article
- 3. Griendling K.K., Ushio-Fukai M.. Reactive oxygen species as mediators of angiotensin II signaling. Regul Pept 91(1–3). 2000 Jul;21−27. PMID: 10967199.ArticlePubMed
- 4. Ihara Y., Yamada Y., Toyokuni S.. Antioxidant alpha-tocopherol ameliorates glycemic control of GK rats, a model of type 2 diabetes. FEBS Lett 473(1). 2000 May;24−26. PMID: 10802052.ArticlePubMed
- 5. Kakkar R., Kalra J., Mantha S.V.. Alterations in antioxidant enzymes and malondialdehyde content diabetic heart: a time course study. Clin Biochem 27(3). 1994 Jan;204. Article
- 6. Oberley L.W.. Free radicals and diabetes. Free Radic Biol Med 5(2). 1988;113−124. PMID: 3075947.ArticlePubMed
- 7. Rochette L., Zeller M., Cottin Y.. Diabetes, oxidative stress and therapeutic strategies. Biochim Biophys Acta 1840(9). 2014 Sep;2709−2729. PMID: 24905298.ArticlePubMed
- 8. Ji L.L.. Exercise, oxidative stress, and antioxidants. Am J Sports Med 24(6 Suppl.). 1996;S20−S24. PMID: 8947419.ArticlePubMed
- 9. Ji L.L.. Antioxidants and oxidative stress in exercise. Proc Soc Exp Biol Med 222(3). 1999 Dec;283−292. PMID: 10601887.ArticlePubMed
- 10. Mohammad S., Taha A., Bamezai R.N.. Lower doses of vanadate in combination with trigonellarestore altered carbohydrate metabolism and antioxidant status in alloxan-diabetic rats. Clin Chim Acta 342(1–2). 2004 Apr;105−114. PMID: 15026271.ArticlePubMed
- 11. Sharma R.D.. Effect of fenugreek seeds and leaves on blood glucose and serum insulin responses in human subjects. Nutr Res 6(12). 1986 Dec;1353−1364.Article
- 12. Sharma R.D., Sarkar A., Hazara D.K.. Use of fenugreek seed powder in the management of non-insulin dependent diabetes mellitus. Nutr Res 16(12). 1996 Aug;1331−1339.Article
- 13. Kaviarasan S., Naik G.H., Gangabhagirathi R.. In vitro studies on antiradical and antioxidant activities of fenugreek (Trigonella foenum graecum) seeds. Food Chem 103(1). 2007 Oct;31−37.Article
- 14. Delmas-Beauvieux M.C., Peuchant E., Dumon M.F.. Relationship between red blood cell antioxidant enzymatic system status and lipoperoxidation during the acute phase of malaria. Clin Biochem 28(2). 1995 Apr;163−169. PMID: 7628075.ArticlePubMed
- 15. Aebi H.. Catalase in vitro. Methods Enzymol 105:1984;121−126. PMID: 6727660.ArticlePubMed
- 16. Paglia D.E., Valentine W.N.. Studies on the quantitative and qualitative characterization of erythrocyte glutathione peroxidase. J Lab Clin Med 70(1). 1967 Jul;158−169. PMID: 6066618.PubMed
- 17. Ravi Kiran T., Subramanyam M.V., Asha Devi S.. Swim exercise training and adaptations in the antioxidant defense system of myocardium of old rats: relationship to swim intensity and duration. Comp Biochem Physiol B Biochem Mol Biol. 137(2). 2004 Feb;187−196. PMID: 14990215.ArticlePubMed
- 18. Gomes R.J., de Mello M.A., Caetano F.H.. Effects of swimming training on bone mass and the GH/IGF-1 axis in diabetic rats. Growth Horm IGF Res 16(5–6). 2006 Oct–Dec;326−331. PMID: 17011807.ArticlePubMed
- 19. Davison G.W., George L., Jackson S.K.. Exercise, free radicals, and lipid peroxidation in type 1 diabetes mellitus. Free Radic Biol Med 33(11). 2002 Dec;1543−1551. PMID: 12446212.ArticlePubMed
- 20. Ascensão A., Magalhães J., Soares J.. Exercise and cardiac oxidative stress. Rev Port Cardiol 22(5). 2003 May;651−678. PMID: 12940180.PubMed
- 21. Atalay M., Sen C.K.. Physical exercise and antioxidant defenses in the heart. Ann N Y Acad Sci 874:1999 Jun;169−177. PMID: 10415530.ArticlePubMed
- 22. Husain K., Hazelrigg S.R.. Oxidative injury due to chronic nitric oxide synthase inhibition in rat: effect of regular exercise on the heart. Biochim Biophys Acta 1587(1). 2002 May;75−82. PMID: 12009427.ArticlePubMed
- 23. Somani S.M., Frank S., Rybak L.P.. Responses of antioxidant system to acute and trained exercise in rat heart subcellular fractions. Pharmacol Biochem Behav 51(4). 1995 Aug;627−634. PMID: 7675835.ArticlePubMed
- 24. Venditti P., Di Meo S.. Antioxidants, tissue damage, and endurance in trained and untrained young male rats. Arch Biochem Biophys 331(1). 1996 Jul;63−68. PMID: 8660684.ArticlePubMed
- 25. Venditti P., Di Meo S.. Effect of training on antioxidant capacity, tissue damage, and endurance of adult male rats. Int J Sports Med 18(7). 1997 Oct;497−502. PMID: 9414071.ArticlePubMed
- 26. Gül M., Atalay M., Hänninen O.. Endurance training and glutathione-dependent antioxidant defense mechanism in heart of the diabetic rats. J Sports Sci Med 2(2). 2003 Jun;52−61. PMID: 24616611.PubMed
- 27. Kihlström M., Ojala J., Salminen A.. Decreased level of cardiac antioxidants in endurance-trained rats. Acta Physiol Scand 135(4). 1989 Apr;549−554. PMID: 2735199.ArticlePubMed
- 28. Petit P., Sauvaire Y., Ponsin G.. Effects of a fenugreek seed extract on feeding behaviour in the rat: Metabolic-endocrine correlates. Pharmacol Biochem Behav 45(2). 1993 Jun;369−374. PMID: 8327543.ArticlePubMed
References
| df | F | p | |
|---|---|---|---|
| Glucose (mg/dL) | 4 | 23.016 | < 0.001 |
| SOD (U/mg protein) | 4 | 23.787 | 0.001 |
| CAT (U/mg protein) | 4 | 21.379 | 0.005 |
| GPX(U/mg protein) | 4 | 6.429 | 0.01 |
Figure & Data
References
Citations
- Anti-inflammatory effects of sericin and swimming exercise in treating experimental Achilles tendinopathy in rat
Koksal Gundogdu, Ozgen Kılıc Erkek, Gulsah Gundogdu, Dilek Sayin, Gulcin Abban Mete
Applied Physiology, Nutrition, and Metabolism.2024; 49(4): 501. CrossRef - Exercise May Increase Oxidative Stress in the Sciatic Nerve in Streptozotocin-Induced Diabetic Rats
Koji Nonaka, Junichi Akiyama, Satsuki Une
Medicina.2024; 60(3): 480. CrossRef - Fabrication and characterization of gold nanoparticles using alginate: In vitro and in vivo assessment of its administration effects with swimming exercise on diabetic rats
Vahideh Hashemzadeh, Alireza Hashemzadeh, Reza Mohebbati, Reza Gharari Arefi, Mohammad Ehsan Taghavizadeh Yazdi
Open Life Sciences.2024;[Epub] CrossRef - Safety and Efficacy of Furosap®, a Patented Trigonella foenum-graecum Seed Extract, in Boosting Testosterone Level, Reproductive Health and Mood Alleviation in Male Volunteers
S. N. Sankhwar, Pawan Kumar, Manashi Bagchi, Mehul Rungta, Debasis Bagchi
Journal of the American Nutrition Association.2023; 42(1): 27. CrossRef - The toxic effects of anabolic steroids “nandrolone decanoate” on cardiac and skeletal muscles with the potential ameliorative effects of silymarin and fenugreek seeds extract in adult male albino rats
Dalia Abd Elwahab Hassan, Sherien S. Ghaleb, Amr reda Zaki, Ahmed Abdelmenem, Shimaa Nabil, Mostafa Abdallah Abdel Alim
BMC Pharmacology and Toxicology.2023;[Epub] CrossRef - Fenugreek and Its Effects on Muscle Performance: A Systematic Review
Waleed I. Albaker
Journal of Personalized Medicine.2023; 13(3): 427. CrossRef - The Impact of Chronic Stress on Behavior and Body Mass in New Animal Models
Anisia Iuliana Alexa, Carmen Lăcrămioara Zamfir, Camelia Margareta Bogdănici, Andra Oancea, Alexandra Maștaleru, Irina Mihaela Abdulan, Daniel Constantin Brănișteanu, Alin Ciobîcă, Miruna Balmuș, Teodora Stratulat-Alexa, Roxana Elena Ciuntu, Florentina Se
Brain Sciences.2023; 13(10): 1492. CrossRef - Cardioprotective effects of exercise preconditioning on ischemia-reperfusion injury and ventricular ectopy in young and senescent rats
Adnan Fatahi, Ebrahim Zarrinkalam, Kamal Azizbeigi, Kamal Ranjbar
Experimental Gerontology.2022; 162: 111758. CrossRef - Protective effects of medicinal plant against diabetes induced cardiac disorder: A review
Sadegh Shabab, Zahra Gholamnezhad, Maryam Mahmoudabady
Journal of Ethnopharmacology.2021; 265: 113328. CrossRef - The Effects of Hydro-Alcoholic Extract of Fenugreek Seeds on the Lipid Profile and Oxidative Stress in Fructose-Fed Rats
Maryam Mohammad-Sadeghipour, Mehdi Afsharinasab, Maryam Mohamadi, Mehdi Mahmoodi, Soudeh Khanamani Falahati-pour, Mohammad Reza Hajizadeh
Journal of Obesity & Metabolic Syndrome.2020; 29(3): 198. CrossRef - Dose-dependent effects of fenugreek seed extract on the biochemical and haematological parameters in high-fat diet-fed rats
Takkella Nagamma, Anjaneyulu Konuri, Chandrika D. Nayak, Shobha U. Kamath, Padmanabha E.G. Udupa, Yogendra Nayak
Journal of Taibah University Medical Sciences.2019; 14(4): 383. CrossRef - A small plant with big benefits: Fenugreek (Trigonella foenum‐graecum Linn.) for disease prevention and health promotion
Kalyan C. Nagulapalli Venkata, Anand Swaroop, Debasis Bagchi, Anupam Bishayee
Molecular Nutrition & Food Research.2017;[Epub] CrossRef - Amelioration of Hyperglycemia and Associated Health Hazards Using Two Dietary Formulas Composed of Multiple Ingredients
F.A. El-Shobaki, Amal S. Abdel-Azee, Amany M. Hegazy, Hassan Z. Hassouna, I.H. Badawy
American Journal of Food Technology.2017; 12(4): 227. CrossRef - State of hyperglycemic animals during consumption of high-calorie diet with the bionanocomposite supplement
Ie. Goloborodko, V. Konopelniuk, L. Ostapchenko
Bulletin of Taras Shevchenko National University o.2017; 22(1): 43. CrossRef - In Vivo Effects of Quercetin in Association with Moderate Exercise Training in Improving Streptozotocin-Induced Aortic Tissue Injuries
Irina Chis, Andrei Coseriu, Ramona Simedrea, Adrian Oros, Andras Nagy, Simona Clichici
Molecules.2015; 20(12): 21770. CrossRef
 PubReader
 Cite
Cite


