Articles
- Page Path
- HOME > Osong Public Health Res Perspect > Volume 14(3); 2023 > Article
-
Original Article
Risk factors associated with death due to severe fever with thrombocytopenia syndrome in hospitalized Korean patients (2018–2022) -
Jia Kim
 , Hyo-jeong Hong, Ji-hye Hwang, Na-Ri Shin, Kyungwon Hwang
 -
Osong Public Health and Research Perspectives 2023;14(3):151-163.
DOI: https://doi.org/10.24171/j.phrp.2023.0048
Published online: June 8, 2023
1Division of Zoonotic and Vector Borne Disease Control, Bureau of Infectious Disease Policy, Korea Disease Control and Prevention Agency, Cheongju, Republic of Korea
- Corresponding author: Kyungwon Hwang Division of Zoonotic and Vector Borne Disease Control, Bureau of Infectious Disease Policy, Korea Disease Control and Prevention Agency, 187 Osongsaengmyeong 2-ro, Osong-eup, Heungdeok-gu, Cheongju 28159, Republic of Korea E-mail: kirk99@korea.kr
© 2023 Korea Disease Control and Prevention Agency.
This is an open access article under the CC BY-NC-ND license (http://creativecommons.org/licenses/by-nc-nd/4.0/).
- 1,669 Views
- 175 Download
Abstract
-
Objectives
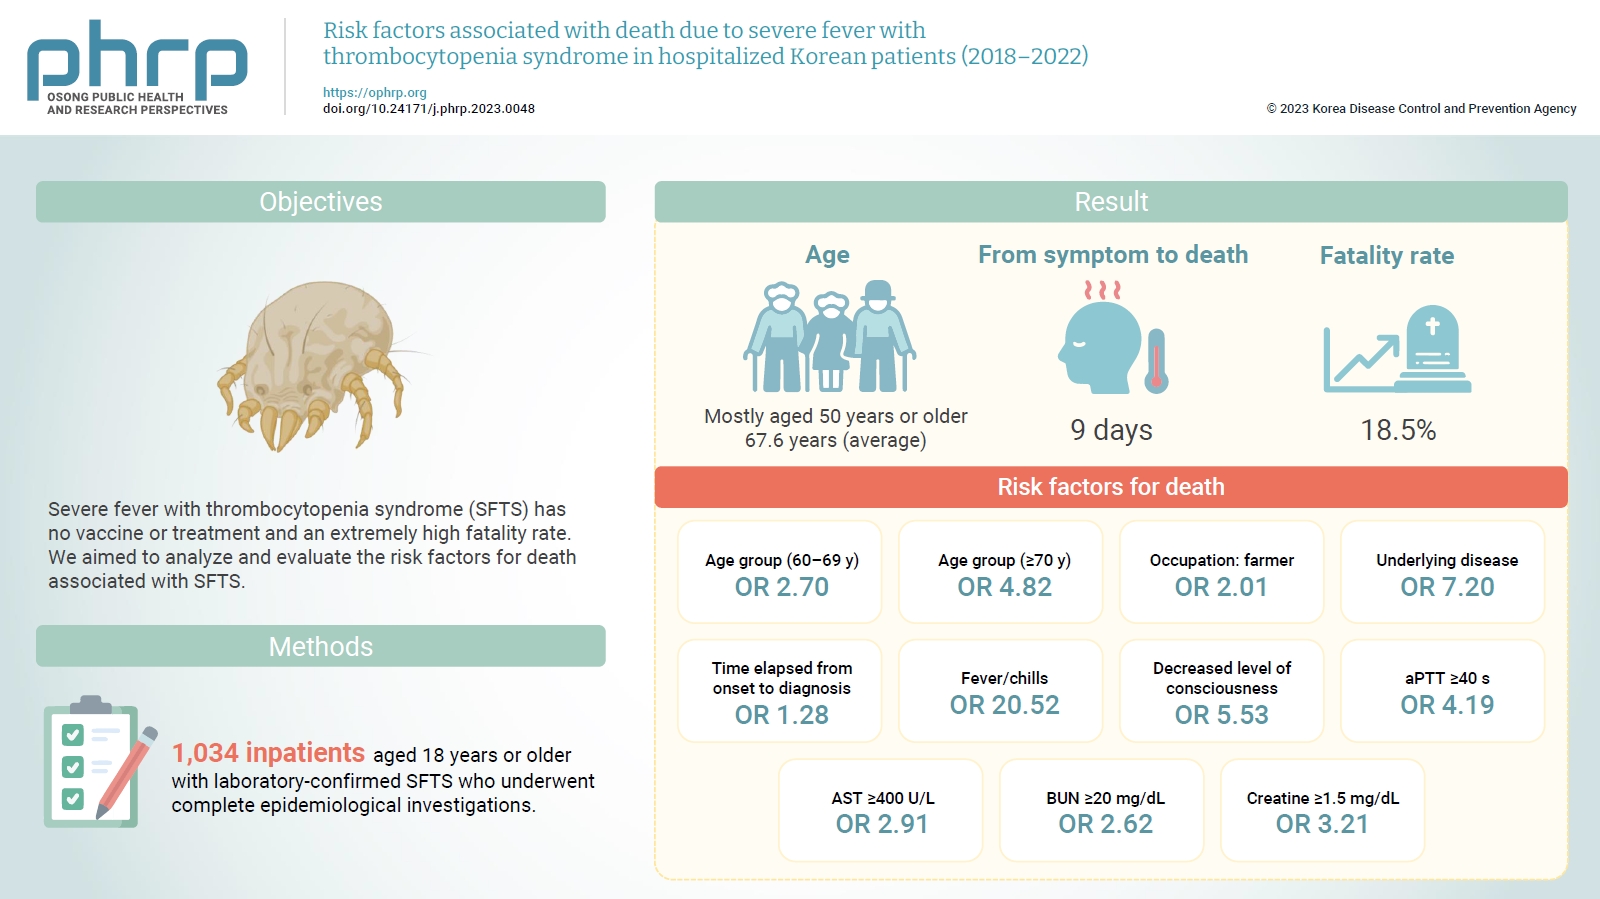
- Severe fever with thrombocytopenia syndrome (SFTS) has no vaccine or treatment and an extremely high fatality rate. We aimed to analyze and evaluate the risk factors for death associated with SFTS.
-
Methods
- Among reports from 2018 to 2022, we compared and analyzed 1,034 inpatients aged 18 years or older with laboratory-confirmed SFTS who underwent complete epidemiological investigations.
-
Results
- Most of the inpatients with SFTS were aged 50 years or older (average age, 67.6 years). The median time from symptom onset to death was 9 days, and the average case fatality rate was 18.5%. Risk factors for death included age of 70 years or older (odds ratio [OR], 4.82); agriculture-related occupation (OR, 2.01); underlying disease (OR, 7.20); delayed diagnosis (OR, 1.28 per day); decreased level of consciousness (OR, 5.53); fever/chills (OR, 20.52); prolonged activated partial thromboplastin time (OR, 4.19); and elevated levels of aspartate aminotransferase (OR, 2.91), blood urea nitrogen (OR, 2.62), and creatine (OR, 3.21).
-
Conclusion
- The risk factors for death in patients with SFTS were old age; agriculture-related occupation; underlying disease; delayed clinical suspicion; fever/chills; decreased level of consciousness; and elevated activated partial thromboplastin time, aspartate aminotransferase, blood urea nitrogen, and creatine levels.
- Severe fever with thrombocytopenia syndrome (SFTS) is a zoonotic disease caused by Phenuiviridae bandavirus. First reported in Henan Province (in Central China) in 2009 [1,2], it most commonly occurs in Asian countries such as China, Korea, and Japan and is transmitted by the bite of an SFTS virus (SFTSV)-infected tick. The main carrier is Haemaphysalis longicornis, which is found in temperate climate regions and is widely distributed in Korea, Japan, China, and Oceania [3]. Human transmission via exposure to the blood and body fluids of patients with confirmed SFTS has been reported in some regions, and suspected cases have also been reported in Republic of Korea [4].
- The incubation period of the disease is 5 to 14 days [5–7]. Clinical symptoms are non-specific, and main symptoms include high fever, digestive problems (nausea, vomiting, diarrhea, anorexia, etc.), and decreased platelet and white blood cell (WBC) counts. If the disease becomes severe, hemorrhagic manifestations, multiple organ failure, and neurological symptoms (muscle tremors and confusion) can occur [8].
- In Republic of Korea, nationwide surveillance of SFTS was initiated in 2013, and the first confirmed case was reported in May 2013. The first patient, who tested positive for SFTS when SFTSV was isolated from a blood sample, died of multiple organ failure after developing fever, leukopenia, and thrombocytopenia in August 2012 [9]. After this first case of SFTS was reported in 2013, the number of reported patients continued to increase annually, with the highest number of patients (272 cases) documented in 2017. Thereafter, the number of patients with SFTS remained between 200 and 250 each year, but it later decreased due to limitations on outdoor activities during the coronavirus disease 2019 (COVID-19) pandemic, which reduced the probability of contact with ticks [10].
- To date, no approved vaccines or treatments exist for SFTS [11]. From 2013 to 2022, the cumulative SFTS fatality rate in Republic of Korea was high, at 18.7%; China and Japan also had high fatality rates in 2022, with values of 5.1% [12] and 12.1% [13], respectively. Therefore, assessing SFTS and the risk factors for death from this condition is important for reducing the fatality rate associated with SFTS in Republic of Korea.
- By analyzing patients with SFTS and associated mortality rates in 2018–2022, this study was conducted to identify the risk factors for death and establish policies for SFTS treatment and prevention.
Introduction
- Study Target and Case Definition
- We examined records of SFTS cases reported to the surveillance system of the Korea Disease Control and Prevention Agency (KDCA) from 2018 to 2022. Of these, this study included 1,034 inpatients aged 18 years or older who were confirmed by laboratory diagnosis to have SFTSV and who underwent complete epidemiological investigations.
- Of confirmed patients [14] whose clinical symptoms matched the 2022 Legal Infectious Disease Diagnosis and Reporting Criteria, who had epidemiological risk factors, and for whom SFTSV was confirmed through a diagnostic test, SFTS patients were defined as those hospitalized and treated to assess and compare their clinical progress. The following methods and criteria were used to confirm the diagnosis: when SFTSV was isolated from a sample through a culture test, the antibody titer levels in the serum obtained at the convalescent phase showed a 4-fold increase relative to that obtained at the acute phase; the specific immunoglobulin M antibody was detected through indirect immunofluorescence or enzyme-linked immunosorbent assay; or a specific gene was detected in a sample through real-time reverse transcription polymerase chain reaction. After confirmation of SFTS, the cases were divided into death and survival groups, the former consisting of those for which the cause of death was listed as SFTS on the death certificate.
- Research Methods
- This retrospective case-control study was conducted between January 1, 2018 and December 31, 2022 among hospitalized patients with SFTS reported to the KDCA surveillance system. Patients were divided into groups by mortality status for comparison and analysis. For all patients, epidemiological investigations of demographic characteristics, possible route of infection, clinical symptoms, and test results were performed using a standardized form. Each patient’s history of exposure to risk factors 1 month before symptom onset was examined, and the results of diagnostic tests after hospitalization were collected from the first to the fourth day after admission. The date of SFTS diagnosis was determined based on the information reported in the KDCA surveillance system. Days to diagnosis were calculated from the date of symptom onset to the date of SFTS diagnosis.
- Statistical Analysis
- All statistical analyses were performed using R ver. 3.6.3 (R Foundation), and a p-value of <0.05 was considered to indicate statistical significance. Continuous variables were expressed as means (range or standard error), while categorical variables were expressed as frequencies and ratios. Demographic characteristics (sex, age, region, etc.) and epidemiological and clinical characteristics (symptoms, laboratory test results, etc.) were analyzed and compared between the patients who died and those who survived. Finally, the risk factors for death due to SFTS were evaluated by calculating the adjusted odds ratio (OR) through multivariate logistic regression analysis of the risk factors for death identified in univariate logistic regression analysis.
- Ethics Statement
- This study was approved by the Institutional Review Board of the KDCA (IRB No: 2023-03-03-PE-A) and performed in accordance with the principles of the Declaration of Helsinki. The study was conducted under the Infectious Disease Control and Prevention Act of Republic of Korea, and the requirement for informed consent was waived because of the retrospective nature of the study.
Materials and Methods
Study target
Case definition
- Status of Patients with SFTS by Year and Month
- A total of 1,034 inpatients in Republic of Korea were confirmed to have SFTS between 2018 and 2022. The highest number of patients with SFTS was reported in 2018 (n=249), while the lowest number was reported in 2021 (n=156). SFTS was found in all 17 cities and provinces nationwide. The 1,034 patients consisted of 488 male (47.2%) and 546 female (52.8%) individuals, and the average patient age was 67.6 years (95% confidence interval [CI], 66.8–68.8). Most patients with SFTS were in their 50s or older (962 patients, 93.0%), and no significant differences in age distribution were observed across years. Of the 1,034 inpatients diagnosed with SFTS, 191 died of the condition. The 5-year average case fatality rate (CFR) was 18.5% (95% CI, 13.6%–23.3%); this slightly decreased after the COVID-19 pandemic began in 2020, but no significant difference was observed in the annual fatality rate (p=0.768) (Table 1).
- SFTS primarily occurs from April to October every year. In this study, the patients began to develop suspicious symptoms in April (19 patients, 1.8%), and September had the highest number of patients with suspected symptoms (201 patients, 19.4%), indicating that SFTS was most prevalent in autumn. This report coincides with the high number of carriers confirmed in September; by then, approximately 3,000 to 8,000 eggs spawned by adult ticks, the main carriers of SFTSV, have begun to hatch, causing a rapid increase in the number of larvae from August onward. Thus, the proportion of patients with SFTS rapidly grows as the probability of a tick bite increases due to the increase in outdoor activities in autumn and the large number of tick larvae hatched from eggs [10].
- Comparison of General Characteristics According to Mortality
- Table 2 shows the clinical characteristics of the 2 groups according to mortality status. To analyze the risk factors for death, among the confirmed patients [14] with clinical symptoms, epidemiological relevance, and confirmed SFTSV according to the 2022 Legal Infectious Disease Diagnosis and Reporting Criteria, those receiving inpatient treatment were defined as confirmed SFTS patients and were compared and analyzed by their clinical progress. Next, they were divided into those who died and those who survived.
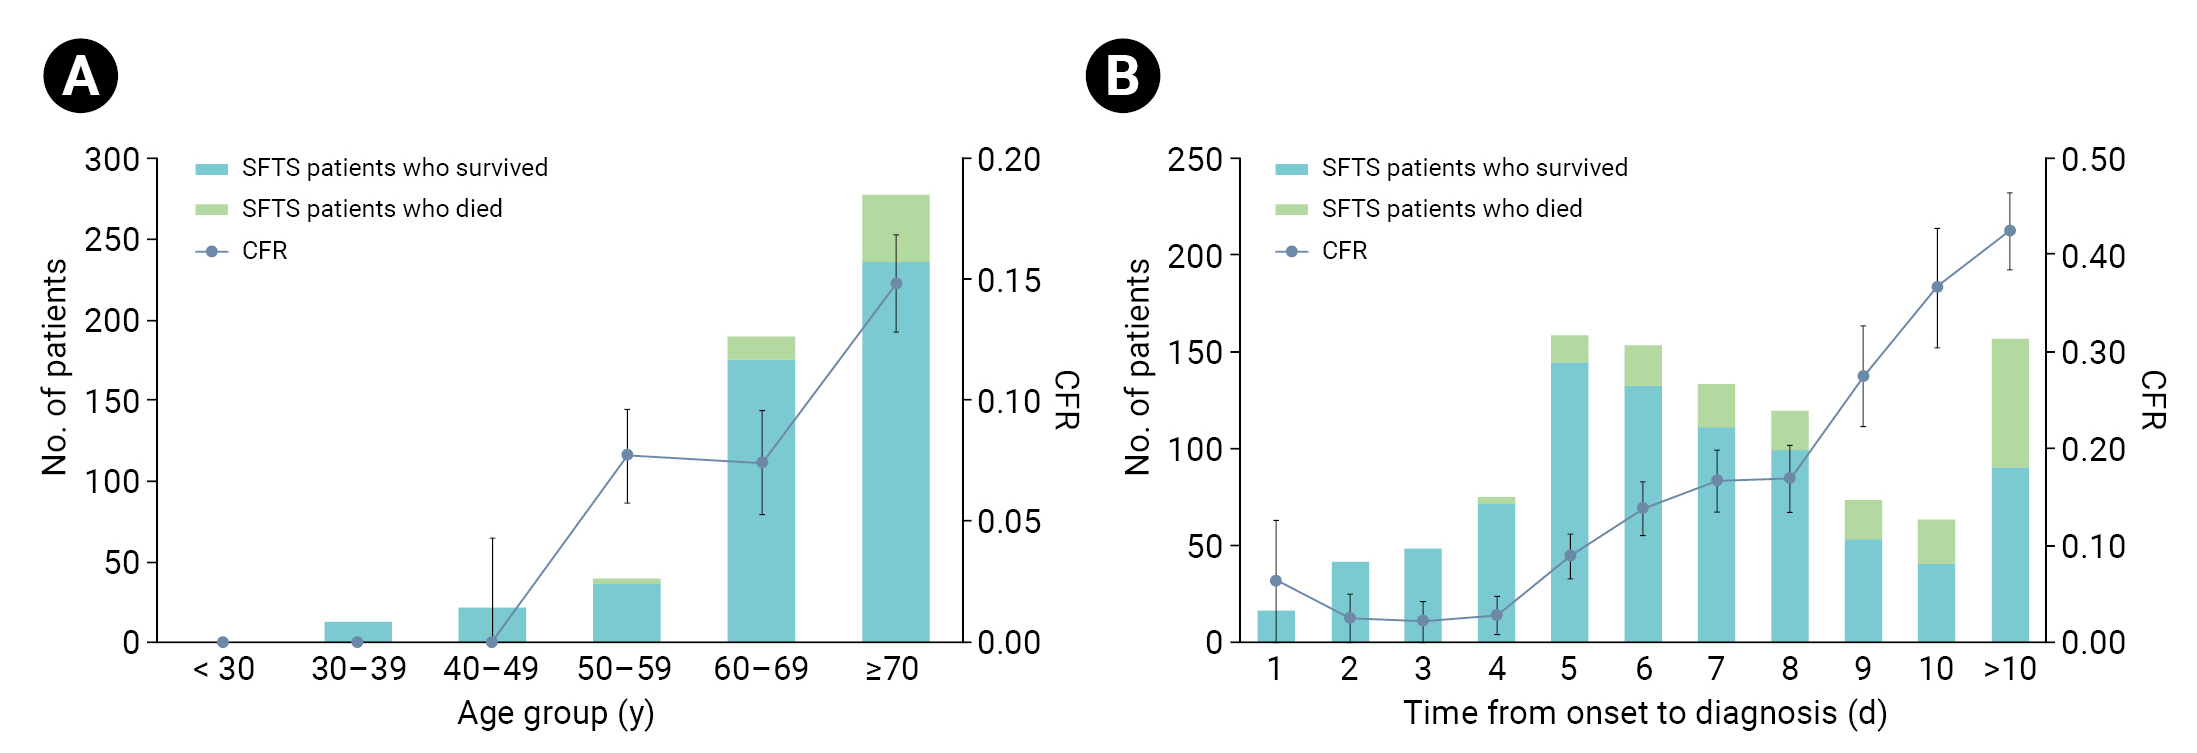
- In terms of sex, the patients who died included more women (96 cases, 50.3%) than men (95 cases, 49.7%), as did the survivors (women: 450 cases, 53.4%; men: 393 cases, 46.6%). Women had a lower risk of death than men (0.88; 95% CI, 0.65–1.21), but the difference was not significant (p=0.436). The average age of patients who died was 76.0 years (range, 67.0–80.5), 9 years greater than that of the survivors (67.0; range, 58.0–76.0). None of the patients in the <30-year and 30- to 39-year age groups died, and the proportions of patients in their 70s were relatively high in both death and survival groups. Relative to the 50- to 59-year age group, the risk of death was 2.17 times (95% CI, 1.15–4.11) higher in the 60- to 69-year age group (p=0.017) and 4.58 times (95% CI, 2.57–8.18) higher in the 70-year age group (p<0.001) (Figure 1A).
- Regarding area of residence, most patients in both groups lived in non-metropolitan areas, and the risk of death in patients living in these areas was 1.69 times higher than in urban regions (95% CI, 1.05–2.69; p=0.029). Among those who died, the proportion of patients engaged in agriculture-related occupations (89 cases, 46.6%) was lower than that of patients with other occupations (99 cases, 51.8%); similarly, in the survival group, fewer patients were engaged in agriculture-related jobs (228 cases, 27.0%) than in other occupations (606 cases, 71.9%). However, the risk of death was 2.39 times (95% CI, 1.72–3.30) higher in those with agriculture-related occupations than in patients with other occupations (p<0.001).
- A minority of patients recognized the tick bites in both the death (74 cases, 38.7%) and survival (282 cases, 33.5%) groups. Recognizing the tick bites that cause SFTS can be difficult, unlike other tick-borne conditions such as scrub typhus. The eschar created by the ticks that cause scrub typhus resembles that of a scab; however, an SFTS tick-bitten area is small, and the mark often disappears when symptoms develop [14].
- Most patients who died had an underlying disease (188 cases, 98.8%); similarly, among the survivors, more patients had an underlying disease (652 cases, 77.3%) than did not. The risk of death in patients with an underlying disease was 18.36 times (95% CI, 5.80–58.07) higher than that in patients without an underlying disease (p<0.001).
- The median interval from first symptom onset to death was 9 days (range, 7–11 days), constituting a rapid disease progression. The time from first symptom onset to hospitalization was the same in both groups (median, 4 days; range, 3–6 days); however, the median time before SFTS diagnosis was 9 days (range, 7–11 days) among those who died and 6 days among the survivors (range, 5–8 days). In other words, the time of diagnosis in the death group was delayed by 3 days relative to the survival group. The risk of death increased 1.22-fold for every 1-day delay in SFTS diagnosis (95% CI, 1.17–1.28; p<0.001). Compared with a 4-day delay in diagnosis time from first symptom onset, the risk of death increased by a factor of 13.13 (95% CI, 4.70–36.68) when diagnosis was delayed by 9 days, 20.01 (95% CI, 7.17–55.85) when delayed by 10 days, and 25.52 (95% CI, 9.93–65.6) when delayed by more than 10 days (Figure 1B).
- Comparison of Clinical Characteristics According to Mortality
- The clinical characteristics of the 2 groups are presented in Table 3. Most patients who died (188 patients, 98.4%) and most of those who survived (727 patients, 86.2%) experienced fever or chills; meanwhile, 41 patients (21.5%) who died and 164 patients (19.5%) who survived developed a high fever (39 °C or greater). The risk of death was 10.00 times higher (95% CI, 3.14–31.8) in patients who developed fever (p<0.001) than in those who did not, but no significant difference was found according to the presence or absence of high fever (≥39 °C, p=0.529). Fatigue was noted in 113 patients (59.2%) and 449 (53.3%) in the death and survival groups, respectively, while headache occurred in 40 patients (20.9%) who died and 207 patients (24.6%) who survived; neither difference was significant (p=0.139 and p=0.291, respectively). Myalgia was present in 66 patients (34.6%) and 336 patients (43.4%) in the death and survival groups, respectively.
- Except for fever, the most common report was gastrointestinal symptoms. Overall, gastrointestinal symptoms were present in 114 patients (59.7%) in the death group and 510 patients (60.5%) in the survival group, but no significant difference was found in mortality risk according to the presence or absence of digestive symptoms.
- Neurological symptoms were more common among those who died (113 patients, 59.2%) than those who survived (170 patients, 20.2%). Decreased level of consciousness was the most common symptom and was found in 105 patients (55.0%) who died and 118 patients (14.0%) who survived. All neurological symptoms were significantly associated with the risk of death. Neurological symptoms in general were associated with a risk of death 5.74 times higher (95% CI, 4.11–8.01; p<0.001), slurred speech 2.09 times higher (95% CI, 1.34–3.28; p=0.001), decreased level of consciousness 7.50 times higher (95% CI, 5.31–10.6; p<0.001), and convulsions 3.48 times higher (95% CI, 2.03–5.96; p<0.001) than the risk in those without such symptoms.
- Hemorrhagic manifestations were present in 37 patients (19.4%) in the death group and 55 patients (6.5%) in the survival group. All hemorrhagic manifestations were significantly associated with the risk of death. The OR of death was 3.44 for hemorrhagic manifestations (95% CI, 2.19–5.40; p<0.001), 3.17 for hematuria (95% CI, 1.54–6.53; p<0.002), 3.75 for petechial bleeding (95% CI, 1.13–12.42; p=0.031), 3.26 for gingival bleeding (95% CI, 1.53–6.94; p=0.002), and 3.83 for melena (95% CI, 1.63–8.99; p=0.002). Lymph node enlargement occurred in 5 patients (2.6%) who died and 22 patients (2.6%) who did not, but no significant difference was observed in mortality risk.
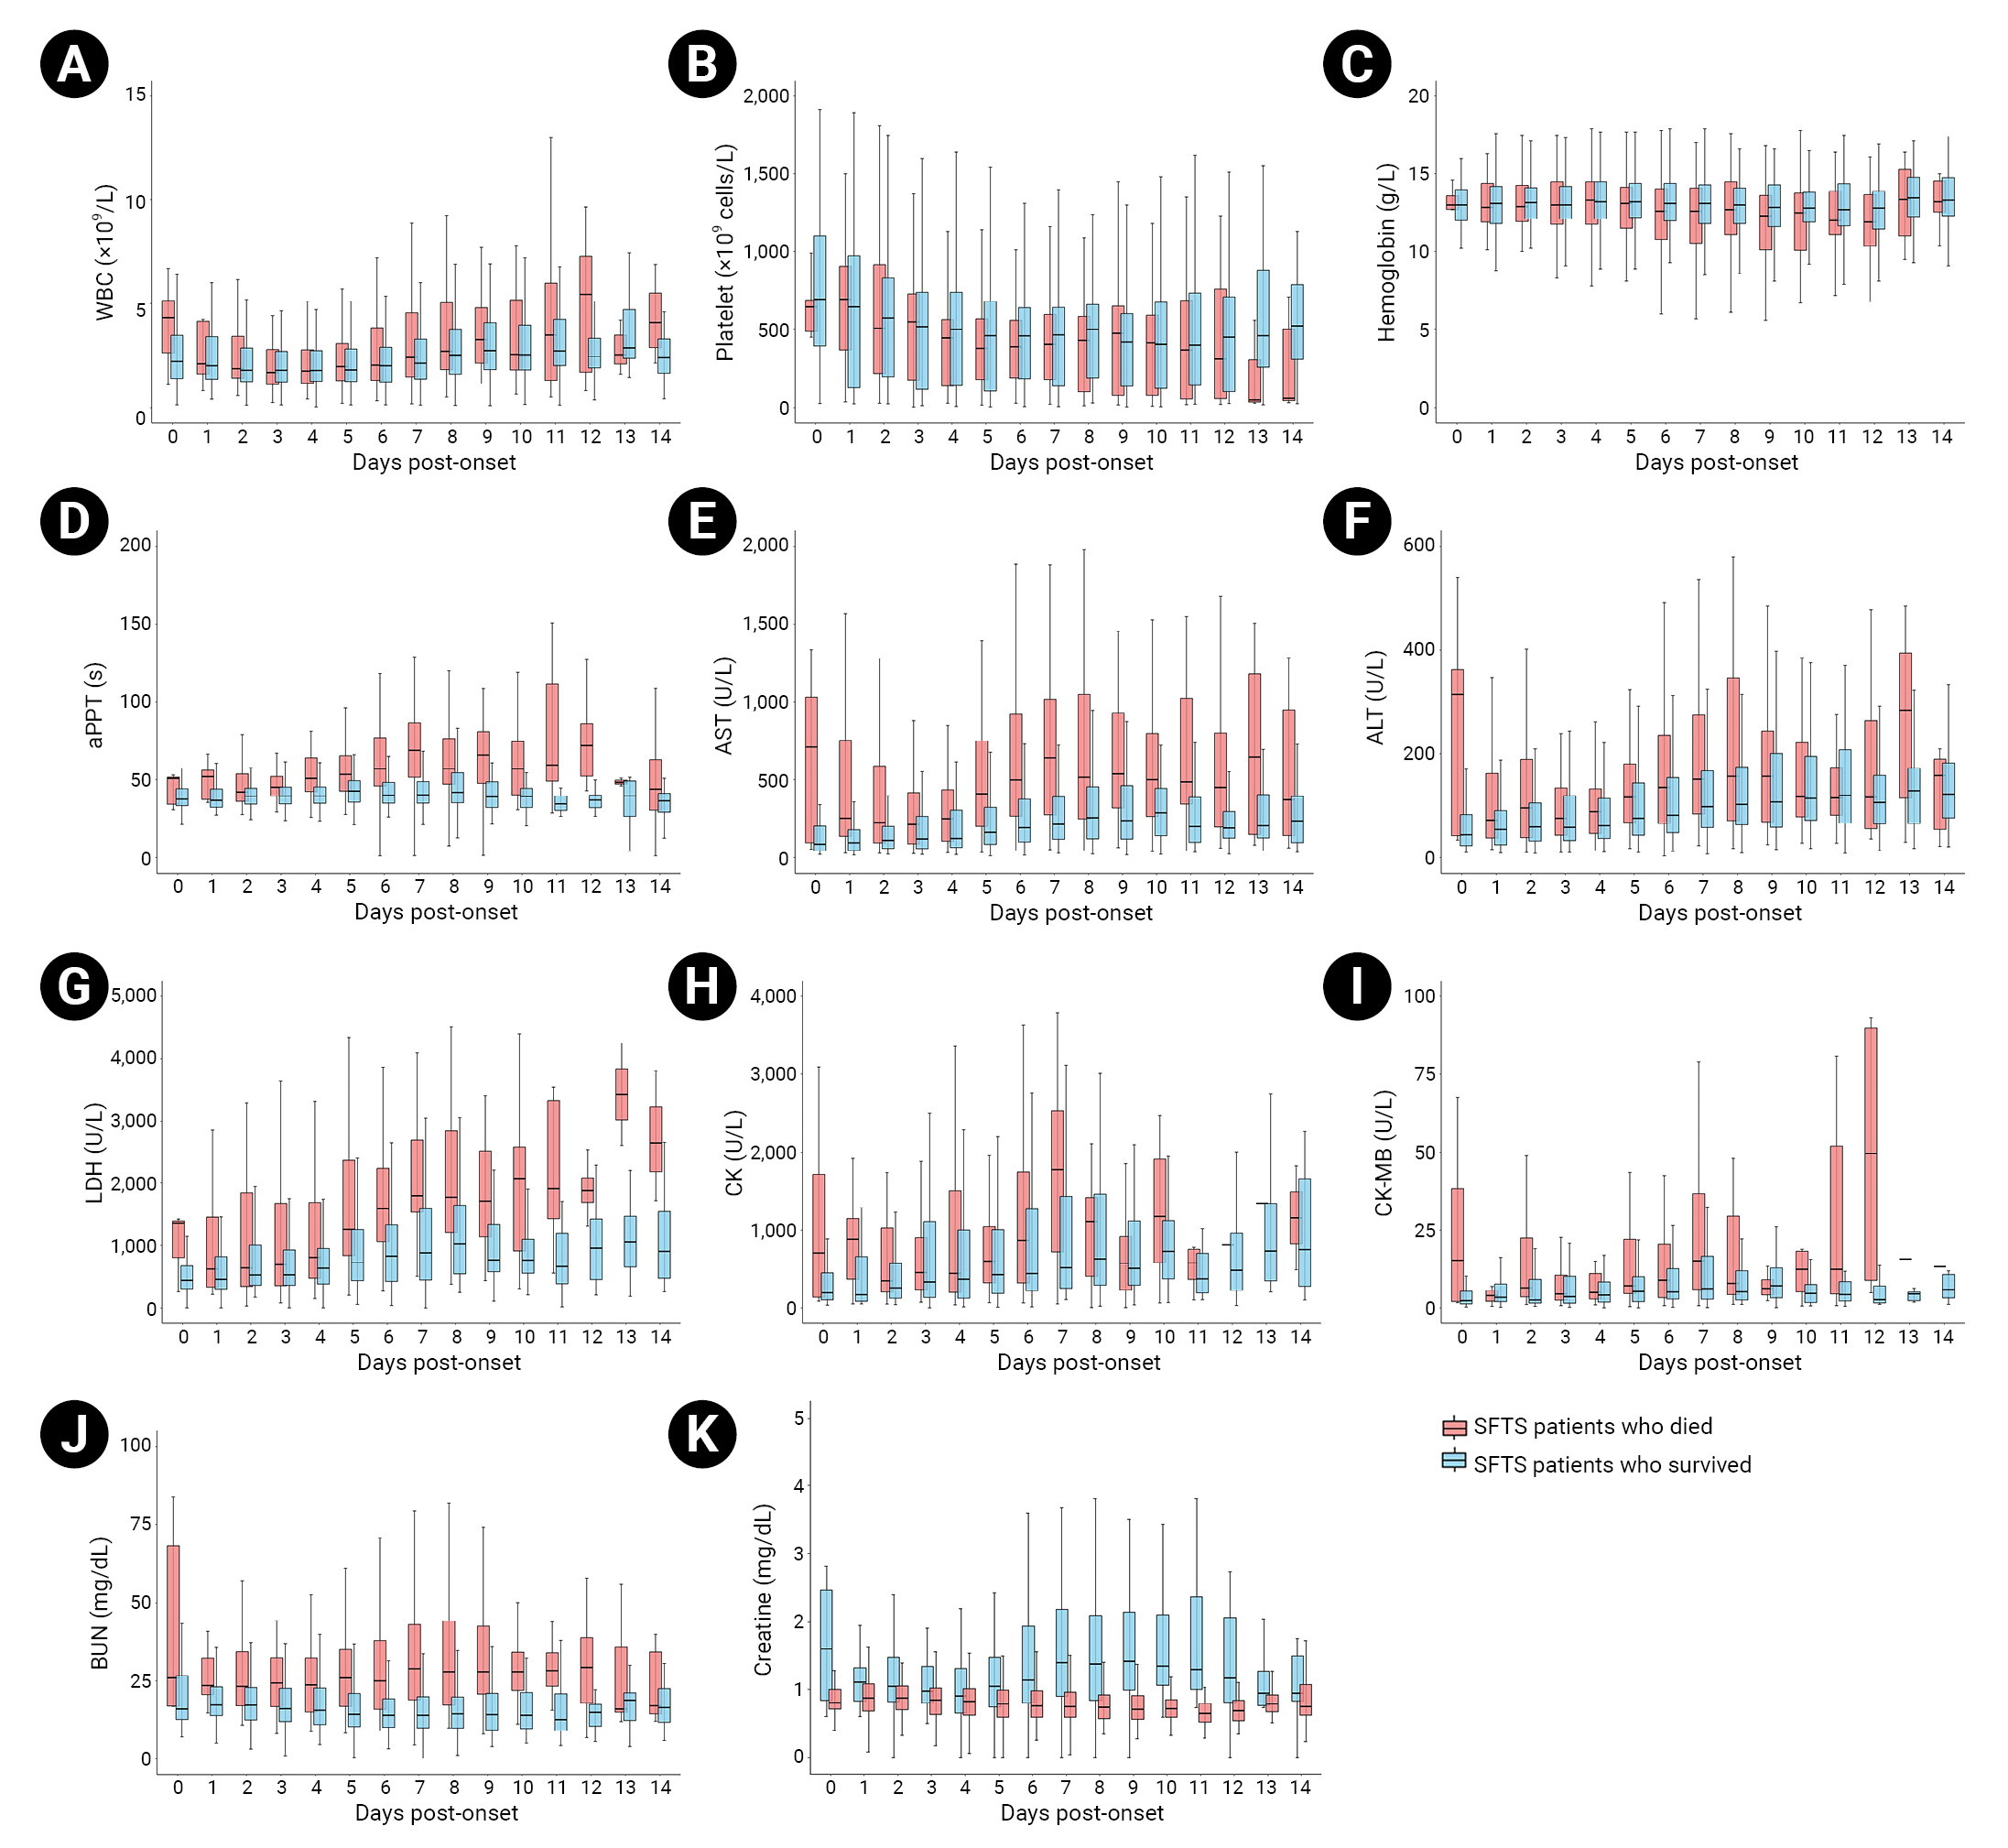
- We analyzed the diagnostic test results obtained within 2 weeks after first symptom onset, collected based on an epidemiological survey. Thirty-five patients who were diagnosed with SFTS after 14 or more days from the first symptom date to the first examination performed after admission to a medical institution were excluded from the analysis. The death and survival groups were compared in terms of 11 diagnostic test items identified based on an independent samples t-test performed in patients within 2 weeks after symptom onset: minimum WBC count (×109/L), minimum hemoglobin level (g/L), minimum platelet count (×109/L), maximum activated partial thromboplastin time (aPTT), maximum aspartate aminotransferase (AST, U/L), maximum alanine aminotransferase (ALT, U/L), maximum lactate dehydrogenase (LDH), maximum creatine kinase (CK, U/L), maximum creatine kinase myocardial fraction (CK-MB, U/L), maximum blood urea nitrogen (BUN, mg/dL), and maximum creatine level (mg/dL). The 14-day laboratory parameter dynamics are shown as box plots (Table 4; Figure 2).
- The median minimum WBC count was 1.5×10⁹/L (range, 1.0–2.1×10⁹/L) among all patients, while the median value was lower among the patients who died, at 1.4×10⁹/L (range, 0.9–2.0×10⁹/L). The median minimum hemoglobin level was 12.5 g/L (range, 11.2–13.8 g/L) among all patients, and the median value of those who died was lower, at 11.5 g/L (range, 9.2–12.8 g/L). However, no significant differences were found between the death and survival groups in either parameter (p=0.205 and p=0.560, respectively). The minimum platelet count—which can indicate thrombocytopenia, a primary symptom of SFTS—had a median (range) of 360.0×10⁹/L (range, 100.3–570.0×10⁹/L) across all patients. The median platelet count of those who died was 11.5×10⁹/L (range, 9.2–12.8×10⁹/L), while that of the survivors was 12.7×10⁹/L (range, 11.5–14.0×10⁹/L), indicating a lower minimum value. The WBC count differed significantly between the death and survival groups (p<0.001). The median maximum aPTT values were 43.0 seconds (range, 36.5–56.0 seconds) for all patients, 66.3 seconds (range, 50.8–91.9 seconds) for the death group, and 40.5 seconds (range, 35.7–48.4 seconds) for the survival group. Thus, the aPTT was significantly longer among the patients who died than among those who survived (p<0.001).
- Moreover, this study compared the maximum AST, maximum ALT, and maximum LDH levels, as indicators of liver function abnormality, between groups. The median maximum AST values were 300.5 U/L (range, 118.8–681.8 U/L) for all patients, 1,088.5 U/L (range, 545.0–2,297.0 U/L) for the death group, and 228.0 U/L (range, 103.0–483.0 U/L) for the survival group; therefore, the maximum AST level was significantly higher among patients who died than among either all patients or survivors. The median maximum ALT values were 117.0 U/L (range, 58.0–245.0 U/L) for all patients, 238.0 U/L (range, 125.5–485.0 U/L) for the death group, and 99.0 U/L (range, 50.8–197.0 U/L) for the survival group; thus, the maximum ALT level was much higher among patients who died than among either all patients or survivors. The median maximum LDH values were 910.0 U/L (range, 485.0–1,866.0 U/L) for all patients, 2,517.0 U/L (range, 1,249.8–4,762.3 U/L) for the death group, and 771.0 U/L (range, 437.0–1,353.0 U/L) for the survival group; as such, the maximum LDH level was also much higher among patients who died than among either all patients or survivors. Significant differences were observed between death and survival groups in the maximum AST, ALT, and LDH levels (p<0.001).
- The median maximum CK values were 574.5 U/L (range, 196.5–1,913.0 U/L) in all patients, 1,873.0 U/L (range, 453.0–6,186.0 U/L) in the death group, and 414.0 U/L (range, 166.0–1,363.0 U/L) in the survival group; thus, the maximum CK level in the death group was higher than in all patients and in survivors. The median maximum CK-MB values were 4.9 U/L (range, 2.2–15.2 U/L) in all patients, 11.7 U/L (range, 4.3–48.8 U/L) in the death group, and 4.2 U/L (range, 1.8–10.7 U/L) in the survival group; thus, the median maximum CK-MB value was higher in the death group than in all patients and in survivors. Significant differences were observed between the 2 groups in maximum CK (p<0.001) and maximum CK-MB (p=0.005) values.
- The median maximum BUN value was 20.0 mg/dL (range, 14.0–31.5 mg/dL) across all patients, while the median maximum value in the death group was 36.7 mg/dL (range, 26.1–54.3 mg/dL), which was higher than that in all patients and in survivors. The median maximum creatine level was 1.0 mg/dL (range, 0.8–1.4 mg/dL) in all patients, while the median value in the death group was 1.8 mg/dL (range, 1.2–2.8 mg/dL). Therefore, the maximum creatine level among patients who died was higher than that of all patients and of the survival group. A significant difference was observed between the 2 groups only in the maximum BUN value (p=0.005).
- The diagnostic test patterns of SFTS can be divided into 3 stages by disease period. Stage I is defined by a high fever within 1 week of first symptom onset, stage II is defined by multiple organ dysfunction within 1 to 2 weeks after first symptom onset, and stage III is defined as the recovery period occurring within 2 to 3 weeks after first symptom onset [8]. According to the dynamic profile composed of 11 diagnostic tests performed in both groups within 2 weeks of symptom onset, platelet counts continued to decrease from symptom onset to day 7 (stage I) and were slightly elevated or maintained on days 7 to 14 (stage II) in the survival group; however, platelet counts continued to decrease on days 7 to 14 (stage II) in the death group. The aPTT level was also slightly elevated or maintained during stage I in the survival group but increased rapidly in the death group and continued to increase in stage II. The AST, ALT, LDH, CK, CK-MB, BUN, and creatine levels significantly differed between the survival and death groups. The levels of these parameters increased in stage I and decreased or remained constant in stage II in the survival group, while they remained high and did not return to normal in the death group. These results are similar to the clinical features of inpatients with SFTS in China [8].
- To identify the risk factors for death according to the diagnostic test patterns of patients with SFTS, a univariate logistic regression analysis was performed by classifying each diagnostic test item into binary terms according to the reporting criteria mentioned above [15]. Ten diagnostic test items, excluding WBC count, were identified as significant risk factors for death.
- The ORs indicating the risk of death were 2.16 (95% CI, 1.58–3.00; p<0.001) for a hemoglobin level <12 g/L, 2.08 (95% CI, 1.34–3.22) for a platelet level <40×109/L (95% CI, 1.34–3.22; p=0.001), 9.34 (95% CI, 5.96–14.63; p<0.001) for an aPTT ≥40 seconds, 11.14 (95% CI, 7.52–16.50; p<0.001) for an AST level ≥400 U/L, 4.74 (95% CI, 3.41–6.59; p<0.001) for an ALT level ≥200 U/L, 5.75 (95% CI, 4.09–8.08; p<0.001) for an LDH level ≥1,000 U/L, 4.03 (95% CI, 2.87–5.65; p<0.001) for a CK level ≥1,000 U/L, 7.10 (95% CI, 3.14–16.06; p<0.001) for a CK-MB value ≥100 U/L, 9.22 (95% CI, 6.07–14.02; p<0.001) for a BUN value ≥20 mg/dL, and 11.54 (95% CI, 8.06–16.54; p<0.001) for a creatine level ≥1.5 mg/dL (Table 5).
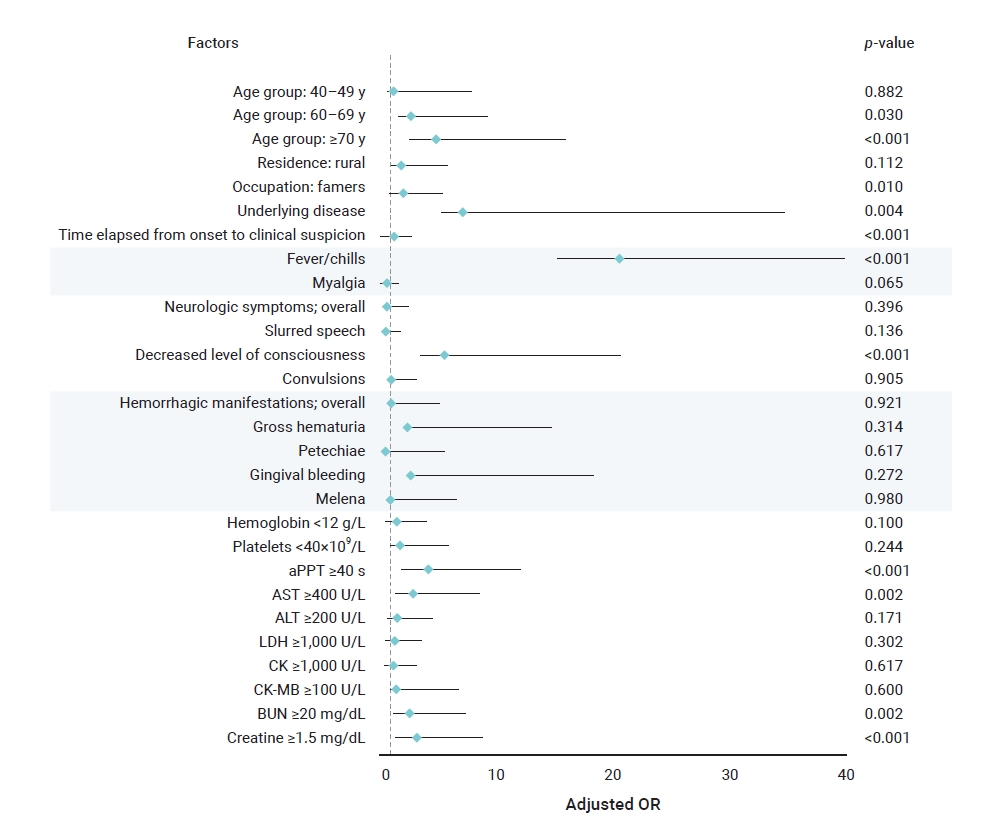
- Risk Factors for Death in Patients with SFTS
- Multivariate logistic regression analysis was performed to analyze the risk factors for death identified in the univariate logistic regression analysis (Table 6). Age; agriculture-related occupations; underlying disease; delayed diagnosis period; fever and chills; decreased level of consciousness; and elevated aPTT, AST, BUN, and creatine levels were identified as risk factors for death in inpatients with SFTS (Figure 3).
Results
- In this study, the epidemiological and clinical characteristics and risk factors for death associated with SFTS in the last 5 years were evaluated. Among inpatients diagnosed with SFTS from 2018 to 2022, the proportion of women was slightly higher than that of men, and the average age was 67.6 years, with most patients at least 50 years old. The median period from first symptom onset to death was 9 days, and the average CFR was 18.5%; these findings are consistent with known characteristics of SFTS, which progresses rapidly and has a high fatality rate [8].
- Among epidemiological characteristics, the risk factors for death were old age, agricultural occupation, underlying disease, and delayed diagnosis. The ORs for death were 2.7 in patients aged 60 to 69 years and 4.82 in those aged 70 years or older, 2.01 in those engaged in agriculture-related occupations, and 7.2 in those with an underlying disease. When the time from the first symptom onset to disease diagnosis was delayed by 1 day, the risk of death increased by a factor of 1.28. This finding implies a high possibility of SFTSV in individuals with continued exposure to risk factors, as most of the patients were older and were engaged in agriculture-related occupations; moreover, the older adults’ risk of death was elevated in the presence of underlying disease and immunosuppression other than SFTS [8,16]. In addition, the main symptoms of SFTS are non-specific, such as high fever and digestive problems. Thus, the fatality rate of SFTS can be reduced by shortening the diagnosis period through active differential diagnosis from other tick-borne diseases, such as scrub typhus, at medical institutions before early symptoms worsen.
- Fever, chills, and decreased level of consciousness are among the clinical characteristics considered risk factors for death. Fever and chills occurred in most patients from the death and survival groups, and the risk of death was 20.52 times higher in those who developed these symptoms than in those who did not. All neurological symptoms were significant in the univariate logistic regression analysis; however, only decreased level of consciousness was a significant risk factor for death in the multivariate logistic regression analysis. Although the exact mechanism of SFTS-induced neurological damage has not been identified, an electrolyte imbalance in the blood can trigger neurological symptoms [17].
- This study involved analysis of stage I (high fever) and stage II (multiple organ dysfunction) SFTS among the diagnostic test patterns according to the SFTS disease period. In the death group, the platelet count and hemoglobin levels continued to decrease in stage I; the aPTT, AST, ALT, LDH, CK, CK-MB, BUN, and creatine levels increased but did not return to normal when the diagnostic test pattern progressed to stage II. In the survival group, the platelet count and hemoglobin levels continued to decrease in stage I, while the aPTT, AST, ALT, LDH, CK, CK-MB, BUN, and creatine levels increased; however, these parameters recovered somewhat when the diagnostic test pattern progressed to stage II. Therefore, the active treatment of SFTS in the early stages of the disease (stage I) greatly impacts the risk of progression to death.
- Among the laboratory parameters, elevation in aPTT, AST, BUN, and creatine levels were associated with 4.19, 2.91, 2.62, and 3.21 times increased risk of death, respectively. The cause of coagulopathy due to SFTS has not been clearly identified; some studies have suggested acute liver dysfunction as the cause of this condition [18]. Thus, signs of bleeding and changes in aPTT and AST levels should be assessed in the early stages of disease progression. Renal function abnormalities appear relatively late in patients with SFTS [19]. Since the BUN level may increase even if the glomerular filtration rate decreases below 50%, it is necessary to continuously monitor the creatine level rather than the BUN level to obtain an initial differential diagnosis.
- Therefore, if non-specific or suspicious symptoms such as fever and chills are reported during the peak of SFTS cases from April to October, epidemiological risk factors such as old age, agriculture-related occupations, and underlying diseases should be assessed in elderly patients who visit medical institutions. In addition, delays in diagnosis should be prevented by confirming the presence of SFTS through active diagnostic testing. Finally, when risk factors for death are identified based on the results of diagnostic tests, such as increased aPTT, AST, BUN, and creatine levels, the rates of SFTS-related mortality can be reduced only through the early provision of treatment (e.g., ribavirin).
- This study had some limitations. First, since it was conducted among inpatients, asymptomatic or mildly symptomatic patients with SFTS may have been overlooked. Therefore, the fatality rate of SFTS in Republic of Korea is likely to be lower than that shown in this study, and the fatality rate may also have been overestimated because the COVID-19 pandemic in 2020 decreased the number of SFTS cases reported. Second, this analysis was based on the results of an initial epidemiological investigation conducted after SFTS was suspected and reported to the system. Therefore, no follow-up study has been carried out, and the effects of certain treatments, such as ribavirin, on SFTS symptoms were not analyzed; thus, effective SFTS treatment options could not be identified. Relative to previously reported SFTS mortality risk factors, this study indicated no new findings. Nonetheless, the COVID-19 epidemic has led to a lack of monitoring and analysis of SFTS; thus, this study is still meaningful in that it provided updated clinical and epidemiological characteristics of inpatients with SFTS by analyzing their clinical progression status and risk factors for death over the past 5 years (2018–2022). As the environment of vectors (here, ticks) changes due to climate change caused by global warming, it is also important to monitor infectious diseases caused by these vectors. Although changes, such as an increase in the number of vectors, are occurring due to climate change, the present study confirmed that older age, agriculture-related occupation, presence of an underlying disease, delay in diagnosis, fever/chills, decreased level of consciousness, and increased aPTT, AST, BUN, and creatine levels are still important risk factors for SFTS mortality. Based on the study results, a monitoring, patient management, and analysis system for SFTS should be developed by assessing the incidence and fatality rates of SFTS in Republic of Korea.
Discussion
- This study confirmed that risk factors for death in inpatients with SFTS included old age; agricultural occupation; underlying disease; delayed diagnosis; fever and chills; decreased level of consciousness; and elevated aPTT, AST, BUN, and creatine levels. However, the number of patients with SFTS reported in this study was likely low due to the ongoing COVID-19 pandemic, and asymptomatic or mildly symptomatic patients with SFTS may have been omitted since this study included only inpatients. Finally, caution should be observed when interpreting the study results, as the effects of SFTS treatment were not analyzed due to the limited number of follow-up studies.
Conclusion
- • Severe fever with thrombocytopenia syndrome (SFTS) has no vaccine or treatment and an extremely high fatality rate.
- • The risk factors for death in patients with SFTS were old age; agriculture-related occupations; underlying disease; delayed clinical suspicion; fever/chills; decreased level of consciousness; and elevated activated partial thromboplastin time, aspartate aminotransferase, blood urea nitrogen, and creatine levels.
HIGHLIGHTS
-
Ethics Approval
This study was approved by the Institutional Review Board of the KDCA (IRB No: 2023-03-03-PE-A) and performed in accordance with the principles of the Declaration of Helsinki. The study was conducted under the Infectious Disease Control and Prevention Act of Republic of Korea, and the requirement for informed consent was waived because of the retrospective nature of this study.
-
Conflicts of Interest
The authors have no conflicts of interest to declare.
-
Funding
None.
-
Availability of Data
All data generated or analyzed during this study are included in this published article. For other data, or if you have additional questions about the study, please contact the corresponding author, Kyungwon Hwang. E-mail: kirk99@korea.kr.
-
Authors’ Contributions
Formal analysis: JK; Investigation: JK, HJH, JHH; Supervision: NRS, KH; Writing–original draft: JK; Writing–review & editing: authors. All authors read and approved the final manuscript.
Article information


| Total (n=1,034) | 2018 (n=249) | 2019 (n=218) | 2020 (n=225) | 2021 (n=156) | 2022 (n=186) | pa) | |
|---|---|---|---|---|---|---|---|
| Sex | |||||||
| Male | 488 (47.2) | 113 (45.4) | 111 (50.9) | 91 (40.4) | 71 (45.5) | 102 (54.8) | 0.037 |
| Female | 546 (52.8) | 136 (54.6) | 107 (49.1) | 134 (59.6) | 85 (54.5) | 84 (45.2) | |
| Age (y) | 67.6±12.9 | 66.8±12.4 | 67.3±12.5 | 66.9±14.6 | 68.5±11.7 | 69.4±12.5 | 0.175 |
| <30 | 12 (1.2) | 2 (0.8) | 3 (1.4) | 6 (2.7) | 0 (0) | 1 (0.5) | 0.388 |
| 30–39 | 21 (2.0) | 4 (1.6) | 3 (1.4) | 8 (3.6) | 2 (1.3) | 4 (2.2) | |
| 40–49 | 39 (3.8) | 16 (6.4) | 9 (4.1) | 5 (2.2) | 4 (2.6) | 5 (2.7) | |
| 50–59 | 189 (18.3) | 47 (18.9) | 40 (18.3) | 43 (19.1) | 28 (17.9) | 31 (16.7) | |
| 60–69 | 277 (26.8) | 68 (27.3) | 61 (28.0) | 54 (24.0) | 46 (29.5) | 48 (25.8) | |
| ≥70 | 496 (48.0) | 112 (45.0) | 102 (46.8) | 109 (48.4) | 76 (48.7) | 97 (52.2) | |
| CFR (%) | 18.5±38.8 | 18.5±38.9 | 18.8±39.2 | 16.4±37.2 | 17.3±38.0 | 21.5±41.2 | 0.768 |
| General characteristic | Died (n=191) | Survived (n=843) | OR (95% CI) | pa) |
|---|---|---|---|---|
| Sex | ||||
| Male | 95 (49.7) | 393 (46.6) | 1 (ref.) | 0.436 |
| Female | 96 (50.3) | 450 (53.4) | 0.88 (0.65-1.21) | |
| Age (y) | 76.0 (67.0–80.5) | 67.0 (58.0–76.0) | NA | <0.001 |
| Age group (y) | ||||
| <30 | 0 (0) | 12 (1.4) | NA | - |
| 30–39 | 0 (0) | 21 (2.5) | NA | - |
| 40–49 | 3 (1.6) | 36 (4.3) | 1.04 (0.28–3.81) | 0.951 |
| 50–59 | 14 (7.3) | 175 (20.8) | 1 (ref.) | - |
| 60–69 | 41 (21.5) | 236 (28.0) | 2.17 (1.15–4.11) | 0.017 |
| ≥70 | 133 (69.6) | 363 (43.1) | 4.58 (2.57–8.18) | <0.001 |
| Residence | ||||
| Rural | 168 (88.0) | 685 (81.3) | 1.69 (1.05–2.69) | 0.029 |
| Urban (metropolitan) | 23 (12.0) | 158 (18.7) | 1 (ref.) | - |
| Occupation | ||||
| Farmers | 89 (46.6) | 228 (27.0) | 2.39 (1.72–3.30) | <0.001 |
| Forestry | 3 (1.6) | 9 (1.1) | 2.04 (0.54–7.67) | 0.291 |
| Others | 99 (51.8) | 606 (71.9) | 1 (ref.) | - |
| Recognition of tick bite | ||||
| Yes | 74 (38.7) | 282 (33.5) | 1.26 (0.91–1.74) | 0.165 |
| No | 117 (61.3) | 561 (66.5) | 1 (ref.) | - |
| Underlying disease | ||||
| Yes | 188 (98.4) | 652 (77.3) | 18.36 (5.80–58.07) | <0.001 |
| No | 3 (1.6) | 191 (22.7) | 1 (ref.) | - |
| Time elapsed | ||||
| From onset to admission | 4 (3–6) | 4 (3–6) | 0.98 (0.93–1.04) | 0.56 |
| From onset to diagnosis (d) | 9 (7–11) | 6 (5–8) | 1.22 (1.17–1.28) | <0.001 |
| <4 | 5 (2.6) | 174 (20.6) | 1 (ref.) | - |
| 5 | 14 (7.3) | 144 (17.1) | 3.38 (1.19–9.62) | 0.022 |
| 6 | 21 (11.0) | 132 (15.7) | 5.54 (2.03–15.07) | <0.001 |
| 7 | 22 (11.5) | 111 (13.2) | 6.90 (2.54–18.74) | <0.001 |
| 8 | 20 (10.5) | 99 (11.7) | 7.03 (2.56–19.31) | <0.001 |
| 9 | 20 (10.5) | 53 (6.3) | 13.13 (4.70–36.68) | <0.001 |
| 10 | 23 (12.0) | 40 (4.7) | 20.01 (7.17–55.85) | <0.001 |
| >10 | 66 (34.6) | 90 (10.7) | 25.52 (9.93–65.6) | <0.001 |
| From onset to death | 9 (7–11) | NA | NA | NA |
| Clinical characteristic | Died (n=191) | Survived (n=843) | OR (95% CI) | pa) |
|---|---|---|---|---|
| Fatigue | 113 (59.2) | 449 (53.3) | 1.27 (0.92–1.75) | 0.139 |
| Myalgia | 66 (34.6) | 336 (43.4) | 0.69 (0.50–0.96) | 0.025 |
| Headache | 40 (20.9) | 207 (24.6) | 0.81 (0.56–1.19) | 0.291 |
| Fever/chills | ||||
| Overall | 188 (98.4) | 727 (86.2) | 10.00 (3.14–31.8) | <0.001 |
| Fever (≥39 °C) | 41 (21.5) | 164 (19.5) | 1.13 (0.77–1.66) | 0.529 |
| Gastrointestinal symptoms | ||||
| Overall | 114 (59.7) | 510 (60.5) | 0.97 (0.70–1.33) | 0.836 |
| Anorexia | 62 (32.5) | 272 (32.3) | 1.01 (0.72–1.41) | 0.958 |
| Nausea | 50 (26.2) | 227 (26.9) | 0.96 (0.67–1.38) | 0.833 |
| Abdominal pain | 51 (26.7) | 234 (27.8) | 0.95 (0.67–1.35) | 0.768 |
| Diarrhea | 60 (31.4) | 224 (26.6) | 1.27 (0.90–1.78) | 0.176 |
| Vomiting | 31 (16.2) | 173 (20.5) | 0.75 (0.49–1.14) | 0.178 |
| Neurologic symptoms | ||||
| Overall | 113 (59.2) | 170 (20.2) | 5.74 (4.11–8.01) | <0.001 |
| Slurred speech | 32 (16.8) | 74 (8.8) | 2.09 (1.34–3.28) | 0.001 |
| Decreased level of consciousness | 105 (55.0) | 118 (14.0) | 7.50 (5.31–10.6) | <0.001 |
| Convulsions | 25 (13.1) | 35 (4.2) | 3.48 (2.03–5.96) | <0.001 |
| Hemorrhagic manifestations | ||||
| Overall | 37 (19.4) | 55 (6.5) | 3.44 (2.19–5.40) | <0.001 |
| Gross hematuria | 13 (6.8) | 19 (2.3) | 3.17 (1.54–6.53) | 0.002 |
| Petechiae | 5 (2.6) | 6 (0.7) | 3.75 (1.13–12.42) | 0.031 |
| Gingival bleeding | 12 (6.3) | 17 (2.0) | 3.26 (1.53–6.94) | 0.002 |
| Melena | 10 (5.2) | 12 (1.4) | 3.83 (1.63–8.99) | 0.002 |
| Lymph node enlargement | 5 (2.6) | 22 (2.6) | 1.00 (0.38–2.68) | 0.995 |
Data are presented as n (%) unless otherwise specified.
SFTS, severe fever with thrombocytopenia syndrome; OR, odds ratio; CI, confidence interval.
a) p-value calculated using logistic regression analysis performed after converting variables into binary values according to the presence or absence of symptoms.
| Laboratory tests | Total (n=999)a) | Died (n=191) | Survived (n=808) | p |
|---|---|---|---|---|
| WBC count (×109/L)b) | 1.5 (1.0–2.1) | 1.4 (0.9–2.0) | 1.5 (1.1–2.2) | 0.205 |
| Hemoglobin (g/L)b) | 12.5 (11.2–13.8) | 11.5 (9.2–12.8) | 12.7 (11.5–14.0) | 0.560 |
| Platelet count (×109/L)b) | 360.0 (100.3–570.0) | 290.0 (58.0–390.0) | 410.0 (112.5–610.0) | <0.001 |
| aPTT (s)c) | 43.0 (36.5–56.0) | 66.3 (50.8–91.9) | 40.5 (35.7–48.4) | <0.001 |
| AST (U/L)c) | 300.5 (118.8–681.8) | 1,088.5 (545.0–2,297.0) | 228.0 (103.0–483.0) | <0.001 |
| ALT (U/L)c) | 117.0 (58.0–245.0) | 238.0 (125.5–485.0) | 99.0 (50.8–197.0) | <0.001 |
| LDH (U/L)c) | 910.0 (485.0–1,866.0) | 2,517.0 (1,249.8–4,762.3) | 771.0 (437.0–1,353.0) | <0.001 |
| CK (U/L)c) | 574.5 (196.5–1,913.0) | 1,873.0 (453.0–6,186.0) | 414.0 (166.0–1,363.0) | <0.001 |
| CK-MB (U/L)c) | 4.9 (2.2–15.2) | 11.7 (4.3–48.8) | 4.2 (1.8–10.7) | 0.005 |
| BUN (mg/dL)c) | 20.0 (14.0–31.5) | 36.7 (26.1–54.3) | 17.8 (13.0–25.9) | 0.005 |
| Creatine (mg/dL)c) | 1.0 (0.8–1.4) | 1.8 (1.2–2.8) | 0.9 (0.7–1.1) | 0.233 |
Data are presented as median (range).
WBC, white blood cell; aPTT, activated partial thromboplastin time; AST, aspartate aminotransferase; ALT, alanine aminotransferase; LDH, lactate dehydrogenase; CK, creatine kinase; CK-MB, creatine kinase myocardial fraction; BUN, blood urea nitrogen.
a) Excluding 35 patients with SFTS for whom no laboratory results were available within 14 days of symptom onset.
b) Minimum,
c) maximum.
p-value calculated using independent sample t-test.
Data are presented as n (%) unless otherwise specified.
SFTS, severe fever with thrombocytopenia syndrome; OR, odds ratio; CI, confidence interval; WBC, white blood cell; aPTT, activated partial thromboplastin time; AST, aspartate aminotransferase; ALT, alanine aminotransferase; LDH, lactate dehydrogenase; CK, creatine kinase; CK-MB, creatine kinase myocardial fraction; BUN, blood urea nitrogen.
- 1. Yu XJ, Liang MF, Zhang SY, et al. Fever with thrombocytopenia associated with a novel bunyavirus in China. N Engl J Med 2011;364:1523−32.PubMedPMC
- 2. Xu B, Liu L, Huang X, et al. Metagenomic analysis of fever, thrombocytopenia and leukopenia syndrome (FTLS) in Henan Province, China: discovery of a new bunyavirus. PLoS Pathog 2011;7:e1002369.ArticlePubMedPMC
- 3. Rainey T, Occi JL, Robbins RG, et al. Discovery of Haemaphysalis longicornis (Ixodida: Ixodidae) parasitizing a sheep in New Jersey, United States. J Med Entomol 2018;55:757−9.ArticlePubMed
- 4. Kim WY, Choi W, Park SW, et al. Nosocomial transmission of severe fever with thrombocytopenia syndrome in Korea. Clin Infect Dis 2015;60:1681−3.ArticlePubMed
- 5. Singapore National Centre for Infectious Diseases (NCID). Severe fever with thrombocytopenia syndrome (SFTS) [Internet]. NCID; 2018 [cited 2023 Jan 3]. Available from: https://www.ncid.sg/Health-Professionals/Joint-MOH-NCID-Guidances/Pages/Severe-Fever-with-Thrombocytopenia-Syndrome.aspx.
- 6. Casel MA, Park SJ, Choi YK. Severe fever with thrombocytopenia syndrome virus: emerging novel phlebovirus and their control strategy. Exp Mol Med 2021;53:713−22.ArticlePubMedPMCPDF
- 7. Japan National Institute of Infectious Diseases. Severe fever with thrombocytopenia syndrome (SFTS) in Japan, as of June 2019. Infect Agents Surveillance Rep 2019;40:111−2.
- 8. Gai ZT, Zhang Y, Liang MF, et al. Clinical progress and risk factors for death in severe fever with thrombocytopenia syndrome patients. J Infect Dis 2012;206:1095−102.ArticlePubMed
- 9. Shin J, Kwon D, Youn SK, et al. Characteristics and factors associated with death among patients hospitalized for severe fever with thrombocytopenia syndrome, South Korea, 2013. Emerg Infect Dis 2015;21:1704−10.ArticlePubMedPMC
- 10. Noh BE, Ju JW, Lee HI. Surveillance of tick density in the Republic of Korea, 2021. Public Health Wkly Rep 2022;15:1596−605.
- 11. Liu S, Chai C, Wang C, et al. Systematic review of severe fever with thrombocytopenia syndrome: virology, epidemiology, and clinical characteristics. Rev Med Virol 2014;24:90−102.ArticlePubMedPMCPDF
- 12. Chen QL, Zhu MT, Chen N, et al. Epidemiological characteristics of severe fever with thtrombocytopenia syndrome in China, 2011-2021. Zhonghua Liu Xing Bing Xue Za Zhi 2022;43:852−9. Chinese.PubMed
- 13. National Institute of Infectious diseases (NIID). Summary of SFTS cases reported in the infectious disease outbreak surveillance system [Internet]. NIID; 2022 [cited 2022 Jul 31]. Available from: https://www.niid.go.jp/niid/ja/diseases/sa/sfts.html. Japan.
- 14. Korea Disease Control and Prevention Agency (KDCA). Guidelines for the management of tick-borne and Rodent-mediated infectious diseases [Internet]. KDCA; 2022 [cited 2022 Jul 31]. Available from: https://www.kdca.go.kr/board/board.es?mid=a20507020000&bid=0019. Korean..
- 15. Xu X, Sun Z, Liu J, et al. Analysis of clinical features and early warning indicators of death from severe fever with thrombocytopenia syndrome. Int J Infect Dis 2018;73:43−8.ArticlePubMed
- 16. You A, Yang J, Huang X, et al. Analysis on epidemiologic and clinical characteristics of fatal cases of severe fever with thrombocytopenia syndrome. Chin J Zoonoses 2014;30:453−7. Chinese.
- 17. Ding S, Niu G, Xu X, et al. Age is a critical risk factor for severe fever with thrombocytopenia syndrome. PLoS One 2014;9:e111736.ArticlePubMedPMC
- 18. Zhang YZ, He YW, Dai YA, et al. Hemorrhagic fever caused by a novel Bunyavirus in China: pathogenesis and correlates of fatal outcome. Clin Infect Dis 2012;54:527−33.ArticlePubMed
- 19. Cui N, Bao XL, Yang ZD, et al. Clinical progression and predictors of death in patients with severe fever with thrombocytopenia syndrome in China. J Clin Virol 2014;59:12−7.ArticlePubMed
 Cite
Cite