
Articles
- Page Path
- HOME > Osong Public Health Res Perspect > Volume 5(Suppl); 2014 > Article
-
Original Article
The Usefulness of the Tuberculosis Skin Test and the Interferon-gamma Release Assay in the Diagnosis of Latent Tuberculosis Infection in South Korea - Ju Young Jang, In Won Park, Byoung Whui Choi, Jae Chol Choi
-
Osong Public Health and Research Perspectives 2014;5(Suppl):S18-S23.
DOI: https://doi.org/10.1016/j.phrp.2014.10.009
Published online: November 12, 2014
Division of Pulmonary Medicine, Department of Internal Medicine, Chung-Ang University School of Medicine, Seoul, Korea
- ∗Corresponding author. medics27@cau.ac.kr
• Received: October 15, 2014 • Revised: October 26, 2014 • Accepted: October 27, 2014
© 2014 Published by Elsevier B.V. on behalf of Korea Centers for Disease Control and Prevention.
This is an Open Access article distributed under the terms of the CC-BY-NC License (http://creativecommons.org/licenses/by-nc/3.0).
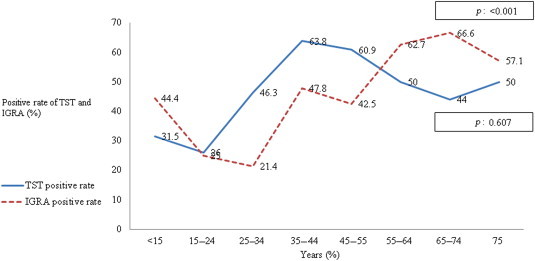
Figure & Data
References
Citations
Citations to this article as recorded by 
- Household tuberculosis contact investigation in a tuberculosis-prevalent country
Jung Seop Eom, Insu Kim, Won-Young Kim, Eun-Jung Jo, Jeongha Mok, Mi-Hyun Kim, Kwangha Lee, Ki Uk Kim, Hye-Kyung Park, Min Ki Lee
Medicine.2018; 97(3): e9681. CrossRef - QuantiFERON-TB Gold In-tube test for the diagnosis of active and latent tuberculosis in selected health facilities of Addis Ababa, Ethiopia
Selam Niguse, Kassu Desta, Gebremdihin Gebremichael, Atsebeha Gebrezgeaxier, Mulluwork Getahun, Desta Kassa
BMC Research Notes.2018;[Epub] CrossRef - Predictors for false-negative QuantiFERON-TB Gold assay results in patients with extrapulmonary tuberculosis
Youn Jeong Kim, Ji Young Kang, Sang Il Kim, Mee Soo Chang, Yang Ree Kim, Yeon Joon Park
BMC Infectious Diseases.2018;[Epub] CrossRef
 PubReader
 Cite
Cite
