Chronic kidney disease in Indonesia: evidence from a national health survey
Article information

Abstract
Objectives
Several previous studies have stated that consuming certain foods and beverages might increase the risk of chronic kidney disease (CKD). This study aimed to examine the relationships of food and beverage consumption with other risk factors for CKD.
Methods
Data sources included the 2018 Basic Health Research (Riskesdas) and the National Socio-Economic Survey (Susenas), which were analyzed using a cross-sectional design. The study samples were households from 34 provinces in Indonesia, and the analysis was performed with provincial aggregates. Data were analyzed using risk factor analysis followed by linear regression to identify relationships with CKD.
Results
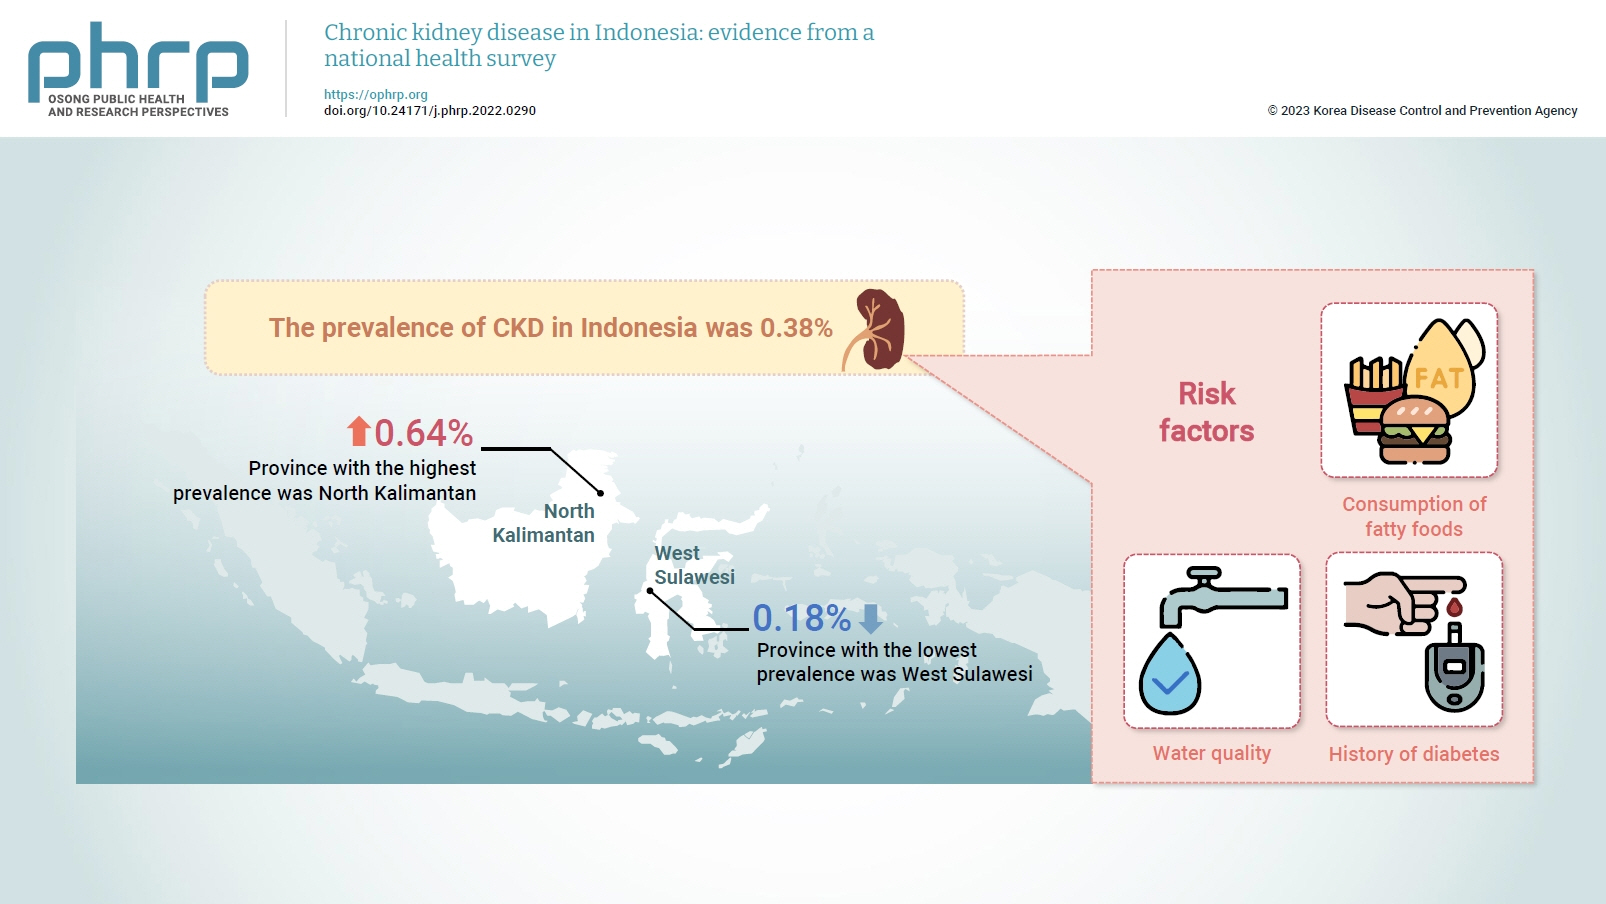
The prevalence of CKD in Indonesia was 0.38%. The province with the highest prevalence was North Kalimantan (0.64%), while the lowest was found in West Sulawesi (0.18%). Five major groups were formed from 15 identified risk factors using factor analysis. A linear regression model presented 1 significant selected factor (p=0.006, R2=31%). The final model of risk factors included water quality, consumption of fatty foods, and a history of diabetes.
Conclusion
Drinking water quality, fatty food consumption, and diabetes are associated with CKD. There is a need to monitor drinking water, as well as to promote health education and provide comprehensive services for people with diabetes, to prevent CKD.
Introduction
Chronic kidney disease (CKD) significantly contributes to the morbidity and mortality caused by non-communicable diseases. Its prevalence has steadily increased worldwide. Although hemodialysis and kidney transplantation are essential modalities that can save the lives of patients with CKD, they are often very expensive. The number of patients who will undergo kidney transplantation is expected to reach 5.4 million by 2030. This condition is increasing most rapidly in low- and middle-income countries. Globally, there are also significant inequalities in access to high-quality kidney disease treatment, and several low- and middle-income countries cannot meet the increasing need for dialysis [1].
According to the 2017 Global Burden of Disease study, CKD is the 12th leading cause of death. It directly causes about 1.23 million deaths, and 1.36 million additional deaths are associated with cardiovascular disease due to impaired kidney function [2].
During the coronavirus disease 2019 (COVID-19) pandemic, people with CKD were found to develop more severe symptoms of COVID-19 than patients without CKD [3]. Individuals with CKD also have a higher prevalence of hypertension and diabetes, which are associated with higher mortality due to COVID-19 [4,5].
When kidney activity has declined to the point that the kidneys no longer function, then a patient is considered to be in the chronic renal failure phase, which is the final and most severe stage of kidney disease. Medically, CKD is defined as a decrease in the renal filtration rate or the estimated glomerular filtration rate of less than 60 mL/min/1.73 m2 for 3 months or more. Patients are deemed to have chronic renal failure when their kidney function decreases to 85% or lower of baseline [6,7].
According to a study conducted in Africa, several factors influence CKD, including a history of hypertension, anemia, a family history of kidney disease, and consumption of coconut oil [8]. Several studies have also reported that diet is related to the incidence of CKD [9–11]. This is reinforced by several other investigations examining the relationship between CKD and the consumption of food and beverages, including foods high in fat and sugar [12], acidic foods [13], cholesterol [14], and drinking water [15,16]. A study conducted in Sri Lanka stated that drinking water with concentrations of cadmium, lead, and fluoride exceeding the maximum limit was associated with chronic kidney damage [17]. Other studies also suggested that high water intake might be associated with slower CKD development [18,19].
Kidney disease has long been a public health problem in Indonesia, and in 2007, it was one of the top 10 causes of death in rural areas in the 5- to 14-year age group [20]. The prevalence of doctor-diagnosed CKD in 2013 was 0.2%, while that of kidney stones was 0.6% [21]. It is estimated that these numbers will continue to increase in the future. In addition, previous studies stated that age, economic status, history of hypertension, sex, history of diabetes mellitus, and obesity [22], consuming energy drinks along with soft drinks [6], and the presence of coronary heart disease, stroke, and comorbidities [23] have a relationship with the occurrence of CKD. However, it is important to note that those previous studies highlighted overall impairments in kidney function, were mostly health facility-based, and were primarily conducted in single sub-districts. Therefore, this study analyzed data from national community-based surveys, focusing on long-standing cases of CKD (i.e., for at least 3 consecutive months), and analyzing the relationships of CKD with dietary patterns, beverage consumption, and a history of comorbidities.
Materials and Methods
Study Design and Sample
This study used a cross-sectional design and secondary data from the 2018 Basic Health Research (Riskesdas) and the National Socio-Economic Survey (Susenas). Riskesdas is a national health survey conducted by the National Institute of Health Research and Development–Ministry of Health in 34 provinces in Indonesia. The target samples included 300,000 households from 30,000 census blocks Susenas is conducted by the Central Statistics Agency with probability proportional to size sampling derived using a linear systematic sampling method [24].
Dependent Variable
The dependent variable in this study was the prevalence of CKD, measured as a numeric outcome. The related survey question was “Has [NAME] ever been diagnosed by a doctor as suffering from chronic kidney failure? or at kidney disease for least 3 months consistently?” According to the Riskesdas questionnaire interview guideline, CKD is defined according to the Indonesian Nephrology Association as kidney damage both in structure and/or function that lasts for 3 months or more [25].
Independent Variables
This study focused on food intake, beverage consumption, and comorbid conditions that are related to CKD. The independent variables were defined as the percentage of respondents who reported consuming the listed food at least twice per day in the last month. The food consumption habits comprised salty, flavored, fatty, and grilled food, as well as foods with preservatives, instant food, sugary beverages, soft and energy drinks, alcohol, and plain drinking water. Smoking behavior and hygienic behavior (handwashing) were also investigated. In addition, participants’ history of comorbid diseases (e.g., hypertension or diabetes mellitus) was also included as an independent variable.
The drinking water quality variable was defined referring to the guidelines from the Joint Monitoring Program (World Health Organization [WHO]/United Nations International Children’s Emergency Fund [UNICEF]), which states that the time to obtain water should be less than 30 minutes, the physical quality of good drinking water is characterized by no color, no smell, no taste, and no turbidity or foam [26,27], and the distance from a waste disposal site must be more than 10 meters [28]. According to the WHO/UNICEF, the potential of water sources to produce safe water depends on their nature, design, and construction. The sources of improved drinking water commonly used by residents are piped water, drilled or tube wells, protected dug wells, protected springs, rainwater, and bottled water [29]. Additionally, hygienic behavior was defined as the habit of washing one’s hands with soap and running water before preparing food, whenever one’s, hands are dirty due to the process of handling money, interacting with animals or gardening, as well as after defecating, bathing babies/children, and using pesticides/insecticide, and before feeding a baby and eating [24].
Study Tools
The 2018 Riskesdas and Susenas reports were used as a tool in this study. From these 2 reports, the independent and dependent variables were obtained and recorded in Excel (Microsoft Corp.) as a new subset of data for further analysis.
Instrument reliability and validity
Cronbach’s alpha is a measure of internal consistency, and its values range from 0 to 1. A value greater than 0.60 is considered to indicate that an instrument is reliable and acceptable. A high Cronbach’s alpha shows that the items in an instrument are highly correlated [30].
Statistical Analysis
Since this study aimed to identify foods and beverages associated with the prevalence of CKD, it started by identifying several types of foods and beverages that were frequently consumed by survey participants, as well as their history of comorbid conditions. Fifteen variables were analyzed: salty, flavored, fatty, and grilled food; foods with preservatives; instant foods; sugary, soft, and energy drinks; alcohol; and plain drinking water. In addition, smoking behavior, personal hygiene, and comorbidities such as diabetes mellitus and hypertension were analyzed to determine their relationship with CKD.
First, a descriptive analysis was performed. The Kaiser-Meyer-Olkin (KMO) measure of sampling adequacy, which has values ranging from 0 to 1, was used to test the feasibility of factor analysis. A KMO value >0.5 indicates that factor analysis is feasible [31]. Bartlett test of sphericity is a statistical test to test whether variables are correlated. A significant value (<0.05) indicates that there is a relationship among the variables [31].
Next, factor analysis was performed to reduce the number of the original variables by examining the covariance before conducting linear regression. The basic purpose of factor analysis is to identify relationships between variables by conducting a correlation test. It is useful to apply factor analysis to focus on only a few manageable factors rather than a large number of variables [31]. Meanwhile, linear regression was carried out to determine the relationship between CKD and the factors that were formed. All statistical analyses were performed with IBM SPSS ver. 21.0 (IBM Corp.).
Ethics Approval
Ethical approval and permission for conducting this study followed the Ethical Approval for RISKESDAS 2018 from Komisi Etik Penelitian Kesehatan, Badan Penelitian dan Pengembangan Kesehatan (Ethical Committee of Health Research, National Institute of Health Research and Development–Ministry of Health, Republic of Indonesia) No. LB.02.01/2/KE.267/2017.
Results
Overview of CKD Prevalence and Risk Factors
Data on CKD collected from 34 provinces in Indonesia in 2018 were analyzed. The average prevalence was 0.38%, meaning that 4 out of 1,000 people were diagnosed with CKD. The highest prevalence was found in North Kalimantan Province, while the lowest was in West Sulawesi, as shown in Figure 1.
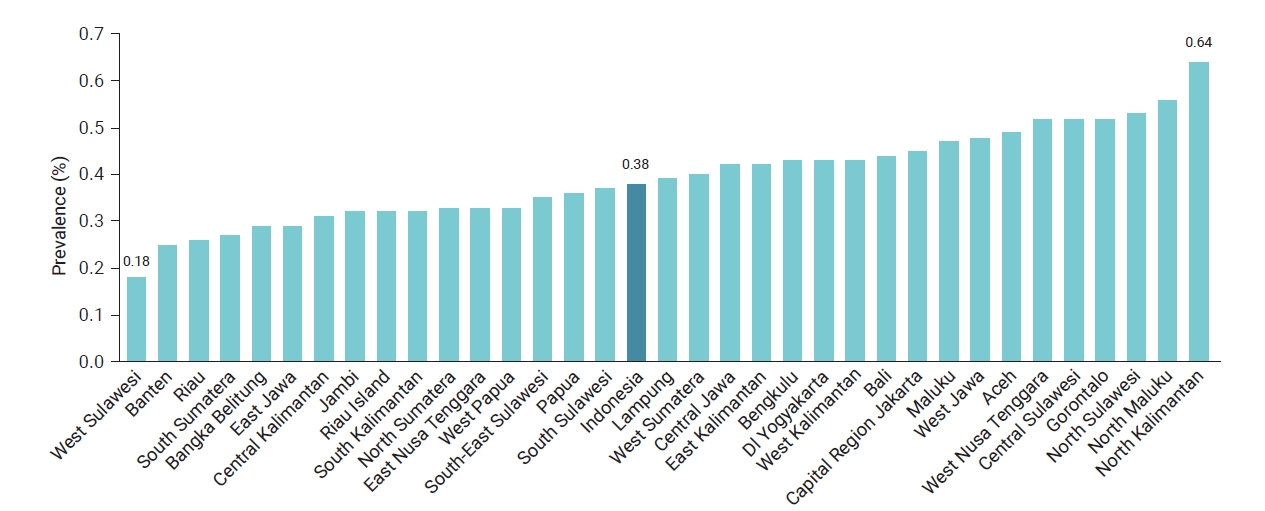
Prevalence of chronic kidney disease by province in Indonesia, 2018.
Figure 2 shows several bars and points representing the conditions of each province. The blue bars represent the percentage of respondents with good water quality, while the percentages of food/beverage consumption, comorbidities, and handwashing behavior are represented by dots. A greater number of dots displayed at the top of the bar indicates a higher risk of CKD in the province. In general, the quality of drinking water in all provinces was moderate, with the highest percentage of good water quality occurring in Capital Region (Daerah Khusus Ibukota) Jakarta Province. Furthermore, the percentage of flavored food consumption was very high in almost all provinces. The highest percentage of fatty food consumption was found in Central Java Province, while the highest percentage of alcohol consumption was in North Sulawesi. Salty foods were most frequently consumed by residents in West Java Province, while sweet beverages were most frequently consumed in Yogyakarta Province, as shown in Figure 2.
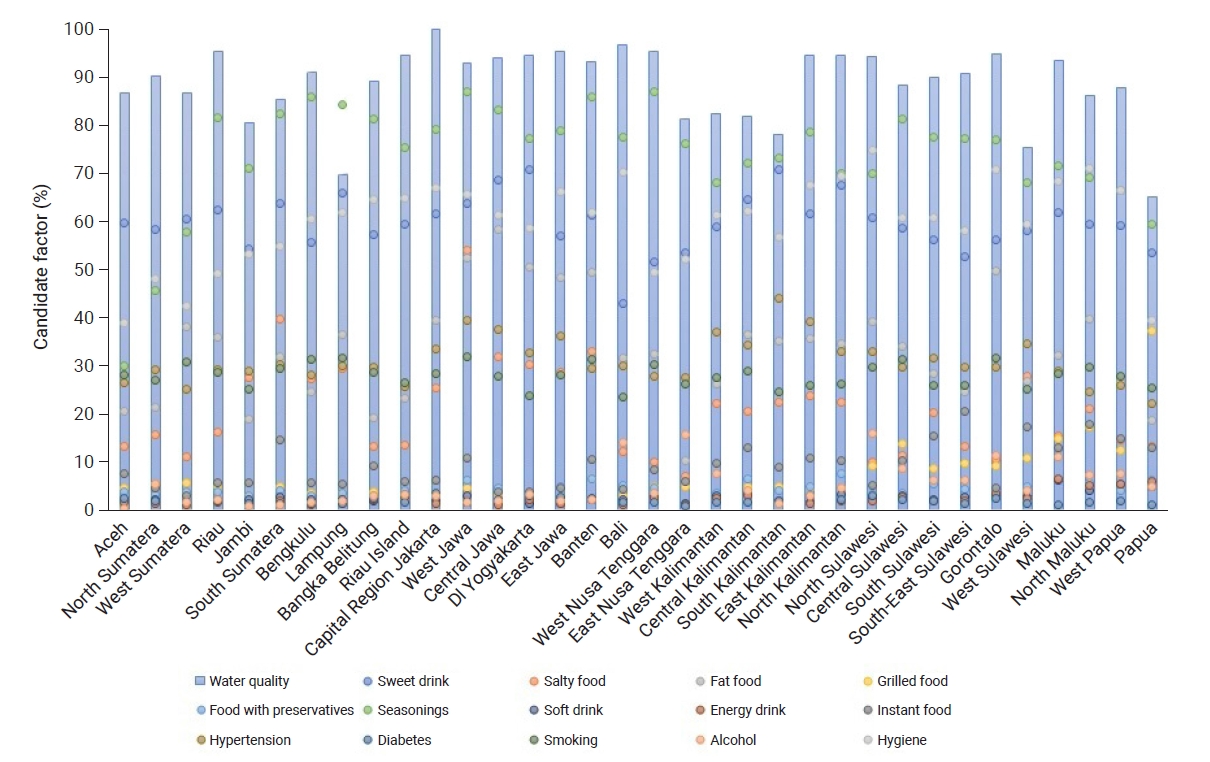
Candidate factors associated with chronic kidney disease by province in Indonesia, 2018.
Descriptive Statistics and Factor Analysis
This study used factor analysis to extract a smaller set of variables from the large number of original variables to make linear regression more manageable. Fifteen independent variables were assumed to have a relationship with CKD. To analyze the associations of variables, the KMO method was used to measure the suitability of data for factor analysis. As shown in Table 1, the KMO statistic was 0.559. This value was >0.5, which indicates that sampling was adequate. The Bartlett test of sphericity value was 292.42, with a significance of <0.001, which met the requirements because the significance was below 0.05 (5%).

The Kaiser-Meyer-Olkin test and Bartlett test of sphericity
Table 2 shows the eigenvalues and total variance obtained from principal component analysis. Before extraction, 15 linear components were identified within the data set. After extraction and rotation, there were 5 distinct linear components within the data set with eigenvalues >1. These 5 factors accounted for a combined 78.3% of the total variance. This is supported by the KMO value of 0.559, which can be considered adequate and also indicates that factor analysis was useful for the variables.

Grouping of variables in the statistical test results of factor analysis
The 5 factors formed were as follows. Factor 1 consisted of grilled food, food containing preservatives, instant food, soft drinks, and energy drinks. Factor 2 comprised sweet and salty foods, alcoholic beverages, and hypertension. Meanwhile, factor 3 consisted of the quality of drinking water, fatty foods, and diabetes, while the components in factor 4 included hygienic behavior and food flavorings, and factor 5 consisted of smoking behavior.
Reliability and Validity
Validity tests were carried out to determine the precision of the variables used, while reliability tests were performed to analyze the internal consistency through Cronbach’s alpha. A validity value ≥0.5 is considered satisfactory, while the adequate threshold value for Cronbach’s alpha is ≥0.6 [30]. In this analysis, the validity value was 91.9%, while Cronbach’s alpha of the 15 variables was 0.622; thus, both thresholds were exceeded. This shows that the variables exhibited correlations with their component grouping, meaning that they were internally consistent.
Multivariable Linear Regression
To identify risk factors associated with CKD, multivariable analysis was performed on the 5 factors. Table 3 shows the multivariate model of linear regression analysis of the 5 factors in relation to CKD. The model showed an R2 of 31% and a significant p-value, as demonstrated in Table 3. Factor 3, which comprised the quality of drinking water, fatty foods, and diabetes, showed a significant relationship with CKD. The final model, which contained water quality, fatty food, and diabetes, had a significant association with CKD (p=0.006) (Table 4).

Multivariable linear regression test results

Final model
Discussion
Main Findings
The results showed that the risk of CKD was relatively high in people who often consumed fatty foods, drank unhealthy water, and had diabetes mellitus. The highest prevalence was found in North Kalimantan Province.
Factors Associated with CKD
Based on the results, people who drink unhealthy water are more likely to develop CKD than those who consume quality water. This is most likely due to the presence of chemical substances and minerals associated with impaired kidney function in poor-quality water. Arsenic exposure is associated with the risk of end-stage renal disease, and this effect is modified by comorbidities, which should be treated in the early stages [32]. Water from wells with higher levels of total dissolved solids and arsenic had a positive correlation with the occurrence of CKD [16]. Furthermore, consuming drinking water from dug wells contaminated with cadmium, lead, and fluoride can increase the prevalence of CKD [33,34]. Soil contamination with toxic metals and fluoride presumably comes from agricultural fertilizers in the long term, which continuously causes groundwater contamination [17]. Balanced levels of minerals in drinking water have a beneficial effect on kidney health [35]. There is also a need to strengthen the water quality surveillance system to reduce the risk of disease. This is important for achieving the Sustainable Development Goal targets for improving water quality and identifying populations at risk [36].
The results also showed that people who consumed more fatty foods were more likely to have CKD. This is consistent with a previous study that stated that consuming a high-fat diet was associated with a significant increase in the likelihood of developing CKD [12]. In contrast, the consumption of fruits and vegetables, along with a lower intake of red and processed meat, is associated with a reduced incidence of CKD [10]. Another study suggested that a low-acid diet slows the development of CKD [13].
The analysis also showed that comorbid diabetes mellitus might increase the occurrence of CKD. Subjects with diabetes mellitus are more likely to develop CKD than normal individuals. However, diabetes care has been found to be associated with a decreased risk of developing kidney disease [37]. Moreover, comprehensive care is recommended for the management of patients with diabetes and kidney disease to prevent cardiovascular disease. For example, moderate physical activity of at least 150 minutes per week is recommended, along with smoking cessation, reducing obesity, salt restriction, and a low-protein diet [38].
Based on the results, there is a need to increase the monitoring of drinking water for public consumption. In addition, it is important to increase public knowledge about the risks associated with excessive consumption of fatty foods, as well as comprehensive care for patients with diabetes, including a healthy lifestyle to prevent severe disease. It is assumed that the relationships of CKD with the quality of drinking water and fatty foods have great potential for further investigations using other methods and designs, such as cohort studies supported by comprehensive laboratory examinations.
Strengths and Limitations
The major strength of this analysis is that it used data from the results of a national public health survey. This implies that it can describe the prevalence of the disease nationally with a large sample, but there were also limitations. As a national health survey with a cross-sectional method, water quality and disease were evaluated based on interviewees’ statements using a structured questionnaire, not based on the results of laboratory measurements.
Conclusion
This study found a relationship between CKD and unhealthy drinking water, excessive fatty food consumption, and a history of diabetes mellitus. Based on these results, there is a need to safely manage drinking water and increase public knowledge about the risks of consuming fatty foods to reduce the risk of CKD. Comprehensive care for patients with diabetes and a healthy lifestyle are also important to prevent disease progression.
Notes
Ethics Approval
Ethical approval and permission for conducting this study followed the Ethical Approval for RISKESDAS 2018 from Komisi Etik Penelitian Kesehatan, Badan Penelitian dan Pengembangan Kesehatan (Ethical Committee of Health Research, National Institute of Health Research and Development–Ministry of Health, Republic of Indonesia) No. LB.02.01/2/KE.267/2017.
Conflicts of Interest
The authors have no conflicts of interest to declare.
Funding
None.
Availability of Data
The datasets are not publicly available but are available from the corresponding author upon reasonable request.
Authors’ Contributions
Conceptualization: PSH, DHT; Data curation: DHT, ID; Formal analysis: DHT, ID; Methodology: NEWS, NS; Supervision: PSH; Validation: PSH, NEWS, NS, FA; Visualization: FA; Writing-original draft: PSH, ID; Writing review & editing: PSH, DHT, NEWS, NS, ID, FA. All authors read and approved the final manuscript.
Acknowledgements
The authors are grateful to the Health Research and Development Agency, Ministry of Health, Central Statistics Agency, a team of experts and consultants, supervisors, participants, as well as the study and data collection team for their support and involvement.