Clinical epidemiological applicability of real-time polymerase chain reaction for COVID-19
Article information

Abstract
Objectives
Real-time polymerase chain reaction is currently used as a confirmatory test for coronavirus disease 2019 (COVID-19). The test results are interpreted as positive, negative, or inconclusive, and are used only for a qualitative classification of patients. However, the test results can be quantitated using threshold count (Ct) values to determine the amount of virus present in the sample. Therefore, this study investigated the diagnostic usefulness of Ct results through various quantitative analyzes, along with an analysis of clinical and epidemiological characteristics.
Methods
Clinical and epidemiological data from 4,642 COVID-19 patients in April 2021 were analyzed, including the Ct values of the RNA-dependent RNA polymerase (RdRp), envelope (E), and nucleocapsid (N) genes. Clinical and epidemiological data (sex, age, underlying diseases, and early symptoms) were collected through a structured questionnaire. A correlation analysis was used to examine the relationships between variables.
Results
All 3 genes showed statistically significant relationships with symptoms and severity levels. The Ct values of the RdRp gene decreased as the severity of the patients increased. Moreover, statistical significance was observed for the presence of underlying diseases and dyspnea.
Conclusion
Ct values were found to be related to patients’ clinical and epidemiological characteristics. In particular, since these factors are closely related to symptoms and severity, Ct values can be used as primary data for predicting patients’ disease prognosis despite the limitations of this method. Conducting follow-up studies to validate this approach might enable using the data from this study to establish policies for preventing COVID-19 infection and spread.

Introduction
Coronavirus disease 2019 (COVID-19) has spread worldwide, starting with a cluster infection of pneumonia of unknown cause in Wuhan, China, in December 2019. On January 31, 2020, the World Health Organization (WHO) confirmed that COVID-19 had spread rapidly from person to person and declared a public health emergency [1–4]. A global pandemic was declared on March 11, 2020. Countries thereafter strengthened their quarantine and healthcare measures. As the number of COVID-19 patients and deaths increased rapidly in Korea, the national crisis alert level (for infectious disease) was raised to the highest level, “serious,” on February 23, 2020, and prompt action was taken [5]. Despite global efforts, there were 239 million confirmed cases and 4 million deaths worldwide as of October 2021, and 340,000 confirmed cases and 2,000 deaths occurred in Korea [6]. Research is ongoing in various fields to prevent the spread of COVID-19 domestically and worldwide. Most research has analyzed factors affecting disease severity and clinical outcomes [7–9]. Relationships between demographic characteristics such as weight [10,11], underlying diseases [12,13], symptoms, age [14], race [15], sex [16,17], lifestyle [18–20] and epidemiological factors have been analyzed [21–23].
Real-time reverse-transcription quantitative polymerase chain reaction (RT-qPCR) has advantages and disadvantages due to the test itself and the sampling method [24–27]; nonetheless, it is used as a confirmatory method for diagnosing COVID-19. It is used primarily as a qualitative analysis to determine positive or negative status. However, numerical experimental values have been used in publications for quantitative analysis to interpret the test results (e.g., false-positive and false-negative) [28–32] and to identify the most appropriate sampling time or site to obtain accurate test results [33].
Combining the above features and experimental values and qRT-PCR with clinical epidemiological analyzes enables various interpretations and analyzes. Therefore, this paper aimed to utilize experimental values for epidemiological investigations through a clinical and epidemiological analysis of confirmed COVID-19 patients.
Materials and Methods
Study Subjects
The subjects were those who had complete records of clinical and epidemiological information among 18,927 confirmed COVID-19 cases from April 1 to April 30, 2021. The period of analysis was limited to ensure the fidelity of the data and to enable a thorough verification of typos/errors. Patients with inaccurate or missing information were excluded. In addition, only confirmed patients whose outcomes were certain (removed from quarantine or confirmed as dead) were included. The clinical and epidemiological data included age, sex, the presence or absence of symptoms, initial symptoms, underlying diseases and diagnostic tests (cycle threshold [Ct] values). All data were collected through epidemiological investigation reports registered in the COVID-19 information management system, supplemented, and verified through in-depth epidemiological investigation reports and electronic case report forms for information such as the severity classification. The data were reconfirmed using patient monitoring data conducted by the Patient Management Team of the Central Quarantine Countermeasures Headquarters. As a result, a total of 4,642 confirmed cases were analyzed.
The initial symptoms were classified as fever, respiratory symptoms (cough, phlegm, sore throat, dyspnea), non-respiratory symptoms (muscle pain, headache, chills, loss of taste, loss of smell), and pneumonia (including whether pneumonia was confirmed on a chest X-ray) according to the classification of the basic epidemiological survey. Severe cases followed the classification given in the 10th edition of the COVID-19 response guidelines (Table 1).

Definitions of intensive care stages, indicating severity
The experimental values used for analysis were the Ct values of RT-qPCR for the RNA-dependent RNA polymerase (RdRP), envelope (E) gene, and nucleocapsid (N) genes, as recommended by the Korea Disease Control and Prevention Agency and the Korean Society of Diagnostic Laboratory Medicine and currently used to diagnose confirmed patients [34–38]. The Korean Society of Diagnostic Laboratory Medicine and the Korea Disease Control and Prevention Agency recommend using RT-qPCR to detect 2 or more specific genes and to classify the results as positive when all genes are positive [39–41]. Diagnostic reagents and kits approved for emergency use or formally approved by the Ministry of Food and Drug Safety containing 2 or more genes were used [42].
Unlike in other studies, control variables were considered in the above analysis. RT-qPCR is the method with the highest sensitivity and specificity and is used as a standard test for COVID-19 infection worldwide. However, it has some limitations, including the need for dedicated equipment, reagents, and skilled professionals. The equipment and reagents must undergo accurate calibration, verification, validation, and quality control. In addition, the Ct value should be read along with waveform analysis to determine whether gene amplification was performed correctly. Furthermore, RT-qPCR diagnostic kit manufacturers have small differences in the target region of the gene, from 1 to 2 nucleotide sequences to 1 to 2 codons (3 to 6 base sequences) to avoid patent infringements. Since the cut-offs of the Ct values are different for each manufacturer, errors could occur when comparing the Ct values. Hence, the analysis was limited to a single manufacturer’s diagnostic kit that went through domestic and foreign gene-related certification procedures (CAP; College of American, ISO 9001, CLIA; Clinical Laboratory Improvement Amendments) to minimize differences in these variables. In fact, when the analysis was expanded to several diagnostic kits, the results were different. In addition, since the viral load changes in a time-dependent manner after infection with COVID-19, the samples were limited to 2 days from the onset of symptoms to the date of confirmation [43–47].
Analysis
Data were analyzed using GraphPad Prism software ver. 5.02 (GraphPad, La Jolla, CA, USA) and PASW Statistics for Windows ver. 18.0 (SPSS Inc., Chicago, IL, USA) together with Microsoft Excel 2016 (Microsoft Corp., Redmond, WA, USA). For the normality test, the Kolmogorov-Smirnov test and Shapiro-Wilk test were performed. The statistical significance of differences in parametric and nonparametric variables was analyzed using the Student t-test and Mann-Whitney U-test. The Spearman rho and Kendall tau-b coefficients were used to analyze the correlations between variables. All statistical analyzes were considered to have statistical significance when the p-value was <0.05, presented as follows in the tables and figures: p<0.05, p<0.01, or p<0.001.
IRB/IACUC Approval
The study protocol was approved by the Institutional Review Board of the Korea Disease Control and Prevention Agency (IRB No: 2022-03-08-PE-A). The requirement for informed consent was waived because of the retrospective nature of this study and the Infectious Disease Control and Prevention Act..
Results
Demographic Characteristics
A total of 4,642 confirmed patients were included in the study; 2,288 were males (49.3%), and 2,354 were females (50.7%), with an even male-to-female ratio (Table 2). The average age was 43.7±0.58 years. Slightly more than one-fifth of the patients (n=949, 20.4%) were in their 50s, while 753 were in their 40s (16.2%), 694 in their 60s (15.0%), 586 in their 30s (12.6%), 501 in their 20s (10.8%), 480 were 10 to 19 years old (10.3%), 276 were under 10 years old (5.9%), 236 were in their 70s (5.1%), and 164 were over 80 years or older (3.5%). Approximately one-third of patients had underlying diseases (n=1,541, 33.2%). There were 3,301 (71.1%) patients with symptoms. All patients with symptoms had fever (n=3,301, 71.1%), followed by cough (n=1,389, 29.9%), sore throat (n=1,133, 24.4%), myalgia (n=952, 20.5%), other symptoms (n=840, 18.1%), headache (n=721, 15.5%), chills (n=701, 15.1%), phlegm (n=697, 15.0%), loss of smell (n=205, 4.4%), loss of taste n=181, 3.9%), dyspnea (n=44, 0.9%), and pneumonia (n=33, 0.7%). Other symptoms included chest pain, body aches, diarrhea, runny nose, stuffy nose, and fatigue.

The clinical epidemiological characteristics of COVID-19 cases in this study (n=4,642)
Distribution of the Ct Values of the RdRp, E, and N genes
Patients who had experimental values for all 3 genes were included in this study. The mean Ct values of the RdRp, E, and N genes were 21.5, 21.6, and 22.9, respectively (Figure 1). The minimum and maximum values were 2.9 and 38.3 for the RdRp gene, 3.1 and 38.3 for the E gene, and 3.9 and 51.5 for the N gene, respectively. The Korean Society of Diagnostic Laboratory Medicine and the Korea Disease Control and Prevention Agency recommend interpreting the results as positive when 2 or more of the 3 genes are positive [44–46]. The standard deviations were 6.3, 6,1, and 6,2, respectively.
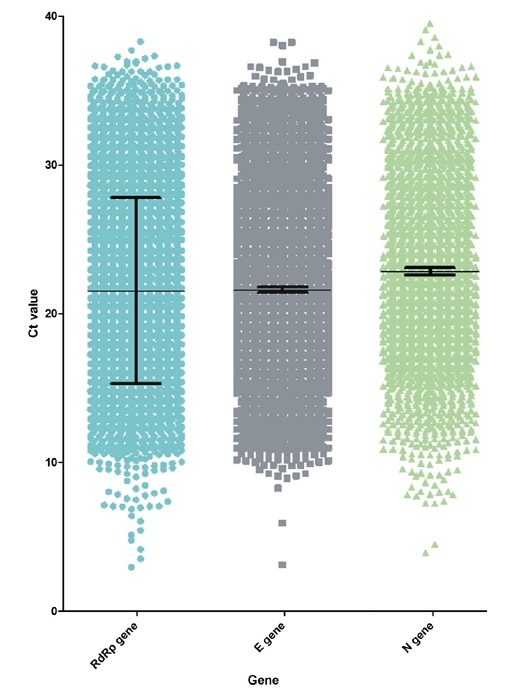
Distribution of Ct values. The blue, grey, and green dots represent the Ct values of the RdRp, E, and N genes, respectively. The black bars indicate mean values with standard deviations.
Ct, threshold count; RdRp, RNA-dependent RNA polymerase; E, envelope; N, nucleocapsid.
Ct Distribution of the RdRp, E, and N Genes according to the Presence of Symptoms
As shown in Table 2, among the 4,642 confirmed patients, 3,301 (71.1%) had initial symptoms, which was a high proportion. When comparing the Ct values according to the presence or absence of symptoms, the RdRp, E, and N genes all showed a significant difference (p<0.001) in the distribution of Ct values between asymptomatic and symptomatic individuals (Figure 2). The median Ct values of the RdRp gene in symptomatic and asymptomatic patients were 24.6 and 19.3, respectively. For the E gene, the median Ct values were 24.5 and 20.5, respectively. For the N gene, the median Ct values were 25.6 and 21.7, respectively.
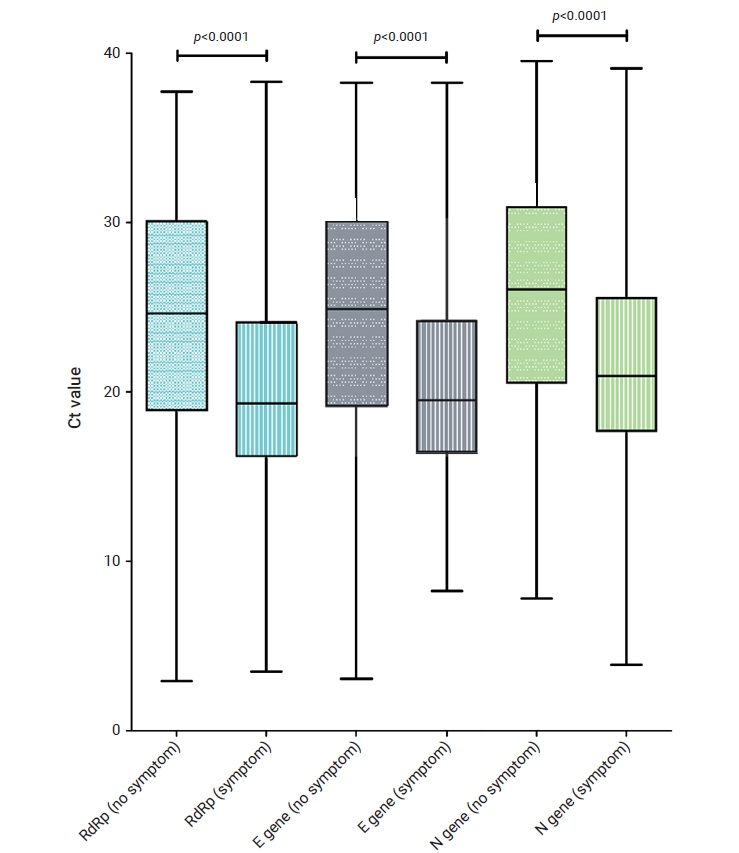
Distribution of Ct values according to the presence or absence of symptoms. The blue, grey, and green columns represent the Ct values of the RdRp, E, and N genes, respectively. The black bars indicate mean values with standard deviations.
Ct, threshold count; RdRp, RNA-dependent RNA polymerase; E, envelope; N, nucleocapsid.
Correlations between Severity and Ct Values of the RdRp, E, and N Genes
Prior to conducting several other correlational analyzes, the effect of age on Ct values was investigated. When the Ct values were compared by each age group (under 10, 10−19, 20s, 30s, 40s, 50s, 60s, 70s, and over 80), none of the p-values were significant (p>0.05 for all). After confirming the absence of a correlation between age and Ct value distribution, the analysis was conducted without further consideration of age.
The correlations between Ct values and symptom severity were analyzed in symptomatic subjects. The severity classification followed the 8-level classification according to the COVID-19 Response Guidelines (10th edition). In this study, analysis was limited to levels 4 to 7, since they were monitored for patient management in real time. Nonparametric analysis was performed using the Spearman rho coefficient. All statistical analyzes showed statistical significance (p<0.05), and the R2 values were 0.5, 0.4, and 0.2 for RdRp, E, and N, respectively (Figures 3, 4). The R2 value for the RdRp gene was higher than 0.5, showing a correlation between severity and the Ct value.

Distribution of Ct values according to the severity level. The blue, grey, and green columns represent the Ct values of the RdRp, E, and N genes, respectively. The numbers 4, 5, 6, 7, and 8 on the X-axis represent O2 with nasal prongs, O2 with a facial mask, non-invasive ventilation/high-flow O2, invasive ventilation, and multi-organ failure/ECMO/CRRT, respectively. The black bars indicate mean values with standard deviations.
Ct, threshold count; RdRp, RNA-dependent RNA polymerase; E, envelope; N, nucleocapsid.

Scatter plot of Ct values according to severity levels. The blue, red, and gray lines represent trend lines for the RdRp, E, and N genes, respectively. The X-axis presents the severity classification and the Y-axis shows Ct values.
Ct, threshold count; RdRp, RNA-dependent RNA polymerase; E, envelope; N, nucleocapsid.
Correlations and Associations between RdRp, E, and N genes and Clinical and Epidemiological Characteristics
To examine the correlations between each gene and clinical and epidemiological characteristics, statistical significance was analyzed using the Mann-Whitney U-test (nonparametric statistical analysis when normality was not satisfied) when the independent variable was nominal (e.g., sex or the presence of underlying diseases). When the independent variable was continuous, such as age, the trend was analyzed through rank correlation analysis using Spearman coefficients (nonparametric statistical analysis when normality was not satisfied). Correlations (Table 3) were analyzed with sex and the presence of underlying diseases. Statistical significance was found for the presence of underlying diseases, but not for sex. The average Ct value of the RdRp gene in subjects without underlying diseases was 21.76, while it was 21.11 in subjects with underlying diseases, showing a slight difference. For the E gene, the average Ct value in subjects without underlying diseases was 21.80, whereas it was 21.22 in subjects with underlying diseases, likewise showing a slight difference. The analysis of associations between Ct values and each underlying disease showed statistical significance for the N gene in dementia patients (Table 4).

Associations between sex, underlying disease, and Ct values (p-value)

Associations between underlying diseases and Ct values (n=1,911)
Correlational Analysis between the RdRp, E, and N Genes and Symptoms
Since the Ct values showed statistically significant relationships with the presence of symptoms (Figure 2), an additional correlational analysis was performed for each type of symptom (Table 5). Statistical significance was found for the Ct count of the RdRp gene and dyspnea, a respiratory symptom.

Correlational analysis between Ct values and symptoms
Discussion
This study analyzed correlations and associations between the RdRp, E, and N genes and various clinical and epidemiological characteristics. Quantitatively analyzing the Ct values of these genes led to various interpretations. First, the distribution of each variable was identified (Table 2). The male-to-female ratio (49.3% vs. 50.7%) of the study subjects was similar to the male-to-female ratio (50.9% vs. 49.1%) of all confirmed cases in Korea [48]. Instead, other characteristics showed skewed ratios, different from the ratios of all confirmed cases in Korea. The distribution did not follow the normal distribution of the population. Thus, nonparametric methods (the Mann-Whitney U-test and Spearman rho coefficient) were used. Before comparing several clinical and epidemiological characteristics, the distribution of experimental values for each gene was presented (Figure 1). Similar distributions were shown for the median, mean, standard deviation, and percentile.
In this study, symptomatic patients accounted for a high proportion (71.1%) of confirmed patients, and the experimental values showed a significant difference between the asymptomatic and symptomatic groups (Figure 2). The Ct value does not represent the exact viral load, but a higher value corresponds to a relatively low viral load [49]. For all 3 genes, the average Ct value of symptomatic subjects was lower than the average Ct value of asymptomatic subjects, with all differences being statistically significant (p<0.0001). In other words, more virus was detected in patients with symptoms. In particular, the difference in the average Ct value between symptomatic and asymptomatic patients was 4.09 for the RdRp gene, whereas smaller differences were reported for the other genes (E gene, 4.05; N gene, 3.85). Somewhat contradictory data have been published regarding these relationships [50]. As the Ct values of symptomatic and asymptomatic patients were similar in that study, it was concluded that the amounts of virus were also similar. However, it is difficult to compare the results because the age group (median age, 25 years) and the percentage of underlying diseases (3%) of the subjects of that study differed from the distribution of confirmed patients in Korea and in our study. A study [50] reporting no difference in Ct between asymptomatic and symptomatic patients did not find statistical significance in the E and N genes but, consistent with our study results, showed a significant difference (p=0.048) in the RdRp gene. This suggests that there is a difference in viral load between asymptomatic and symptomatic patients.
The distribution of Ct values was also examined for each severity level, and significant differences were found (Figures 3, 4). The RdRp gene showed the highest correlation, as evaluated using the Spearman rho coefficient. Therefore, this finding can be interpreted as indicating that patients with lower Ct values are more likely to progress to critical severity. Reflecting this finding in policy [51] could reduce the fatality rate, since high-risk patients such as those with low Ct values could be allocated for intensive management.
The RdRp gene yielded consistent results in various correlational analyzes, possibly reflecting the gene’s characteristics. The RdRp gene is relevant to severe acute respiratory syndrome coronavirus 2 (SARS-CoV-2), the causative agent of COVID-19, as an RNA polymerase (RdRP) involved in viral replication [38]. In particular, this gene has high sensitivity and specificity in diagnosing COVID-19 and is included in most commercially available PCR diagnostic kits [47]. The E gene encodes the coat protein of the coronavirus. It is a gene detected in all beta coronaviruses (SARS-CoV, Middle East respiratory syndrome coronavirus, and SARS-CoV-2), with relatively low specificity for diagnosing COVID-19. The N gene protects the viral nucleic acid and promotes adhesion to the host cell by forming a COVID-19-specific nucleocapsid. Compared to the E gene, the N gene is specific to COVID-19, but relatively less relevant to pathogenicity than the RdRp gene, which is directly responsible for synthesizing SARS-CoV-2 viral material. For this reason, the Korea Disease Control and Prevention Agency and the WHO have recommended using the RdRp gene for confirmatory testing from the beginning of the outbreak [39,40]. This seems to be reflected in the clinical epidemiological results. In addition to symptoms and severity, the associations of Ct values with clinical and epidemiological characteristics were also analyzed (Tables 3–5). Statistically significant relationships were found between Ct values and the presence of underlying diseases. Analyzes were also performed for each symptom (Table 5), since statistically significant results were found for asymptomatic versus symptomatic patients. Statistical significance was confirmed only in dyspnea, which reflects an unusual association between Ct values and severity. However, dyspnea is directly related to the development of a severe course of disease that progresses through moderate symptoms requiring non-tubular oxygen treatment and an oxygen mask.
Several limitations of this study should be noted. An attempt was made to analyze the trend/life cycle of Ct values measured from hospitalization to discharge, but such an analysis was not feasible due to the absence of repeatedly measured Ct values. Above all, a limitation in analyzing Ct values relates to the use of relative quantitative values for measuring the amount of fluorescence. Since this is a relative quantity, the Ct values fluctuate in every measurement, even with the same samples. It is necessary to analyze samples with absolute quantitative values to compare gene expression levels more accurately. To analyze the results, the housekeeping gene (a gene that is always expressed in any cell) is amplified as a reference gene and an internal control gene for each PCR analysis, and an absolute quantitative analysis can be performed through the delta-Ct (ΔCt) formula [52]. However, in the basic epidemiologic survey, the Ct values of the target genes (RdRp, E, and N) could be derived, but the Ct values of a reference gene and internal control gene were not available, making an absolute quantitative analysis impossible. Another limitation was that there was no control group (negative samples) because only the Ct values for positive samples were entered in the basic epidemiological survey. Various follow-up studies using a wide range of variables could be conducted to overcome these limitations. If so, it might be possible to use RT-PCR-derived Ct values as important primary data for policy establishment to prevent COVID-19 and the spread of infection.
Notes
Ethics Approval
The study protocol was approved by the Institutional Review Board of the Korea Disease Control and Prevention Agency (IRB No. 2022-03-08-PE-A). The requirement for informed consent was waived because of the retrospective nature of this study and the Infectious Disease Control and Prevention Act.
Conflicts of Interest
The authors have no conflicts of interest to declare.
Funding
None.
Availability of Data
The datasets are not publicly available but are available from the first author upon reasonable request.
Authors’ Contributions
Conceptualization: GK, JG; Data curation: GK, JK, JL; Formal analysis: GK, JKK; Investigation: GK, JK, JL; Methodology: GK, JKK, JG; Project administration: GK; Resources: GK; Software: GK; Supervision: JG; Validation: JG; Visualization: GK, JKK; Writing–original draft: GK; Writing–review & editing: all authors.