Phylogenetic and genome-wide mutational analysis of SARS-CoV-2 strains circulating in Nigeria: no implications for attenuated COVID-19 outcomes
Article information

Abstract
Objectives
Severe acute respiratory syndrome coronavirus 2 (SARS-CoV-2) is the causative agent of coronavirus disease 2019 (COVID-19). The COVID-19 incidence and mortality rates are low in Nigeria compared to global trends. This research mapped the evolution of SARS-CoV-2 circulating in Nigeria and globally to determine whether the Nigerian isolates are genetically distinct from strains circulating in regions of the world with a high disease burden.
Methods
Bayesian phylogenetics using BEAST 2.0, genetic similarity analyses, and genome-wide mutational analyses were used to characterize the strains of SARS-CoV-2 isolated in Nigeria.
Results
SARS-CoV-2 strains isolated in Nigeria showed multiple lineages and possible introductions from Europe and Asia. Phylogenetic clustering and sequence similarity analyses demonstrated that Nigerian isolates were not genetically distinct from strains isolated in other parts of the globe. Mutational analysis demonstrated that the D614G mutation in the spike protein, the P323L mutation in open reading frame 1b (and more specifically in NSP12), and the R203K/G204R mutation pair in the nucleocapsid protein were most prevalent in the Nigerian isolates.
Conclusion
The SARS-CoV-2 strains in Nigeria were neither phylogenetically nor genetically distinct from virus strains circulating in other countries of the world. Thus, differences in SARS-CoV-2 genomes are not a plausible explanation for the attenuated COVID-19 outcomes in Nigeria.

Introduction
Severe acute respiratory syndrome coronavirus 2 (SARS-CoV-2) is the etiological agent of coronavirus disease 2019 (COVID-19). This disease was first documented in Wuhan, Hubei Province, China in December 2019 and was later recognized as a pandemic by the World Health Organization (WHO) in March of the following year [1]. The first documentation of COVID-19 in Nigeria was on February 27, 2020, after an Italian citizen who worked in Lagos, Nigeria, returned from Milan, Italy on February 25 [2].
The COVID-19 outbreak in Sub-Saharan Africa and Nigeria has not mirrored that of the rest of the world despite realities such as poor health care systems for testing, reporting, tracing, and treating cases, lack of access to clean water, poor living conditions that make social distancing difficult, and the high burden of comorbidities and infectious diseases such as HIV [3–7]. Among African countries, Nigeria and a few others have been recognized as particular hotspots for the importation of COVID-19 from China [8,9]. Even the WHO had major concerns for Africa, estimating a death toll of up to 190,000 people [10]. However, this projection has not yet materialized, and Nigeria and most Sub-Saharan African countries have had relatively few cases of infection, morbidity, and mortality from COVID-19 according to statistical data provided by the WHO [11]. The low level of COVID-19 testing in Nigeria may partly account for this disparity. However, this study did not seek to test this hypothesis; instead, it considered another factor that may have contributed to the attenuated disease outcomes—namely, mutations. Mutations are random in nature, and disadvantageous mutations are more likely than advantageous mutations. It is worth considering whether the strains that entered Nigeria were naturally less transmissible and/or fatal than those that have circulated elsewhere in the world. A first step in examining this hypothesis is to compare the genomes of SARS-CoV-2 circulating in Nigeria with virus genomes from other parts of the world. Therefore, this study sought to characterize the identity of SARS-CoV-2 strains isolated within Nigeria by comparative phylogenetic and mutational analysis with strains obtained elsewhere in the world.
Materials and Methods
Data Acquisition and Sequence Alignment
SARS-CoV-2 genomes were obtained from the Global Initiative to Share All Influenza Data (GISAID) website (http://gisaid.com). A total of 230 sequences were collected; 100 of them were Nigerian sequences; which were randomly picked (from a total of 408 complete and high-coverage Nigerian SARS-CoV-2 genomes as of May 29, 2021), while the other 130 sequences, which included the reference Wuhan sequence (EPI_ISL_402125), were randomly picked from the rest of the world with a major focus on the 31 countries analysed in Table 1 along with Nigeria. The sequence IDs (GISAID, Pango, and Nextclade) of the 230 genomes, as well as the acknowledgement list of the sequence submitters of all 230 isolates, are shown in the supplementary data (Tables S1 and S2). Although the sequences were randomly chosen, only complete and high-coverage genomes were selected for analyses. Two sequence groups were created; the first contained only the Nigerian isolates and the reference sequence, and the other contained all isolates. The sequence groups were then aligned using MAFFT (for multiple alignment using fast Fourier transformation) [12]. After alignment, the Nigerian sequence group had a length of 29,903 nucleotides, while the second sequence group containing all local and global isolates had a length of 30,009 nucleotides.
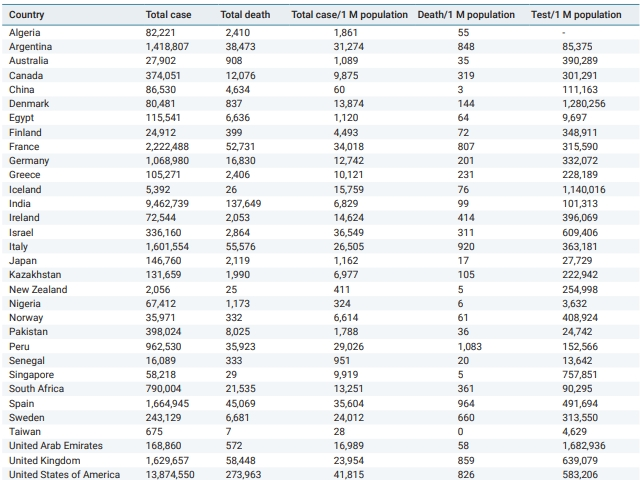
COVID-19 cases, deaths, and tests in 32 random countries as of November 30, 2020
COVID-19 statistical data, such as total cases, total deaths, total cases and deaths per 1 million population, and tests per 1 million cases for all countries and regions of the world were obtained from Worldometer’s website using the Wayback Machine to access the COVID-19 statistics from November 30, 2020 at 22:52:43 WAT (West Africa Time).
Bayesian Phylogenetics
The sequence alignments were entered into Bayesian Evolutionary Analysis Utility (BEAUti) to set up the parameters of the Bayesian analysis [13]. The tips of all taxa were dated with their corresponding collection date, the substitution model was set to general time reversible, and the gamma category count was set to 4. The strict clock model and coalescent exponential population tree prior were selected, and a monophyletic group was specified as a tree prior, excluding the Wuhan reference sequence (this was done in order to specify the Wuhan reference sequence as an outgroup). Finally, the analysis was set to run for 10 million generations. The above steps were repeated for the second sequence group (all 230 isolates); the only difference this time around was that a relaxed clock model was selected instead of the strict clock model. XML-formatted files were generated and inputted into the BEAST 2.0 program (BEAST Developers, https://www.beast2.org/), which ran Markov-chain Monte Carlo analyses using the specified parameters.
Maximum clade credibility trees were generated with the use of the package TreeAnnotator from the “trees” files that were output by the BEAST analyses. The maximum clade credibility trees were visualized using FigTree (http://tree.bio.ed.ac.uk/software/figtree/). A timescale was generated by selecting the “Reverse Axis” option in the Scale Axis panel and setting the “Offset by” option in the Time Scale panel to the collection time (in decimal dates) of the most recently collected sequence sample, which corresponded to 2021.36 (that is, May 13, 2021).
Sequence Similarity Matrices
A sequence similarity matrix for the amino acid transcripts of the Nigerian sequence group was generated using the Base-by-Base bioinformatics program [14]. The coding regions for all isolates in this group were extracted, translated, concatenated, and then realigned before their similarity was assessed. The extraction of the nucleotide-coding regions was made possible by the annotation provided by the National Center for Biotechnology Information.
Genome-Wide Mutational Analysis
After obtaining the amino acid coding sequences of all open reading frames (ORFs) within the SARS-CoV-2 genome for the Nigerian sequence group, each ORF was manually examined to note amino acid differences from the Wuhan reference sequence.
Results
The COVID-19 Epidemic Was Mild in Nigeria Compared to the Rest of the World
Table 1 shows COVID-19 cases, deaths, and test statistics in 32 countries (as of November 30, 2020). Nigeria’s cases and deaths per 1 million population were among the lowest of the 32 countries presented in Table 1. In fact, Nigeria is among the 5 countries that have the lowest cases and deaths per 1 million population alongside other countries, such as China, New Zealand, Senegal, Singapore, and Taiwan (Table 1). However, the very low COVID-19 case count in Nigeria needs to be interpreted in the context that Nigeria’s rate of COVID-19 tests per 1 million population is among the lowest in the world (Table 1).
SARS-Cov-2 Isolated from Nigeria Resolved into Multiple Clades and Lineages
The Bayesian phylogenetic analysis of the Nigerian sequence group produced a phylogenetic tree showing that the SARS-CoV-2 strains circulating in Nigeria clustered into multiple clades (Figure 1). At the time of data collection (May 29, 2021), there were 7 clades of SARS-CoV-2 circulating in Nigeria, including G (B.1), GH (B.1), GR (B.1.1), GR (L.3), GRY (B.1.1.7), V (B), and S (A), with lineage frequencies of 7%, 10%, 32%, 16%, 24%, 4%, and 7%, respectively. The Nigerian isolates belonging to the S (A) and V (B) clades are shown as ancestral as they were closer to the reference Wuhan strain, whereas the GRY (B.1.1.7) clade was the most distant from the reference strain (Figure 1).
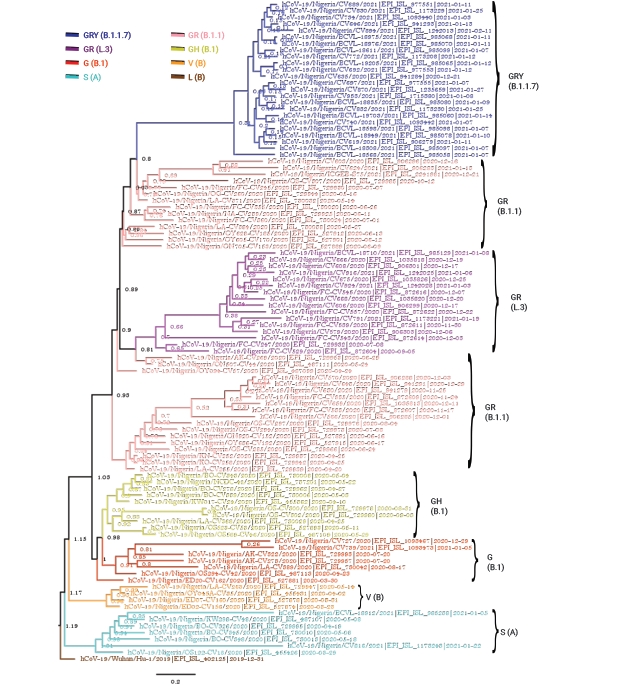
Strict clock Bayesian phylogeny of 100 full-genome severe acute respiratory syndrome coronavirus 2 Nigerian isolates plus the reference Wuhan isolate (hCoV-19/Wuhan/Hu-1/2019|EPI_ISL_402125|2019-12-31). The parameters included a general time reversible substitution model, the gamma category count set to 4, a coalescent exponential tree prior, and a custom tree prior to specify the Wuhan isolate “Wuhan/Hu-1/2019” as an outgroup. The analysis was run for 10 million generations.
Time-Scaled Maximum Clade Credibility Trees of SARS-CoV-2
One aim of the Bayesian phylogenetic analyses was to identify the strains of SARS-CoV-2 circulating in Nigeria and possible regions from which they were imported. The clustering patterns of the Nigerian strains within the broader global cluster are depicted in Figures 2 and 3. The strict and relaxed clock phylogenies produced slightly different versions of the evolutionary history of SARS-CoV-2 worldwide. Although the clustering of isolates in the clock phylogenies was mostly similar, the overall branching patterns of some clades showed variance.

Strict clock time-scaled Bayesian phylogeny of 230 full-genome severe acute respiratory syndrome coronavirus 2 global isolates, including the reference Wuhan isolate (hCoV-19/Wuhan/Hu-1/2019|EPI_ISL_402125|2019-12-31). The parameters included a general time reversible substitution model, the gamma category count set to 4, a coalescent exponential tree prior, and a custom tree prior to specify the Wuhan isolate “Wuhan/Hu-1/2019” as an outgroup. The branches of all isolates are colored according to the Global Initiative to Share All Influenza Data clade and Pango lineage they belong to. However, the taxon labels of the Nigerian isolates are left colored in the default black, while the other isolates are colored depending on their clade.
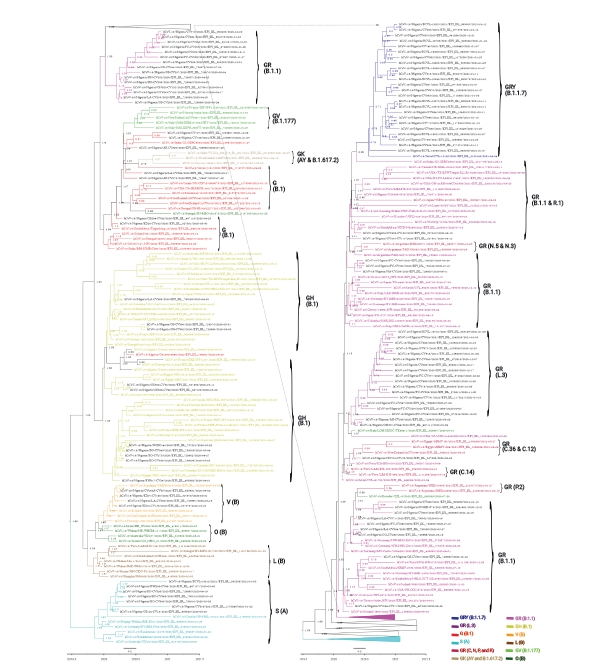
Relaxed clock time-scaled Bayesian phylogeny of 230 full-genome severe acute respiratory syndrome coronavirus 2 global isolates, including the reference Wuhan isolate (hCoV-19/Wuhan/Hu-1/2019|EPI_ISL_402125|2019-12-31). The parameters included a general time reversible substitution model, the gamma category count set to 4, a coalescent exponential tree prior, and a custom tree prior to specify the Wuhan isolate “Wuhan/Hu-1/2019” as an outgroup. The Nigerian isolates are highlighted in red. The branches of all isolates are colored according to the Global Initiative to Share All Influenza Data clade and Pango lineage they belong to. However, the taxon labels of the Nigerian isolates are left colored in the default black, while the other isolates are colored depending on their clade.
According to the strict clock Bayesian phylogenetic analyses, the Nigerian isolates of the GRY(B.1.1.7) clade clustered most closely with isolates from Israel (EPI_ISL_2182149 [B.1.17]) and India (EPI_ISL_2017759 [B.1.1]) (Figure 2). The isolates of the GR (B.1.1) clade in Nigeria were very diverse, and Figures 1–3 depict the diversity of this clade (highlighted in pink and appropriately labeled). The Bayesian phylogenetic analyses demonstrated that the GR (B.1.1) clade can be divided into at least 3 distinct sub-clades (Figure 1). As a result of this clade’s diversity, it clustered with a host of isolates from different regions all over the globe (Figures 2 and 3), including isolates from Peru (EPI_ISL_1111139 [B.1.1.348], EPI_ISL_1111445 [B.1.1]), Ecuador (EPI_ISL_660069 [B.1.1.203]), Argentina (EPI_ISL_2105573 [P.2], EPI_ISL_2135164 [P.2]), South Africa (EPI_ISL_498093 [B.1.1], EPI_ISL_2285331 [B.1.1.448]), Iceland (EPI_ISL_829280 [B.1.1.170], EPI_ISL_1586502 [B.1.1]), and Germany (EPI_ISL_572397 [B.1.1], EPI_ISL_574259 [B.1.1]) (Figure 2). GISAID analyses have previously depicted another distinct GR sub-clade other than GR (B.1.1) that has been designated with a different Pango lineage (L.3). The Nigerian isolates of this clade clustered most closely with other GR (B.1.1) isolates, probably because there were no foreign representatives of this clade. Notable examples were from Germany (EPI_ISL_732563 [B.1.1]) and Greece (EPI_ISL_451310 [B.1.1]). The Nigerian isolates belonging to the GH (B.1) clade (colored yellow) clustered notably with isolates from France (EPI_ISL_560644 [B.1], EPI_ISL_2293487 [B.1.160]), Colombia (EPI_ISL_445219 [B.1]), Norway (EPI_ISL_2226159 [B.1]), Israel (EPI_ISL_447432 [B.1]), and Egypt (EPI_ISL_2232405 [B.1.170]) (Figure 2). The Nigerian isolates of the G (B.1) clade (colored red) most closely clustered with other B.1 isolates, with noteworthy isolates from New Zealand (EPI_ISL_637094 [B.1]), India (EPI_ISL_1544153 [B.1]), and other African nations such as Senegal (EPI_ISL_1827949 [B.1], EPI_ISL_1167163 [B.1]), and South Africa (EPI_ISL_464129 [B.1.8]) (Figure 2). It is also important to note that, unlike what is clearly shown in Figure 1, the G clade more closely clustered with the GR (B.1.1) and GR (L.3) set of clades instead of the GH (B.1) clade. The Nigerian isolates within the V (B) clade clustered most closely with the other foreign isolates belonging to this clade. The V (B) clade did not have many representative isolates. Finally, the Nigerian isolates of the S (A) clade most closely clustered with the foreign representatives of this clade (Figure 2). This clade also did not have many representative isolates. There were no Nigerian isolate representatives belonging to the L (B), GR (C, N, P, and R), GV (B.1.177), GK (AY and B.1.617.2), and O (B) clades.
Another phylogenetic tree was constructed, this time using the relaxed clock model. Both trees were highly similar, except for a few differences. The GRY (B.1.1.7) clade in the relaxed-clock tree was basically identical to its counterpart in the strict-clock tree; clustering most closely with the exact same 2 sequences from India and Israel (Figures 2 and 3). As in the strict clock phylogenetic tree, the GR (B.1.1) clade was very diverse and clustered with a host of isolates from widely different global regions (Figures 2 and 3). Its common clustering patterns were also evident in the relaxed-clock tree. One major difference between the 2 clock trees is apparent in the GR (L.3) clade. While in the strict-clock tree, this clade most closely clustered with isolates EPI_ISL_732563 (B.1.1) and EPI_ISL_451310 (B.1) from Germany and Greece, respectively, the relaxed-clock tree did not show support for such close clustering patterns. Instead, the isolates of the L.3 lineage clustered most closely with 2 sequences from Italy and the United States; EPI_ISL_528947 (B.1.1) and EPI_ISL_1823584 (B.1.1.263) (Figure 3). The clustering patterns of the GH (B.1) clade were very similar for both clock trees; the same group of isolates that clustered with this clade in the strict-clock tree also closely clustered in the relaxed-clock tree (Figures 2 and 3). The G (B.1) clade here was also very similar to its counterpart in the strict-clock tree, also exhibiting a closer relationship with the GR (B.1.1 and L.3) set of clades than with the GH (B.1) clade, as suggested in Figure 1. The V (B) and S(A) clades in the relaxed-clock tree showcased a similar clustering pattern as in its strict clock counterpart (Figures 2 and 3). Finally, another major difference between the 2 clock trees was the positioning of the V (B), O (B), L (B), and S (A) clades on the trees. In the strict-clock tree, the V (B) and O (B) pair is shown to be more ancestral to the L (B) and S (A) pair (barring the Wuhan reference sequence), while in the relaxed-clock tree, the S (A) clade was depicted as being more ancestral to the other 3 clades, which formed a cluster (Figures 2 and 3).
Sequence Similarity Matrix of Isolates Correlated with Phylogenetic Grouping
As a means of evaluating the similarity of Nigerian isolates to one another and to the reference, a sequence similarity matrix is shown in Table 2. Isolates are represented by their GISAID accession identification/GISAID clade/Pango lineage. All isolates were highly similar, showing a similarity score of no less than 99.5% (Table 2). On average, isolates within the same clade were more similar than those of different clades. For example, the average sequence similarity value of isolates within a clade was 99.93%, while the average sequence similarity value of all isolates across different clades was only 99.84%. However, this was not always the case. As shown in Table 2, the S (A) clade was an exception to this rule. The intra-clade similarity score was only 99.76%, while the average inter-clade similarity score between the S clade and all other clades was 99.78% (Table 2).
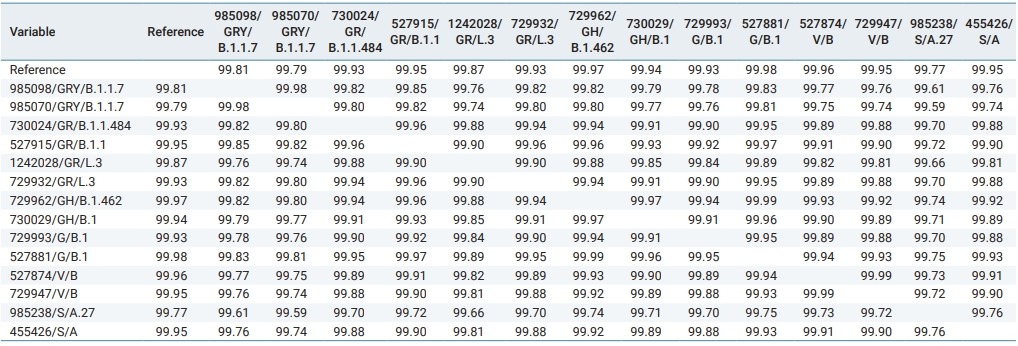
Sequence similarity matrix of Nigerian isolates: 2 clade representatives are selected for each clade
D614G Was a Predominant Mutation in the S Gene of Nigerian Isolates, and Other SNPs and Deletions Occurred in Other Parts of the Genome
The D614G mutation in the spike (S) protein has received intense attention because of its association with increased infectivity. To check for the prevalence of this mutation in the available Nigerian isolates, position 614 of the S protein in respect to the reference Wuhan sequence was examined. This examination revealed that the D614G mutation existed in numerous Nigerian isolates (Table 3). A majority of the Nigerian isolates were G variants, only 10 isolates were D variants, and the isolate EPI_ISL_1173243 had an “N” amino acid at locus 614 of the S gene.
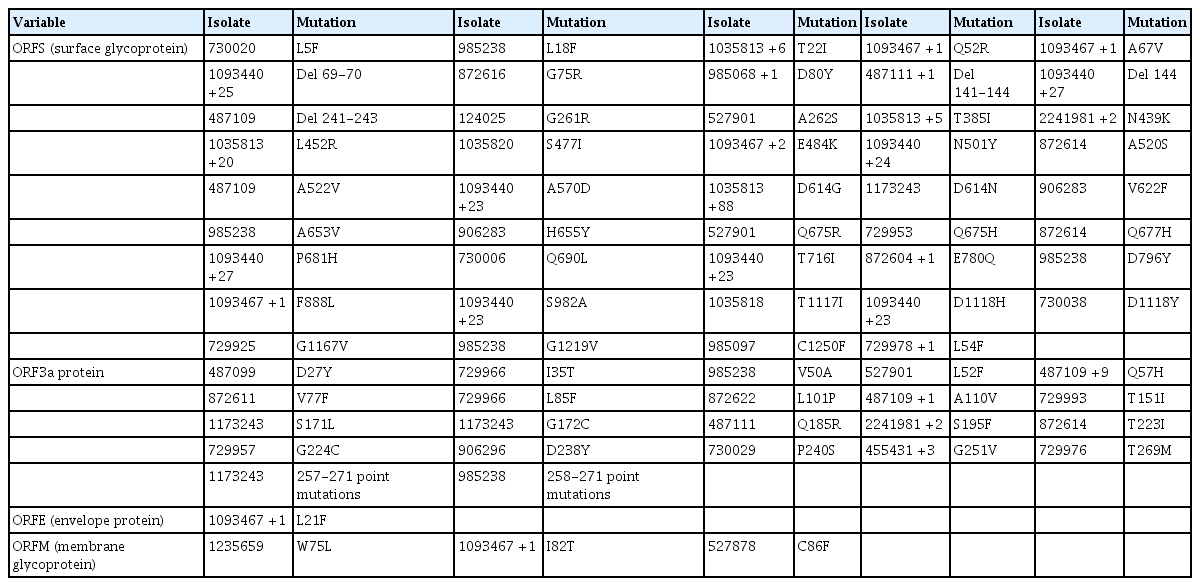
Mutational profile of ORFS, ORF3a, ORF4, and ORF5 showing single-nucleotide polymorphisms and deletions
Tables 3–5 depict all single-nucleotide polymorphisms (SNPs) and deletions in all genes of the Nigerian isolates in comparison to the Wuhan reference sequence. Each isolate is represented by its GISAID accession identification number (Tables 3–5). Apart from the nucleotide substitutions observed at the 614th position of the spike gene, many other mutations occurred throughout the SARS-CoV-2 genome, most of which were SNPs. A few indels and run-on mutations were also noted. Twenty-nine amino acid mutations were present in over 10% of all Nigerian isolates. Out of these 29 mutations, 4 were present in over 70% of Nigerian isolates. These 4 were P323L in NSP12 (87.0%) (RNA-dependent RNA polymerase) of ORF1ab, D614G (88.0%) in the spike protein, and R203K (72.0%) and G204R (72.0%) in the nucleocapsid protein (ORFN).
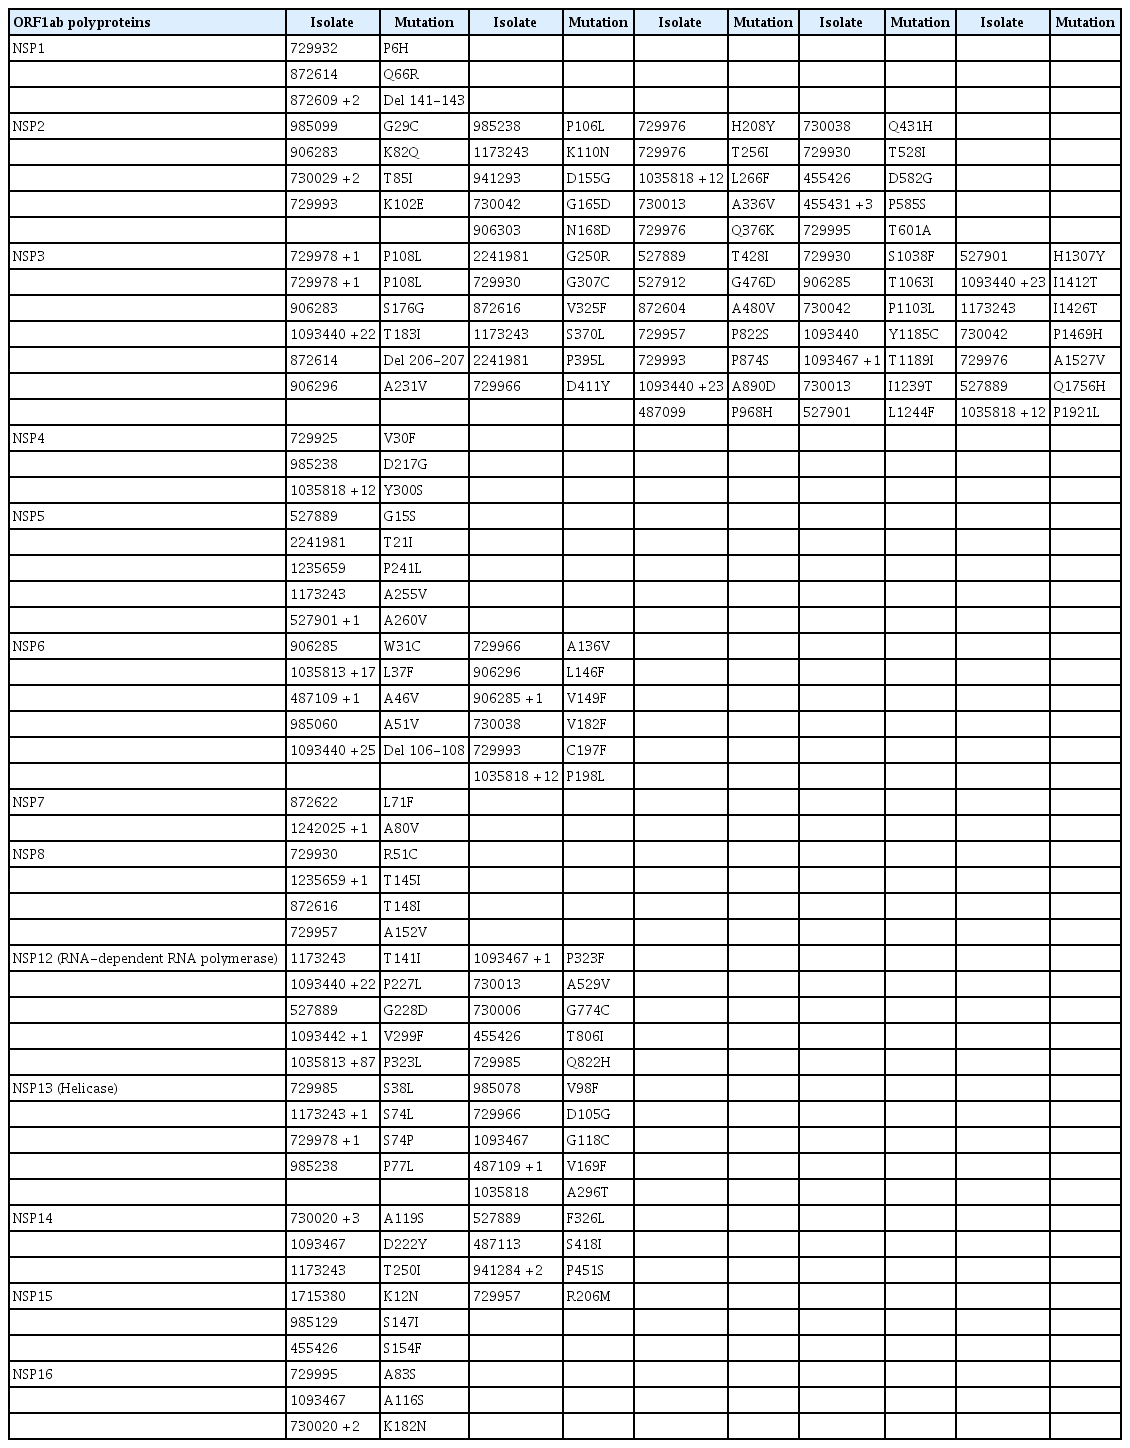
Mutational profile of ORF1ab and all its constituent non-structural proteins showing single-nucleotide polymorphisms and deletions
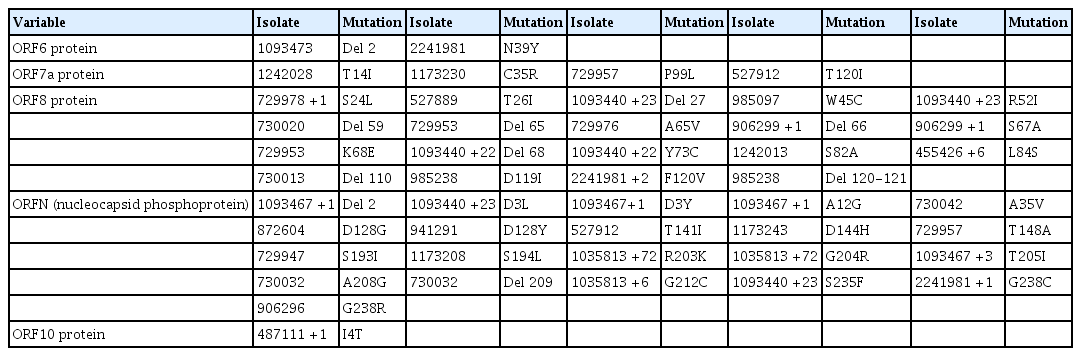
Mutational profile of ORF6, ORF7a, ORF8, ORF9, and ORF10 showing single-nucleotide polymorphisms and deletions
Discussion
The observation of a mild COVID-19 epidemic in Nigeria from the onset of the epidemic through November 30, 2020 is indeed unexpected, as the Nigerian numbers best those of some countries that are believed to have handled the pandemic better [15–17]. Several hypotheses have been suggested to suggest this, primarily centering on the early action taken by Africa against the infection, likely fueled by African countries’ familiarity with emerging infectious diseases, a warmer climate, a reduced genetic predisposition to the disease as a result of the reduced expression of ACE2 (the receptor implicated SARS-CoV-2 infectivity) in Africans, and a relatively young population [3,4,9,18–22]. Nonetheless, it should also be noted that only 3,632 tests were recorded per 1 million Nigerians, the lowest among the 32 countries shown in Table 1. As a result, the supposed mild COVID-19 epidemic in Nigeria is clouded by the fact that COVID-19 testing in that time period was very underwhelming. The proportion of COVID-19 tests per population should be considered as an important factor when interpreting the response of the country to the pandemic.
One aim of the Bayesian phylogenetic analyses in the present study was to identify the strains of SARS-CoV-2 circulating in Nigeria and possible regions from which they were imported. Bayesian trees with both strict and relaxed clock phylogenies showed that the individual SARS-CoV-2 clades in Nigeria clustered with and likely originated from various countries around the world. Some clades were likely imported from Asia, while others were likely imported from various countries in Europe and South America. The importation of SARS-CoV-2 from China into Nigeria is a very feasible occurrence considering air traffic flow patterns and bilateral trade agreements between the 2 nations [23–27]. The importation of COVID-19 from Europe is also as likely; in fact, Nigeria’s index case was a man from Italy who traveled to Nigeria [2]. Other evidence supporting the importation of SARS-CoV-2 from Europe has been highlighted by 2 independent studies [28,29]. Therefore, with the observation that Nigerian isolates of SARS-CoV-2 were likely imported from Asia and Europe, the assumption that the strains circulating within Nigeria are different from strains circulating globally does not hold. This, in turn, does not explain the low transmissibility and fatality of the strains within Nigeria, especially considering the fact that most of the regions they are believed to have been imported from did not have attenuated disease outcomes, as highlighted in Table 1.
The sequence similarity analyses suggested that there was not much divergence between Nigerian isolates from the reference sequence (and from all SARS-CoV-2 isolates in general); therefore, the virus genome alone may not be a sufficient variable to explain the milder outcomes of COVID-19 in Nigeria. Other factors such as early action taken against COVID-19, a warmer climate, reduced genetic predisposition to the disease as a result of a reduced expression of ACE2, and a relatively young population may singly or in combination account for the attenuated disease outcomes in Nigeria. The sequence similarity matrix of Nigerian isolates corresponded to the phylogenetic groupings of clades; isolates within the same phylogenetic clade tended to have more similar sequences than isolates from different clades. This observation is significant because it further supports the result obtained via Bayesian phylogenetic inference.
The mutational analysis demonstrated that there were only very few non-synonymous substitutions in the genomes of Nigerian isolates compared to the reference Wuhan strain. Most non-synonymous mutations were present in 1 or a few isolates, although a few existed in numerous isolates. The D614G, P323L, R203K, and G204R mutations occurred in numerous Nigerian isolates. This same set of mutations was also discovered to be predominant in a SARS-CoV-2 epidemiological study conducted in Morocco [30].
There was an 88% prevalence of the D614G mutation in Nigerian isolates, and most of the D614G variants belonged to the S (A) clade of SARS-CoV-2, most likely because this clade is believed to be ancestral. Although this mutation is believed to be a relatively new mutation absent in the ancestral lineage, it has gained traction and is currently a dominant mutation in the population of SARS-CoV-2 worldwide, including in Nigeria and Africa [28,31,32]. Although there is a possibility that the G614 variant is evolutionarily favored over the D variant, there is no evidence of impact on disease severity and on therapeutic development [31,33–35]. The G variant, however, has been associated with increased transmission fitness, viral loads, and younger patient age [36,37].
The P323L mutation was also another predominant mutation in the Nigerian isolates studied, with a prevalence of 87%. This mutation has been highlighted in the literature, and it was touted as an important variant in a large-scale study [38]. The P323L mutation may cause structural changes in NSP12, altering its interaction with NSP8 and affecting viral replication in host cells [39,40].
The R203K and G204R mutations were both present in ORFN, the nucleocapsid protein. These mutations have previously been identified in other studies [32,39,41]. Research on this mutation pair has shown that viruses possessing these mutations gain a replication advantage over the R203 and G204 variants [42]. This mutation pair has shown increased infectivity in the lung cells of humans and in hamsters [42]. In a study that modeled and analysed mutant protein structures, R203K and G204R were identified as mutations that caused significant changes to protein structure; moreover, this mutation pair also affected the affinity of intra-viral protein interactions [43].
Overall, we have shown that the SARS-CoV-2 strains circulating in Nigeria as of May 29, 2021 clustered into 7 different clades and were introduced into the country through multiple and unrelated introductions from Asia, Europe, South America, and Africa. The Nigerian SARS-CoV-2 isolates were also not genetically and phylogenetically distinct from strains circulating in other parts of the world. Future work will aim to associate the identified mutations with phenotypic characteristics through functional analysis.
Supplementary Material
Table S1. Sequence IDs, GISAID clades, Pango and Nextclade lineages of SARS-CoV-2 isolates used in the study; Table S2. Acknowledgement list of sequence submitters. Supplementary data are available at https://doi.org/10.24171/j.phrp.2021.0329.
Sequence IDs, GISAID clades, Pango and Nextclade lineages of SARS-CoV-2 isolates used in the study
Acknowledgement list of sequence submitters
Notes
Ethics Approval
Not applicable.
Conflicts of Interest
The authors have no conflicts of interest to declare.
Funding
None.
Availability of Data
Data are available on request to the corresponding author.