Health Related Nutritional Knowledge and Dietary Behavior Regarding Caffeine Intake among High School Students in Yongin Region
Article information
Abstract
Objectives
We aimed to examine health-related nutritional knowledge and dietary behavior related to caffeine intake among high school students (n = 310) in the Yongin region of Korea.
Methods
Data were collected using a face-to-face survey, and analyzed using chi-square test, t- test, and logistic regression analysis.
Results
The level of caffeine intake in respondents was divided into low (< 30 mg/d; n = 208) and high caffeine intake groups (> 30 mg/d; n = 102). Total nutritional knowledge related to bone disease was higher in the low intake group (score 2.75) than the high intake group (score 2.39; p < 0.05). The high intake group had lower scores for nutritional knowledge (score 0.70; p < 0.05) related to how caffeinated beverages affect sleep and for dietary behavior (score 3.25; p < 0.001), based on “I avoid caffeinated foods before sleep,” than the low intake group (nutritional knowledge score, 0.80; dietary behavior score, 3.76).
Conclusion
In the overall analysis, the low caffeine intake group had better nutritional knowledge related to bone and sleep health, and healthier dietary behavior related to sleep health compared with the high intake group.
Introduction
Caffeine (1,3,7-trimethylxanthine) is probably the most frequently consumed psychoactive substance in the world, that is legally acceptable for consumption by adolescents [1]. It is found in coffee beans (Coffea Arabica and Coffea robusta), kola nuts (Cola acuminata), tea leaves (Camellia sinensis), cocoa beans (Theobroma cacao), and other plants [2].
Caffeine has been shown to be associated with both beneficial and harmful health effects. Scientific and epidemiological evidence have shown that amongst the healthy adult population, moderate caffeine consumption (400 mg) per day is not associated with adverse health effects such as general toxicity, cardiovascular effects, increased incidence of cancer, or effects on bone status [3,4]. However, most of this information has been based on adult populations. Little is known about the adverse effects of caffeine consumption among adolescents [5]. The amount of caffeine required to produce adverse effects varies from person to person, depending on gender, age, weight, and differences in susceptibility [6]. Therefore, there is a debate over whether caffeine consumption is beneficial or deleterious to human health [7].
There is growing concern about the increased consumption of caffeinated foods and drinks, including coffee, energy drinks, tea, and chocolate products, particularly among adolescents [8,9]. The principle sources of caffeine intake among adolescents are sweetened coffee and energy drinks, amounting to a daily caffeine intake below the current suggested maximum acceptable levels for adolescents (2.5 mg/kg body weight/d or 100–175 mg/d with body weight 40–70 kg) [10]. However, excessive caffeine intake by adolescents has been associated with a number of detrimental health effects, such as nervousness, irritability, nausea, cardiovascular symptoms, sleep impairment, osteoporosis, and gastric ulcers [5,11]. Excessive use of energy drinks has been linked to deaths in the United States and Canada [12,13]. The level of caffeine intake varies depending on the predominant types of beverages consumed and the specific population groups [14]. Nawrot et al [15] reported that caffeine intake was related to various human health effects such as acute toxicity, cardiovascular disease, poor dietary behavior, bone density and calcium deficiency, and developmental and reproductive problems. Dietary habits, including caffeine intake, are established in childhood and tend to continue into adulthood. The risk of many noncommunicable diseases is very closely connected to dietary habits [16]. However, adequate knowledge and understanding of nutritional intake and dietary recommendations can help adolescents to achieve a healthy status [17]. Grosso et al [18] observed that improving nutritional knowledge in children and young adolescents may lead them to adopt healthier dietary habits. Caffeine consumption is a dietary habit that has physiological, behavioral, and subjective effects. Despite its widespread consumption, few studies have described the impact of caffeine on health in children and adolescents.
In this study, we hypothesized that higher caffeine intake is associated with limited nutritional knowledge and unhealthy dietary behavior among Korean high school students. The purpose of this study was: (i) to investigate daily caffeine intake among high school students, (ii) to determine health-related nutritional knowledge and dietary behavior related to caffeine intake, and (iii) to identify the factors associated with caffeine intake.
Materials and Methods
1. Research design and participants
This cross-sectional, analytical study was designed to explore the relationship between nutritional knowledge, dietary behavior, and health according to caffeine intake level among high school students in the Yongin region of Gyeonggi Province, Korea. This study was approved by the Institutional Review Board of Jeonju University (jjIRB-160816-HR-2016–0807).
If students were willing to participate in the study, we briefly explained the study design and purpose prior to the start of the study. Participants included a total 310 adolescents: 171 (55.2%) boys and 139 (44.8%) girls. The data were collected using face-to-face interviews and participants also completed a self-report survey questionnaire. This survey comprised 4 sections, including questions on demographics, caffeine intake level, nutritional knowledge, and dietary behavior.
2. Caffeine intake level
Daily mean caffeine intake was classified according to 8 general categories: coffee (e.g., liquid coffee, instant coffee mix, and Americano-style coffee from a coffee shop), teas (e.g., green tea and black tea), carbonated soft drinks (e.g., Coca-Cola, Pepsi, and Mountain Dew), energy drinks (Hot Six and Red Bull), processed milk (e.g., coffee-flavored milk, chocolate milk), chocolate (e.g., milk chocolate), sweets (e.g., chocolate chip cookie and chocolate candy bar), and ice creams containing chocolate and green tea. A few other beverages containing caffeine, including fruit juices, flavored water, and sports drinks, were included in the energy drink category because the number of identified consumers was too low to justify a separate category [3]. The 8 major categories of caffeinated foods consumed by adolescents were generated using the caffeine database of the Korea Food and Drug Administration (KFDA) [19,20]. To determine daily mean caffeine intake, participants were asked how many of these foods or beverages they consumed on an average day or week, regardless of weekdays and weekends. These caffeinated foods or beverages were evaluated using standard serving sizes and average caffeine values were obtained using data of the KFDA [19,20] as most food and nutrient databases have limited brand specificity, particularly for coffee and tea. Therefore, daily mean caffeine intake was calculated using the average caffeine content from the KFDA databases [19,20], in mg/d.
3. Nutritional knowledge
To determine the relationship between caffeine intake level and nutritional knowledge, the questionnaire used for this study was developed by revising and adding to those used in previous studies [16–18,21–23]. The present questionnaire consisted of 24 questions, including 5 categories addressing caffeine intake, as follows: general information, 8 questions; bone disease, 4 questions; cardiovascular disease, 4 questions; sleep disorders, 4 questions; and stomach disorders, 4 questions. Nutritional knowledge was assessed according to the 5 categories and the results were scored (a correct answer received 1 point and an incorrect answer received 0 points) before the analysis. The level of total nutritional knowledge, according to points scored, was divided into groups with low (score < 14 points), medium (score 15–19 points), and high (score > 19 points) levels.
4. Dietary behavior
To determine the relationship between caffeine intake level and dietary behavior, the questionnaire used for this study was developed by revising and adding to those of previous studies [16–18,22,23]. The present questionnaire consisted of 22 questions, including 5 categories addressing caffeine intake, as follows: general information, 6 questions; bone disease, 4 questions; cardiovascular disease, 4 questions; sleep disorders, 4 questions; and stomach disorders, 4 questions. Dietary behavior was assessed using a 5-point scale (strongly disagree, 1 point; disagree, 2 points; neutral, 3 points; agree, 4 points; completely agree, 5 points) before analyzing the scores. The level of total dietary behavior, according to points scored, was divided into 3 groups: low (score < 66 points), medium (score 66–88 points), and high (score > 88 points) levels.
5. Demographic characteristics
Using the survey, we collected demographic data of respondents including gender, grade level, height, and body weight, used to calculate body mass index (BMI).
6. Statistical analysis
Daily caffeine intake values were computed using the caffeinated foods survey data, to calculate the caffeine intake per respondent per day. Classification by caffeine intake level (into a group with low caffeine intake group or another group with high caffeine intake) was based on each adolescent’s average caffeine intake, according to the KFDA (age 14–19 years, approximately 30 mg/d) [19,20]. Demographics by caffeine intake level were expressed as frequencies and percentages. A chi-square test was performed to compare the described variables. The differences in nutritional knowledge and dietary behavior related to diseases and disorders caused by caffeine intake were expressed as mean ± SD and examined using an independent t-test. Logistic regression analysis was also used to examine the factors that affect caffeine intake. The level of significance was set at p < 0.05. All data were analyzed using IBM SPSS version 21.0 (IBM Corp., Armonk, NY, USA).
Results
1. Demographic characteristics and caffeine intake levels
The demographic characteristics of participants by caffeine intake level are presented in Table 1. Participants were divided into a low caffeine intake group (< 30 mg/d; n = 208) and a high caffeine intake group (> 30 mg/d; n = 102). There were 97 male (46.6%) and 111 female (53.4%) respondents in the low intake group. The high intake group comprised of 74 male (72.5%) and 28 female (27.5%) participants (p < 0.001). There were no significant differences in the number of low and high caffeine intake participants according to school grade year or BMI (p > 0.05).
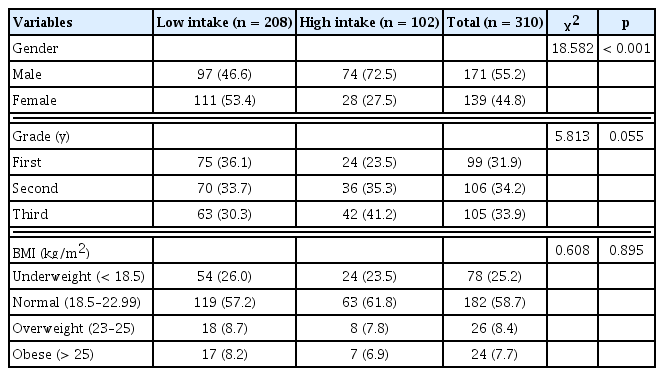
Demographic characteristics of respondents, by caffeine intake level.
2. Nutritional knowledge and dietary behavior
General nutritional knowledge and dietary behavior by caffeine intake level are presented in Table 2. Total general nutritional knowledge scores were higher in the low caffeine intake group (score 6.45) than the high intake group (score 6.00), but with no significant difference (p > 0.05). However, participants in the low caffeine intake group had higher scores (0.87 and 0.85) for the items “Instant foods are healthy” (p < 0.05) and “Hamburgers, pizza, and chicken are excellent sources of vitamins and minerals,” respectively (p < 0.05), compared with the high caffeine intake group (both scores 0.75).

General nutritional knowledge and dietary behavior, by caffeine intake level.
The bone disease-related total nutritional knowledge score was higher in the low caffeine intake group (score 2.75) than in the high intake group (score 2.39; p < 0.05), as shown in Table 3. In particular, the low caffeine intake group had higher scores (0.84) for the item “Carbonated beverages are harmful to bone health” compared with the high intake group (score 0.67; p < 0.01). Bone disease-related dietary behavior showed the lowest value for the item “I frequently eat anchovies and dried white fish,” regardless of caffeine intake level (low intake group, score 2.78; high intake group, score 2.88).

Bone disease-related nutritional knowledge and dietary behavior, by caffeine intake level.
Total nutritional knowledge and dietary behavior related to cardiovascular disease showed no significant differences between the 2 groups (p > 0.05; Table 4). However, for the nutritional knowledge item “Dietary fiber and low-salt foods are good for hypertension,” the low caffeine intake group had higher scores (0.80) than the high intake group (score 0.68; p < 0.05). With respect to cardiovascular disease-related nutritional knowledge, both groups had extremely low scores (low intake group, score 0.02; high intake group, score 0.07) for the item “Obese people are susceptible to hypertension and cardiovascular disease.” Among dietary behavior related to cardiovascular disease, the item “I eat foods that are as bland as possible” had the lowest scores in both groups (low caffeine intake group, 2.82; high caffeine intake group, 2.77).
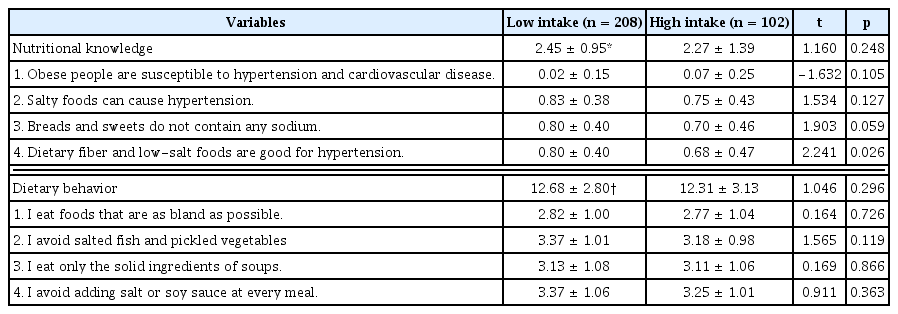
Cardiovascular disease-related nutritional knowledge and dietary behavior, by caffeine intake level.
The results of sleep disorder-related nutritional knowledge and dietary behavior by caffeine intake level are presented in Table 5. Nutritional knowledge related to sleep disorders for the item “Caffeinated foods (coffee, Coke, and so on) prevent deep sleep” was higher in the low caffeine intake group (score 0.80) compared with the high intake group (score 0.70; p < 0.05). Regarding dietary behavior related to sleep disorders, the item “I avoid caffeinated foods before sleep” was also higher in the low caffeine intake group (score 3.76) than in the high intake group (score 3.25; p < 0.001).
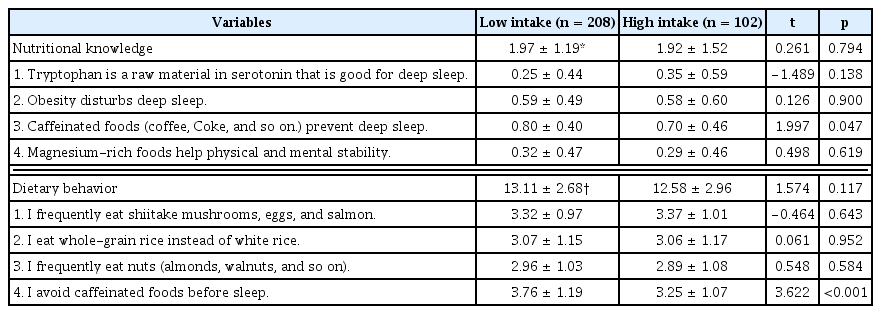
Sleep disorder-related nutritional knowledge and dietary behavior, by caffeine intake level.
Stomach disorder-related nutritional knowledge and dietary behavior by caffeine intake level are presented in Table 6. Total nutritional knowledge showed no significant differences between the low (score 2.07) and high caffeine intake (score 1.89) groups. The item “Vitamin A is essential for cell reproduction in the stomach” had the lowest scores (all 0.41) in both groups. Among stomach disorder-related dietary behavior, the item “I avoid hot-temperature foods” was higher in the high intake group (score 3.23) than in the low intake group (score 2.84; p < 0.01).

Stomach disorder-related nutritional knowledge and dietary behavior, by caffeine intake level.
3. Factors associated with caffeine intake
Logistic regression analysis was performed to examine the association of the general respondent characteristics and their health-related nutritional knowledge and dietary behavior on caffeine intake level (Table 7). With the significance level at 0.001, respondent’s gender was associated with caffeine intake. This study found that male participants had a 3.024 times greater caffeine intake than female participants. With the significance level at 0.05, first-year high school students consumed 0.480 times less caffeine than third-year students. Association of nutritional knowledge and dietary behavior on caffeine intake showed no significant differences at the 0.05 level.

Association of caffeine intake, general characteristics, nutritional knowledge, and dietary behavior.
Discussion
Over the past decade, adolescents have become the fastest-growing population of caffeine users [9]. Recent studies have revealed that 83.2% of adolescents regularly consume caffeinated beverages and at least 96% consume them occasionally [10,23]. The scientific literature has focused on finding the association between nutritional knowledge and food consumption [24]. Some researchers have observed that high nutritional knowledge had a positive impact on nutritional behavior and food consumption, including consumption of fruit and vegetables in adolescents. Studies have demonstrated that dietary behavior is correlated with the degree of nutritional knowledge [25]. In the present study, general nutritional knowledge scores related to prepared foods and health (“Instant foods are healthy” and “Hamburgers, pizza, and chicken are excellent sources of vitamins and minerals”) were higher among participants with low caffeine intake (scores 0.87 and 0.85, respectively) than those with high intakes of caffeine (both scores 0.75; p < 0.05). However, for general dietary behavior, there were no significant differences between the low and high intake groups for all items.
Some researchers have suggested the reductionist approach to be a form of simplification, to facilitate the understanding of complex diet-disease relationships [26]. Potential risks with long-term caffeine overuse include sleep disturbance, hypertension, osteoporosis, physiological dependence, and exacerbation of underlying psychiatric diseases [5,11,27]. Even with moderate caffeine consumption, adverse effects such as anxiety, tremor, restlessness, insomnia, gastrointestinal discomfort, decreased attentiveness, and psychosis can occur [28]. Children and adolescents are presumed to be particularly susceptible to the effects of caffeine [29]. Hallstrom et al [30] reported that post-menopausal women consuming self-reported caffeine > 300 mg a day from coffee may increase risk of fracture, when calcium intake is also low. Kabagambe et al [31] reported that caffeine consumption of 303–454 or > 454 mg a day was significantly associated with nonfatal myocardial infarction. James et al [32] examined the correlation between adolescent habitual caffeine consumption and hemodynamic reactivity during rest, psychosocial stress, and recovery. Caffeine consumption levels were divided into 3 groups (low, 9 mg/d; medium, 80 mg/d; high, 258 mg/d). The results demonstrated that higher caffeine consumption was associated with modestly increased vascular resistance during rest, stress, and recovery from stress. In particular, high caffeine consumers had significantly increased total peripheral resistance compared to low caffeine consumers. Persistently increased vascular resistance generally induces elevated blood pressure, hypertension and poor long-term cardiovascular health [33]. Arthur et al [34] reported that increasing intake of caffeine and/or caffeinated coffee may be associated with increased risk of breast cancer among normal weight and premenopausal women.
Carbonated beverage consumption may have adverse effects on bone mineral density (BMD). This behavior has been shown to be related to low BMD and fractures in adolescent girls [35,36]. Caffeine is an ingredient in most colas and it has been identified as a risk factor for osteoporosis [37,38]. Moreover, carbonated beverages, including colas contain excessive phosphoric acid, which has been observed to interfere with calcium absorption and contribute to imbalances that lead to additional loss of calcium [39]. In this study, total nutritional knowledge scores related to bone disease were lower in participants with high caffeine intake (score 2.39) than in those with low intake (score 2.75; p < 0.05). Moreover, the high caffeine intake group had lower nutritional knowledge (score 0.67) for the item “Carbonated beverages are harmful to bone health” compared with the low intake group (score 0.84; p < 0.01).
More than a quarter of the human population now has hypertension, paralleling a marked increase in the dietary intake of salt during the past several decades. Some researchers have reported that high salt intake is linked to hypertension and that reducing dietary intake of salt could help to reduce the number of deaths from cardiovascular disease and stroke [40,41]. Furthermore, there is clinical research available on the possible association between caffeine intake and risk of hypertension. Caffeine intake has been shown to acutely increase blood pressure [42]. Some studies have shown that caffeine can raise plasma levels of several stress hormones, such as norepinephrine, epinephrine, and cortisol, all of which may lead to increased blood pressure [43,44]. In a previous study in adolescents, increasing caffeine dose was associated with decreasing heart rate and increasing diastolic blood pressure [23]. The high caffeine intake group in this study had lower scores (0.68) than their low intake counterparts (0.80) for nutritional knowledge related to salt and hypertension, based on the item “Dietary fiber and low-salt foods are good for hypertension” (p < 0.05). Therefore, participants who consumed high levels of caffeine together with eating highly salted foods could have a much greater prevalence of hypertension than participants with low caffeine intake. In particular, people with high blood pressure or heart arrhythmia should limit their intake of caffeine [45].
Lee et al [46] reported that the correlations between sleep quality and the quantity of caffeine intake were statistically significant. The result of multiple regression analysis showed that sleep quality decreased significantly as the amount of caffeine intake increased. Adolescent caffeine consumers were divided into low dose (< 50 mg/d) and high dose (> 50 mg/d) groups by Temple et al [23]. The results showed that adolescent consumers of high caffeine levels reported using caffeine to stay awake by drinking coffee, tea, soda, and energy drinks, which was more than consumers of less caffeine. The more caffeine that is consumed by young people, the less sleep they get, which may eventually lead to other health problems [23,29]. Because of its ability to block central adenosine receptors, caffeine increases alertness. When ingested in sufficient doses shortly before bedtime, it can reduce the time spent sleeping [47,48]. In this study, sleep disorder-related nutritional knowledge was better in the low caffeine intake group (score 0.80) than the high intake group (score 0.70; p < 0.05) for the item “Caffeinated foods (coffee, Coke, and so on) prevent deep sleep.” For dietary behavior related to sleep disorders, the item “I avoid caffeinated foods before sleep” yielded higher scores among participants in the low intake group (score 3.76) than those in the high intake group (score 3.25; p < 0.001). Although respondents with high intake consumed more caffeine daily than those with low intake, they showed significantly lower nutritional knowledge related to caffeine and deep sleep (p < 0.05) than their counterparts who consumed less caffeine.
Among demographic characteristics, it was revealed that gender and school grade year were associated with caffeine intake. Male adolescents consumed 3.041 times more caffeine than females (p < 0.001) and students in their first year of high school consumed 0.469 times less caffeine than those in their third year. Temple et al [23] demonstrated that boys were more likely than girls to report getting a rush, more energy, or improved athletic performance due to caffeine. These authors found that caffeine consumption was positively associated with energy intake, specifically from low-fat, high-sugar foods, and was also positively associated with protein and fat consumption. These data suggest that caffeine consumption has a broad spectrum of effects in adolescents and that the degree of these effects is moderated by gender and chronic caffeine intake. Grosso et al [18] observed that BMI was associated with unhealthy dietary behavior (positive correlation with snacks, sweets, fried foods, and sweetened drinks; negative correlation with fruit and vegetables) and lifestyle pattern (such as frequent snacking, skipping breakfast, and infrequent physical activity) among demographic characteristics; however, BMI was not correlated with caffeine intake in that study.
The present study has several limitations that need to be addressed. Firstly, this was a sample of students in Kyeonggi Province. Therefore, it is not known whether these results are representative of the general Korean population. Secondly, as in all survey research there is the potential for recall bias, i.e., under- or overreporting consumption of caffeinated foods. In this survey, the pattern of caffeinated food consumption reflects an “average” day, regardless of whether a weekday or weekend day. Thirdly, all possible sources of caffeine (e.g., fruit juice, caffeinated flavored water) were not considered in this survey. However, a previous survey found that the contribution of these sources to total daily caffeine intake is usually less than 5%–10% [3]. Altogether, the daily mean caffeine intake in the current sample should be interpreted with caution as (a) this is not a nationally representative sample, (b) caffeine consumption on an “average” day was assessed, and (c) all possible sources of caffeine were not considered. Lastly, as the information on both nutritional knowledge and dietary behavior were self-reported, there is a possibility for respondents to answer questions in a manner that will be viewed favorably by others (social acceptability bias); this can bias the interpretation of trends as well as individual differences.
Despite these limitations, the data clearly describe the daily mean caffeine intake according to caffeinated food groups, and allow for classification of adolescents according to low and high caffeine intake. In the present study, we found differences in nutritional knowledge and dietary behavior according to caffeine intake level among high school students living in the Yongin region of Korea. These findings suggest that compared with people who have a lower intake of caffeine, those with higher caffeine intake generally have lower levels of health-related nutritional knowledge, including general health information and information about bone disease, cardiovascular disease, and sleep disorders. Participants with lower caffeine consumption had healthier dietary behaviors related to sleep and stomach disorders compared with their counterparts who consumed more caffeine. Demographic factors were also found to be independent determinants of such outcomes, with male participants consuming about 3 times more caffeine than female respondents, and younger high school students consuming about half the levels of caffeine as older students.
Adolescence is the period when considerable change in food behavior is most likely to occur, which can influence adult morbidity and mortality [49]. These assumptions have been confirmed by several studies of intervention programs aimed at increasing nutritional knowledge among children and adolescents, which have demonstrated an association between increased knowledge and more healthy food consumption or lifestyle habits [50,51]. Therefore, nutritional education should be targeted toward children and adolescents in particular, which could have a role in the prevention of many diet-related diseases, including those related to caffeine consumption [16]. There is a need for further exploration of the role of factors such as personality, physical activity, smoking, alcohol use, and stress in modifying the effect of coffee consumption on lifestyle diseases such as insomnia, gastrointestinal disorders, hypertensive heart disease, and osteoporosis.
Notes
Conflicts of Interest
The author has no conflicts of interest to declare.