
Articles
- Page Path
- HOME > Osong Public Health Res Perspect > Volume 10(2); 2019 > Article
-
Original Article
Nutritional Status of Indonesian Children in Low-Income Households with Fathers that Smoke - Maria Wijaya-Erhardt
-
Osong Public Health and Research Perspectives 2019;10(2):64-71.
DOI: https://doi.org/10.24171/j.phrp.2019.10.2.04
Published online: April 30, 2019
VitMin Lab, Kastanienweg, Willstaett, Germany
- *Corresponding author: Maria Wijaya-Erhardt, VitMin Lab, Kastanienweg 5, 77731 Willstaett, Germany, E-mail: mwijaya70@gmail.com
• Received: July 3, 2018 • Revised: February 28, 2019 • Accepted: March 7, 2019
Copyright ©2019, Korea Centers for Disease Control and Prevention
This is an open access article under the CC BY-NC-ND license (http://creativecommons.org/licenses/by-nc-nd/4.0/).
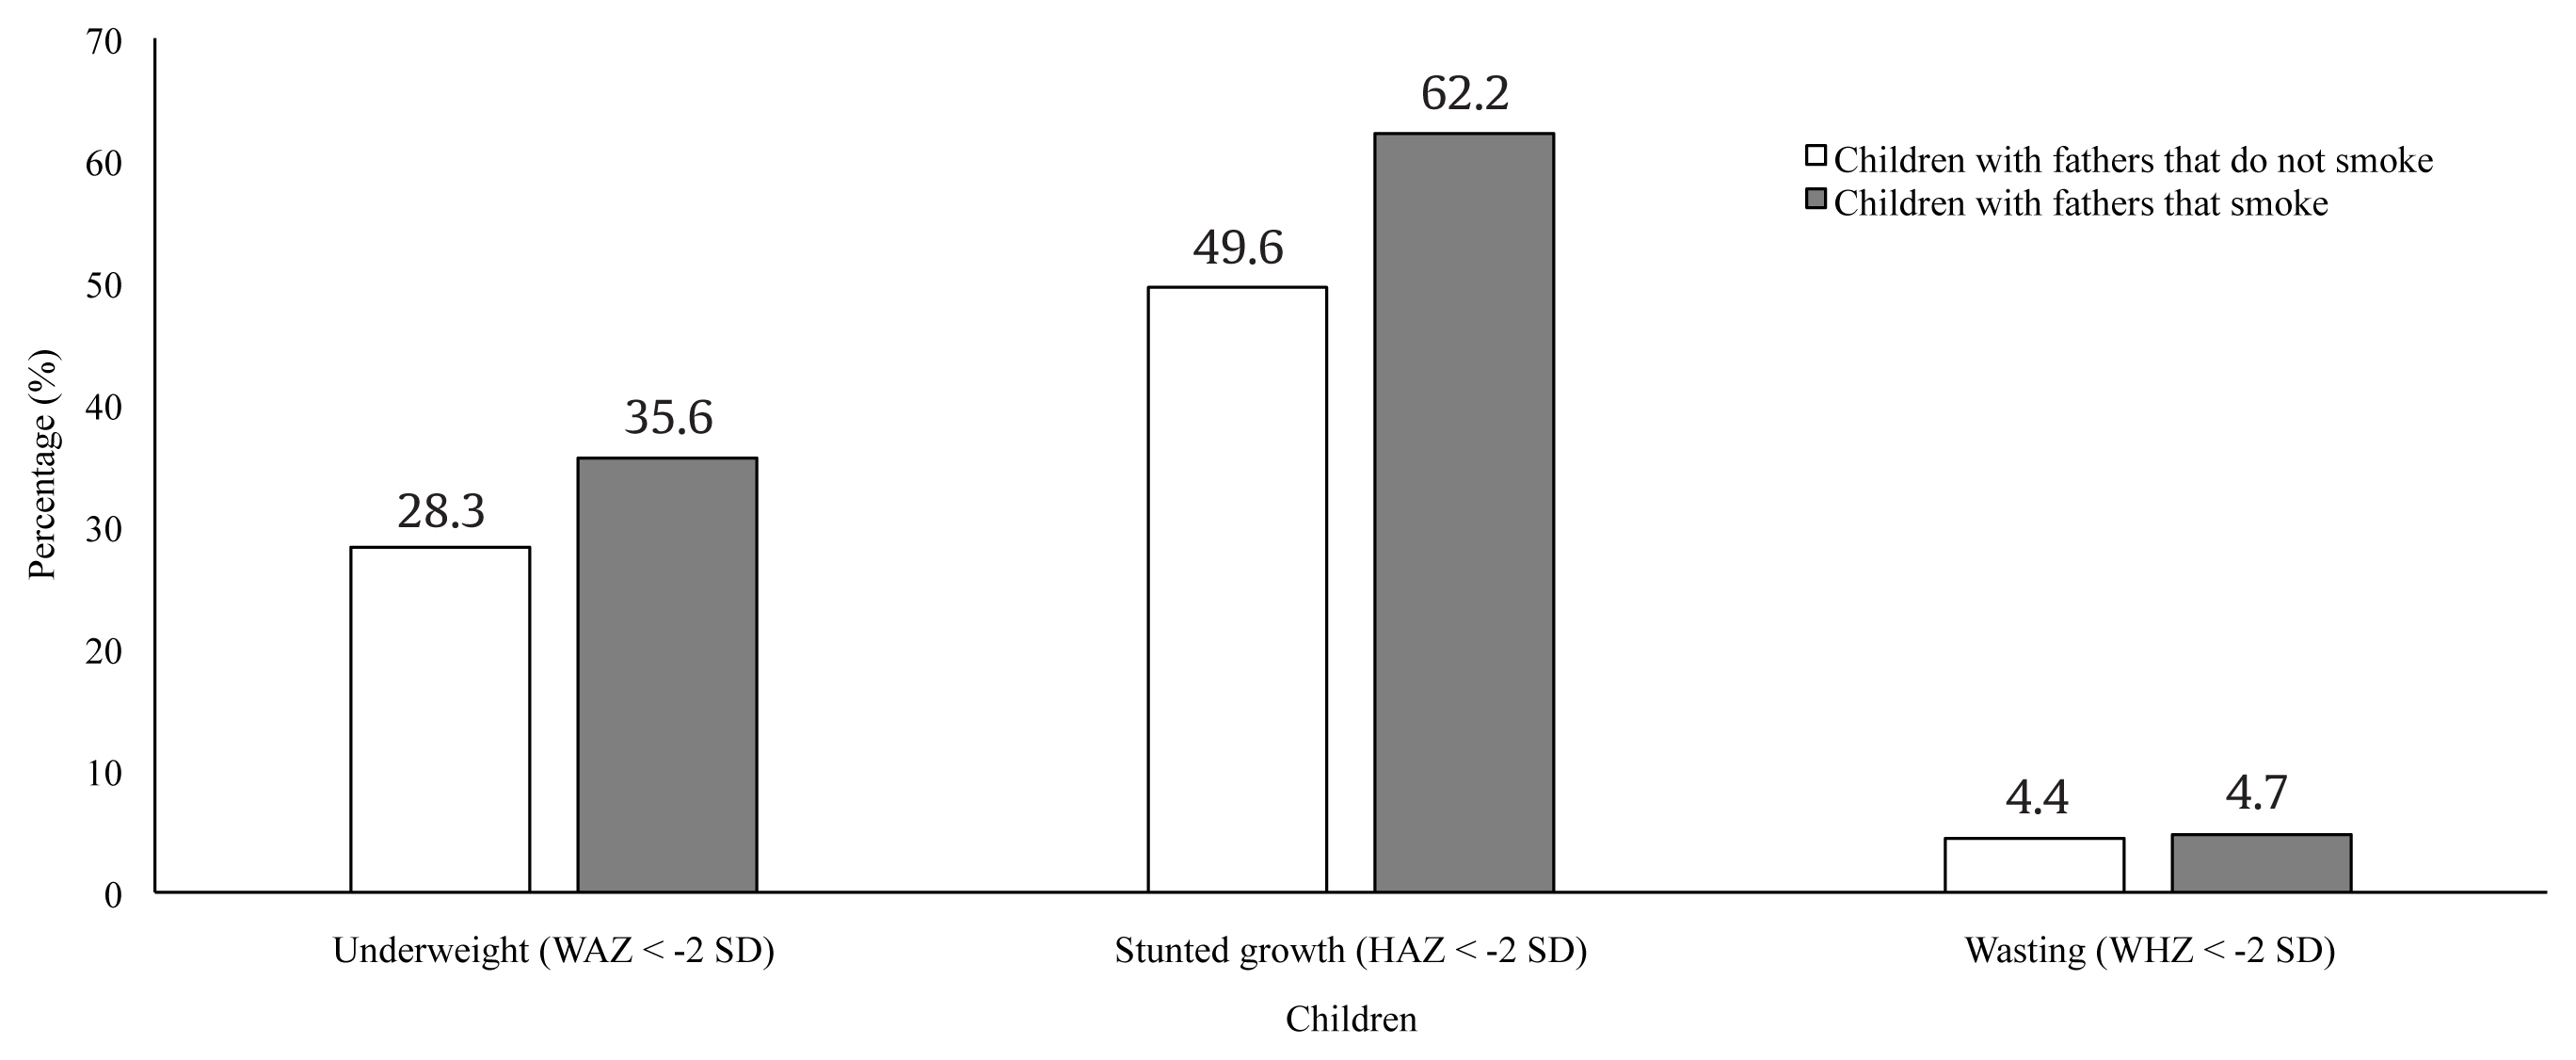
Figure & Data
References
Citations
Citations to this article as recorded by 
- Crowding-out effect of tobacco consumption in Indonesia
Arya Swarnata, Fariza Zahra Kamilah, I Dewa Gede Karma Wisana, Yurdhina Meilissa, Gita Kusnadi
Tobacco Control.2024; : tc-2022-057843. CrossRef - Do parental Smoking Behaviors Affect Children's Thinness, Stunting, and Overweight Status in Indonesia? Evidence from a Large-Scale Longitudinal Survey
Adrianna Bella, Teguh Dartanto, Dimitri Swasthika Nurshadrina, Gita Kusnadi, Faizal Rahmanto Moeis, Renny Nurhasana, Aryana Satrya, Hasbullah Thabrany
Journal of Family and Economic Issues.2023; 44(3): 714. CrossRef - Sustainable Iodized Salt Fortification Reduces the Risk of Underweight Among Under-Five Children
Nadiyah, Idrus Jus'at, Devi Angeliana Kusumaningtiar, Anugrah Novianti
Journal of Law and Sustainable Development.2023; 11(9): e1207. CrossRef - Developmental trajectories of body mass index since childhood and health-related quality of life in young adulthood: Tehran Lipid and Glucose Study
Parnian Parvin, Parisa Amiri, Mohammad Masih Mansouri-Tehrani, Leila Cheraghi, Amirali Zareie Shab-khaneh, Fereidoun Azizi
Quality of Life Research.2022; 31(7): 2093. CrossRef - Cigarette smoke exposure and increased risks of stunting among under-five children
Dyah Dwi Astuti, Tri Widyastuti Handayani, Duwi Pudji Astuti
Clinical Epidemiology and Global Health.2020; 8(3): 943. CrossRef - The association between secondhand smoke exposure and
growth outcomes of children: A systematic literature review
Siti Nadhiroh, Kusharisupeni Djokosujono, Diah Mulyawati Utari
Tobacco Induced Diseases.2020;[Epub] CrossRef
 PubReader
 ePub Link
 Cite
Cite
