Articles
- Page Path
- HOME > Osong Public Health Res Perspect > Volume 13(1); 2022 > Article
-
Original Article
Neck circumference and incidence of cerebrovascular disease over 12 years among Korean adults -
Jae-Seon Han1
 , Yun-Hee Kim2
 -
Osong Public Health and Research Perspectives 2022;13(1):71-79.
DOI: https://doi.org/10.24171/j.phrp.2021.0277
Published online: February 8, 2022
1Division of Nursing, Pusan National University Hospital, Busan, Korea
2Department of Nursing, Pukyong National University, Busan, Korea
- Corresponding author: Yun-Hee Kim Department of Nursing, Pukyong National University, 45 Yongso-ro, Nam-gu, Busan 48513, Korea E-mail: soohappy@pknu.ac.kr
© 2022 Korea Disease Control and Prevention Agency.
This is an open access article under the CC BY-NC-ND license (http://creativecommons.org/licenses/by-nc-nd/4.0/).
Abstract
-
Objectives
- Neck circumference is associated with a distinctive fat storage process that confers additional metabolic risk. Hence, this study aimed to investigate the correlation between baseline neck circumference and the incidence of cerebrovascular disease using a prospective community-based sample of Korean adults over 12 years of follow-up, after controlling for selected covariates.
-
Methods
- Participants with non-cerebrovascular disease were divided into 4 groups (Q1–Q4) based on their baseline neck circumference. Cox proportional hazards analysis was used to calculate hazard ratios and 95% confidence intervals (CIs) to evaluate the relationship between neck circumference and cerebrovascular disease incidence over a 12-year period.
-
Results
- Among this study’s 3,662 participants, 128 (3.50%) developed cerebrovascular disease. The incidence of cerebrovascular disease increased from 2.2% in Q1 to 4.3% in Q2, 2.5% in Q3, and 5.0% in Q4. When compared to Q1, the relative risks of cerebrovascular disease development were 0.57 (95 % CI, 0.25–1.31), 0.86 (95 % CI, 0.38–1.96), and 0.79 (95 % CI, 0.30–2.07) in man and 1.86 (95 % CI, 0.66–5.20), 3.50 (95 % CI, 1.25–9.86), and 4.71 (95 % CI, 1.50–14.77) in woman in Q2, Q3, and Q4, respectively, after adjusting for most risk factors related to cerebrovascular disease.
-
Conclusion
- The relationship between neck circumference and cerebrovascular disease was stronger in woman than in man, indicating potential differences between the sexes. These results are meaningful for evaluating and surveilling neck circumference as a promising tool for identifying subgroups of vulnerable and at-risk populations.
- Keywords: Cerebrovascular disorders; Korea; Neck; Public health practice
- Cerebrovascular disease, a disease of the blood vessels that supply the brain [1], is the fourth most common cause of death in Korea after cancer, heart disease, and pneumonia, and in 2019, the number of deaths from cerebrovascular disease in Korea reached 42 per 100,000 people [2]. Although the number of deaths due to cerebrovascular disease has been decreasing substantially, the incidence and prevalence of cerebrovascular disease have not been considerably reduced owing to population aging and the lack of new diagnostic techniques [3]. Depending on the specific part of the brain that is damaged, cerebrovascular disease can be accompanied by various symptoms, including motor disorders, sensory disorders, speech disorders, and emotional disorders [4]. Therefore, cerebrovascular disease is a serious national health problem that causes substantial economic losses for the nation, as well as the burden of individual medical costs, thereby necessitating early prevention and diagnosis of this chronic disease.
- Except for congenital cerebrovascular diseases, such as genetic abnormalities, most acquired cerebrovascular diseases can be prevented by controlling risk factors [5] such as hypertension, smoking, obesity, and diabetes [6]. Since the incidence of cerebrovascular disease increases with age [5], controlling these modifiable risk factors may reduce the incidence of cerebrovascular disease. Therefore, a screening tool that can detect individuals at high risk of developing cerebrovascular disease at an early stage is required; however, currently, most cerebrovascular diseases are only diagnosed at the onset of symptoms [7].
- Neck circumference (NC) is an easy, reliable, and widely affordable anthropometric indicator. NC can be measured with a measuring tape just below the laryngeal prominence of the neck in an upright position [8]; therefore, it can be measured easily and quickly. NC is related to several factors, including age, sex, body mass index (BMI), weight, waist circumference, and systolic blood pressure [9–12]. These indicators also correspond to the risk factors for cerebrovascular diseases [13]. Growing evidence suggests that NC is a novel indicator of upper-body subcutaneous fat distribution [14]. In particular, upper-body fat distribution with increased visceral fat has been shown to be a better predictor of metabolic complications of obesity than the degree of overweight [15]. Furthermore, as an indicator of subcutaneous adipose tissue distribution in the upper-body [16], NC has been found to be associated with cardiometabolic risk factors in populations with diverse ethnic backgrounds [17–19]. In the Framingham Heart Study, participants with a large NC had more cardiometabolic risk factors than those with a small NC, even after adjusting for BMI [20]. Additionally, NC is regarded as an indicator of upper-body obesity and is positively correlated with changes in blood pressure and other components of metabolic syndrome [21].
- Ultrasound, computed tomography, and magnetic resonance imaging are the gold standard imaging modalities for determining obesity, body fat distribution, and further diagnosis. However, these methods are frequently costly and impractical in large-scale or long-term investigations; thus, reliable, simple, and easy-to-implement measurements of obesity and body fat distribution are required [12]. Compared to standard measures, NC may be a useful and convincing alternative measure for obesity, a better indicator of metabolic risk [19], and may also be effective in screening health risks in the general public, particularly for large samples where non-invasive, low-cost, and simple-to-implement measures are needed.
- Previous studies in Korea have shown significant relationships between NC and obesity, diabetes, cardiovascular disease, and obstructive sleep apnea [22–25]. However, to the best of our knowledge, the potential association between NC and the incidence of cerebrovascular disease has not been previously investigated in middle-aged and older Korean individuals. Hence, this study aimed to determine the association of baseline NC with the incidence of cerebrovascular disease using a prospective community-based sample of Korean adults over a 12-year follow-up period, after controlling for selected covariates.
Introduction
- Study Population
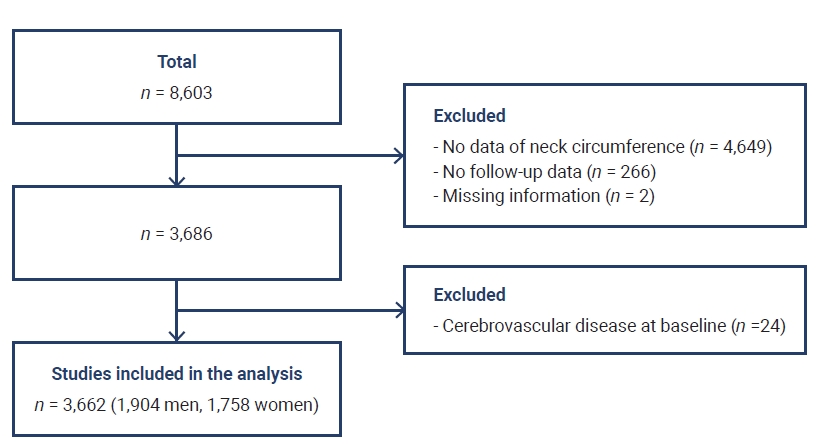
- The present study was performed using data from the Korean Genome and Epidemiology Study (KoGES), a prospective community-based cohort study. The study cohort consisted of 40- to 69-year-old residents of Ansan or Ansung City, near the capital city of Seoul. Assessments were conducted biennially between 2003 and 2015. Initially, 8,603 participants were included in the baseline survey. NC was measured in Ansan as an anthropometric index related to respiratory diseases. Participants with missing data or cerebrovascular disease at baseline were excluded. Thus, a total of 3,662 participants were included in the final analysis (Figure 1). All participants volunteered for the study, and informed consent was obtained from each patient.
- Definition of Cerebrovascular Disease
- The diagnosis of cerebrovascular disease in this study was defined as a history of stroke (including cerebral infarction and cerebral hemorrhage), which was established by an answer of “yes” to the question, “Have you ever been diagnosed with cerebrovascular disease by a doctor in a hospital in the past?”
- Measures
- Participants in the KoGES were examined biannually by trained interviewers using a questionnaire that included participants’ demographic factors (age, marital status, and employment), health behaviors (smoking, drinking, and regular exercise), and comorbidities (hypertension, diabetes, and hyperlipidemia). Anthropometric parameters (height, body weight, and NC) were measured using standard methods.
- NC (cm) was measured using non-stretchable plastic tape to the nearest 1 mm from the level just below the laryngeal prominence perpendicular to the long axis of the neck with the head positioned in the Frankfurt horizontal plane.
- The variables included as covariates in this study were demographic factors, health behaviors, comorbidities, and BMI. Age was categorized into 3 groups: 40 to 49, 50 to 59, and ≥60 years. Marital status was classified as never-married and married (with the presence or absence of a spouse), and employment was classified as a dichotomous variable (yes/no). Smoking and alcohol consumption status were each classified into 3 categories: non-, former, and current. Exercise habits were divided into 2 categories: none or irregular (≤1 session/wk) and regular (≥2 sessions/wk). One session of exercise was defined as exercising for at least 30 minutes. Comorbidities were defined as the presence or absence of hypertension, diabetes, and hyperlipidemia. BMI was calculated as body weight (kg) divided by height squared (m2).
- Statistical Analysis
- The participants’ baseline characteristics were analyzed using the mean and standard deviation for continuous variables and frequency and percentage for categorical variables. Differences among groups were analyzed using an analysis of variance with the Scheffé post-hoc analysis method for continuous variables and the chi-square test for categorical variables. The cumulative rates of the incidence of cerebrovascular disease were estimated using Kaplan-Meier survival curves, and equality was compared using log-rank tests. Cox proportional hazards analyzes were conducted to estimate hazard ratios (HRs) and 95% confidence intervals (CIs) for the association between NC and cerebrovascular disease incidence over 12 years. Multivariate Cox proportional hazards regression analysis was performed to identify the association between NC and cerebrovascular disease incidence after controlling for covariates (demographic factors, health behaviors, comorbidities, and BMI) at baseline. The analyses were performed using IBM SPSS ver. 25.0 (IBM Corp., Armonk, NY, USA). For all tests, statistical significance was set at p<0.05.
- Ethics Statement
- The Institutional Review Board of Pukyong National University approved the study protocol (IRB No. 1041386-201907-HR-29-01). The study protocol was also approved by the Ethics Committee of KoGES at the Korean National Institute of Health, and the study was performed in accordance with approved guidelines.
Materials and Methods
- Of the total study population of 3,662 adults aged ≥40 years, 52.0% were man (n=1,904). The mean NC was 37.7±2.1 cm, 32.9±1.8 cm, and 35.4±3.1 cm in man, woman, and the total study population, respectively. Participants’ mean age at study entry was 50.5±7.5 years for the total study population; and 50.1±7.3 and 50.9±7.8 years for man and woman, respectively. The average proportion of the population with spouses and the rate of employment was higher for man. Man also had a higher proportion of current smokers and drinkers. Woman was less likely than man to exercise regularly. The total population’s average BMI was 24.6±2.9 kg/m2, which was similar in man and woman. Woman had a higher proportion of participants with hyperlipidemia and hypertension, but that of diabetes was lower (Table 1).
- A thicker NC was found in woman who were older, married, and unemployed, while in man, current drinkers were found to have a thicker NC than those who did not drink. The presence of chronic disease (hypertension, diabetes, and hyperlipidemia) was associated with a thicker NC in both man and woman (Table 2).
- Over the follow-up period (0–12 years), 128 adults developed cerebrovascular disease, including 69 men and 59 women. The incidence was significantly higher in man (3.5/1,000 person-years) than in woman (3.2/1,000 person-years). Table 3 demonstrates the incidence of cerebrovascular disease rates over an average of 10.6±2.9 years in man and woman, stratified by quartiles of NC. As expected, a thicker NC was correlated with a higher incidence of cerebrovascular disease in the total study population. No significant differences in incidence were found among man, but there were significant differences between the thinnest and thickest NC groups in woman.
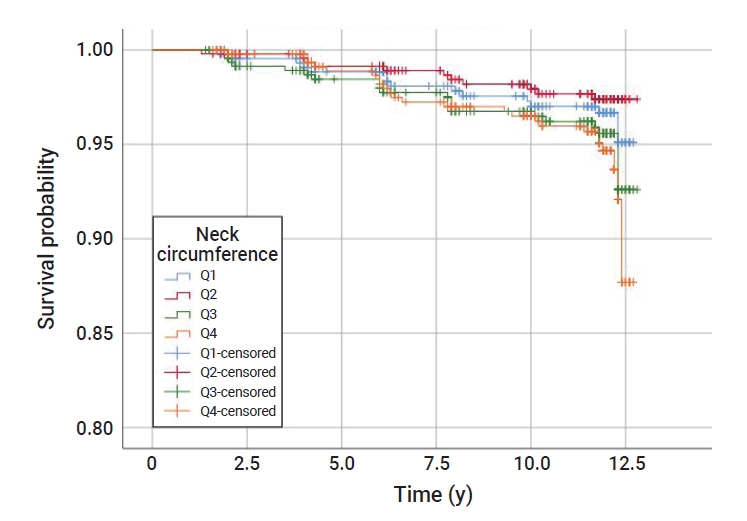
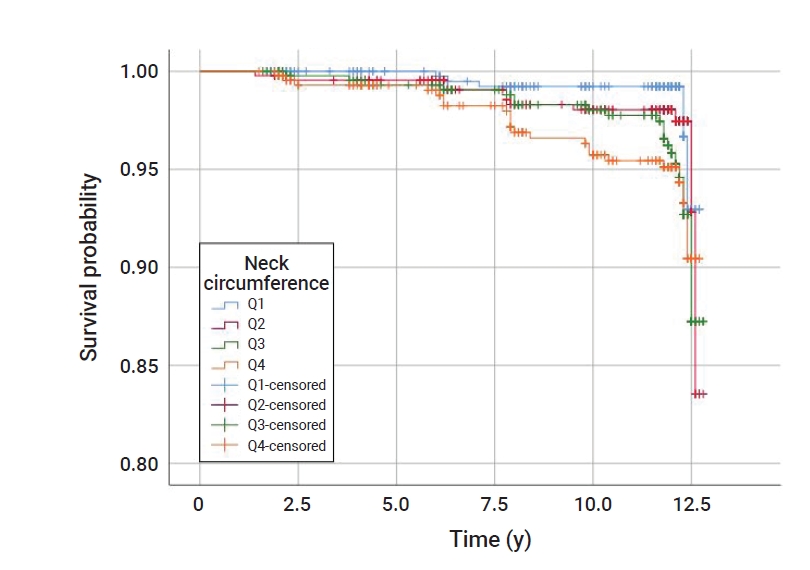
- Table 4 provides the HRs, controlled for covariates, of cerebrovascular disease incidence in association with NC according to sex. The HRs of the incidence of cerebrovascular disease in the thickest quartile group of NC (man, ≥39.1 cm; woman, ≥34.0 cm) were consistently higher than those in the thinnest NC group (man, <36.2 cm; woman, <31.5 cm). Compared to the lowest quartile (i.e., the reference group), the fully multivariate-adjusted HRs of the incidence of cerebrovascular disease in the thickest NC group were 0.79 (95% CI, 0.30–2.07) for man and 4.71 (95% CI, 1.50–14.77) for woman. Regarding the sex-related differences between NC and risk of cerebrovascular disease occurrence, man showed no statistically significant differences between the quartiles; however, in woman, the higher quartiles (Q3, ≥32.8 and <34.0 cm; Q4, ≥34.0 cm) had a higher incidence of cerebrovascular disease than the reference group (Q1, <31.6 cm). The significance of the relationship between NC and the incidence of cerebrovascular disease was confirmed with additional multivariate-adjusted Cox regression models. The Kaplan-Meier survival curves presented in Figures 2 and 3 show the overall survival rate of woman with a thinner NC; in man, Q2 of NC showed a better overall survival rate.
Results
- In this prospective survey study using community-based cohort data, a thicker NC at study entry (i.e., baseline) was significantly associated with a higher incidence of cerebrovascular disease over the 12 years of follow-up in Korean woman aged over ≥40 years. Furthermore, the significance of this relationship between NC and cerebrovascular disease incidence was stronger in woman than in man, even after adjusting for the selected covariates.
- Previous studies have shown a significant negative correlation between NC and incident stroke in various adult populations [26,27]. In a similar manner, the powerful association found in our study was independent of age, socioeconomic factors, health behaviors, and comorbidities. While other studies concentrated on older adults (mean age of 65 years) [27], our study population was younger, with an average age of 50 years (range, 40–71 years). Taken together, these results present the anticipatory value of NC for future incident cerebrovascular disease among middle-aged and elderly adults.
- This study demonstrated that there were differences in the association between NC and cerebrovascular disease incidence with respect to sex. The mean values of NC were significantly different between man and woman (37.7 cm and 32.9 cm, respectively). When comparing the incidence rate of cerebrovascular diseases per 1,000 person-years, man and woman had similar incidence rates (3.5 and 3.2, respectively), but in man, the incidence did not increase along with the NC quartile. These results were judged to reflect the self-reports from the study participants without determining whether cerebrovascular disease occurred through a standardized diagnostic process; therefore, it is thought that disease incidence was underestimated. Thus, additional studies are needed to accurately evaluate the occurrence of cerebrovascular disease over time.
- Only a few studies have examined the sex-specific relationship between relevant factors; however, there have been mixed findings [28,29]. Marrugat et al. [28] estimated the incidence of cerebrovascular disease in the Spanish population in 2002 and found that the cumulative incidence of cerebrovascular disease per 100,000 people was 218 for man and 127 for woman. In contrast, Ben-Noun and Laor [29] reported a significant association between NC and BMI, waist circumference, waist-to-hip ratio, total cholesterol, low-density lipoprotein-cholesterol, triglycerides, glucose, uric acid, and blood pressure, which were found to be more relevant for woman than for man. These factors are also positively associated with the onset of cerebrovascular disease. Therefore, it can be predicted that a higher NC in woman may increase their risk of developing cerebrovascular diseases. By using population-based data, the present study provides new information on the association between NC and cerebrovascular disease in the Korean population.
- Similar to cerebrovascular disease, the incidence of cardiovascular disease has also been reported to increase rapidly after the age of 40, then proportionally with age, and it also varies according to sex [13,27]. Woman in particular, experience a variety of menopausal symptoms such as reduced levels of female sex hormones, increased weight, increased stress, and decreased physical activity after the age of 45 [30]. In addition, as age increases, the prevalence of various chronic diseases, including hypertension, diabetes, and hyperlipidemia also increases; this leads to an increase in the incidence of cardiovascular disease and mortality from coronary artery disease in older individuals [1]. As a result, man is more likely than woman to develop cardiovascular disease before they reach the age of 60, but woman is more likely to develop cardiovascular disease in their 60s or older, and woman is 2 times more likely to develop cardiovascular disease than man in their 80s or older [31]. Middle-aged woman is known to have an increased quantity of internal fat due to menopause [32], which leads to a concurrent increase in NC. As such, NC should be carefully monitored in this population of woman.
- Among various anthropometric measures, NC is an indicator of the distribution of subcutaneous tissue in the upper body, and it can be measured quickly and relatively inexpensively [23]. In addition, because no special equipment is required, it is easy and feasible to educate people visiting public health centers or primary medical centers on how to measure NC. The increasing evidence supporting the relationship between NC and disease prediction suggests that simply assessing and monitoring NC has great potential for disease prevention in community-based settings. Moreover, it is important that adults, children, and adolescents are educated about NC and its related long-term health effects, as this may motivate them to modify their health behaviors, such as nutrition and physical activity. NC measurements can serve as a practical screening assessment tool for the early detection of individuals vulnerable to disease in community-based health promotion initiatives.
- The limitations of this study include the use of self-reported data, particularly regarding health behaviors and comorbidities. However, since these data were collected from face-to-face interviews by trained interviewers, the validity of the data was improved. Additionally, because of the nature of nationwide population-based survey studies, the measurements of the data were rather simple. Nevertheless, the relationships of the baseline variables with NC and cerebrovascular disease incidence shown in this study are consistent with those of a previous study that used other standardized instruments [8]. Furthermore, we were not able to address other covariates, such as disease severity. Due to the lack of specific data on the diagnosis of diseases in this set of survey data, attention should be paid to the broad interpretation of the association between NC and the risk of developing cerebrovascular diseases. Finally, since this study identified the association between NC and cerebrovascular disease incidence by adjusting for the age of adult woman, we suggest further studies should investigate NC and the incidence of cerebrovascular disease according to menopausal status in middle-aged woman. The advantages of this study are its prospective study design with a relatively long follow-up period and the use of population-based interview data with population rates over the follow-up period. To the best of our knowledge, this is the first study to explore the longitudinal and independent relationship between NC and the incidence of cerebrovascular disease in middle-aged and older Korean adults, controlling for various covariates.
Discussion
- The results of this study showed that Korean adult woman with a thicker NC had a higher risk of developing cerebrovascular disease. This relationship was not influenced by age, socioeconomic status, selected health behaviors, or comorbidities. Therefore, the results we presented here may be meaningful for evaluating and surveilling NC as a promising tool for identifying subgroups of vulnerable and at-risk populations. To develop customized interventions to reduce and maintain upper-body fat in Korean adults, further research using a longitudinal assessment of NC and follow-up research to track sex-specific differences is warranted.
Conclusion
-
Ethics Approval
The Institutional Review Board of Pukyong National University approved the study protocol (IRB No. 1041386-201907-HR-29-01). The study protocol was also approved by the Ethics Committee of KoGES at the Korean National Institute of Health, and the study was performed in accordance with the approved guidelines.
-
Conflicts of Interest
The authors have no conflicts of interest to declare.
-
Funding
This work was supported by a Research Grant from Pukyong National University (2021).
-
Availability of Data
All data were obtained from the Korean Genome and Epidemiology Study (KoGES) of the National Research Institute of Health (NIH).
Article information

| Man (n=1,904, 52.0%) | Woman (n=1,758, 48.0%) | Total (n=3,662, 100%) | |||||||||||||
|---|---|---|---|---|---|---|---|---|---|---|---|---|---|---|---|
| Neck circumference (quartile) | Q1 (n=451) | Q2 (n=493) | Q3 (n=477) | Q4 (n=483) | p | Q1 (n=428) | Q2 (n=448) | Q3 (n=448) | Q4 (n=434) | p | Q1 (n=909) | Q2 (n=906) | Q3 (n=923) | Q4 (n=924) | p |
| Age (y) | 50.6±7.8 | 50.2±7.3 | 49.9±7.4 | 49.8±6.6 | 0.331 | 49.3±6.9 | 50.3±7.6 | 51.7±7.9 | 52.2±8.3 | <0.001 | 49.8±7.3 | 51.5±7.9 | 50.6±7.7 | 49.9±7.0 | <0.001 |
| Age groups (y) | 0.113 | <0.001 | <0.001 | ||||||||||||
| 40–49 | 257 (57.0) | 285 (57.8) | 295 (61.8) | 288 (59.6) | 272 (63.6) | 260 (58.0) | 228 (50.9) | 209 (48.2) | 551 (60.6) | 468 (51.7) | 518 (56.1) | 557 (60.3) | |||
| 50–59 | 119 (26.4) | 139 (28.2) | 110 (23.1) | 141 (29.2) | 106 (24.8) | 124 (27.7) | 137 (30.6) | 124 (28.6) | 238 (26.2) | 266 (29.4) | 252 (27.3) | 244 (26.4) | |||
| ≥60 | 75 (16.6) | 69 (14.0) | 72 (15.1) | 54 (11.2) | 50 (11.7) | 64 (14.3) | 83 (18.5) | 101 (23.3) | 120 (13.2) | 172 (19.0) | 153 (16.6) | 123 (13.3) | |||
| Marital status | 0.486a) | 0.001a) | <0.001 | ||||||||||||
| Never married | 3 (0.7) | 5 (1.0) | 1 (0.2) | 1 (0.2) | 4 (0.9) | 3 (0.7) | 2 (0.4) | 3 (0.7) | 7 (0.8) | 5 (0.6) | 8 (0.9) | 2 (0.2) | |||
| Married (spouse present) | 434 (96.2) | 474 (96.1) | 467 (97.9) | 473 (97.9) | 392 (91.6) | 392 (87.5) | 395 (88.2) | 364 (83.9) | 813 (89.4) | 807 (89.1) | 868 (94.0) | 903 (97.7) | |||
| Married (spouse absent) | 14 (3.1) | 14 (2.8) | 9 (1.9) | 9 (1.9) | 32 (7.5) | 53 (11.8) | 51 (11.4) | 67 (15.4) | 89 (9.8) | 94 (10.4) | 47 (5.1) | 19 (2.1) | |||
| Employment | 392 (86.9) | 430 (87.2) | 432 (90.6) | 430 (89.0) | 0.260 | 164 (38.3) | 157 (35.0) | 145 (32.4) | 118 (27.2) | 0.005 | 340 (37.4) | 394 (43.5) | 713 (77.2) | 821 (88.9) | <0.001 |
| Smoking | 0.086 | 0.374 | <0.001 | ||||||||||||
| Non-smoker | 119 (26.4) | 99 (20.1) | 103 (21.6) | 94 (19.5) | 410 (95.8) | 428 (95.5) | 436 (97.3) | 421 (97.0) | 861 (94.7) | 729 (80.5) | 324 (35.1) | 196 (21.2) | |||
| Former smoker | 153 (33.9) | 206 (41.8) | 190 (39.8) | 200 (41.4) | 8 (1.9) | 4 (0.9) | 5 (1.1) | 4 (0.9) | 17 (1.9) | 81 (8.9) | 302 (32.7) | 370 (40.0) | |||
| Current smoker | 179 (39.7) | 188 (38.1) | 184 (38.6) | 189 (39.1) | 10 (2.3) | 16 (3.6) | 7 (1.6) | 9 (2.1) | 31 (3.4) | 96 (10.6) | 297 (32.2) | 358 (38.7) | |||
| Drinking | 0.050 | 0.503 | <0.001 | ||||||||||||
| Non-drinker | 91 (20.2) | 73 (14.8) | 72 (15.1) | 78 (16.1) | 260 (60.7) | 281 (62.7) | 281 (62.7) | 292 (67.3) | 560 (61.6) | 487 (53.8) | 229 (24.8) | 152 (16.5) | |||
| Former drinker | 45 (10.0) | 35 (7.1) | 30 (6.3) | 39 (8.1) | 9 (2.1) | 11 (2.5) | 11 (2.5) | 6 (1.4) | 22 (2.4) | 34 (3.8) | 63 (6.8) | 67 (7.3) | |||
| Current drinker | 315 (69.8) | 385 (78.1) | 375 (78.6) | 366 (75.8) | 159 (37.1) | 156 (34.8) | 156 (34.8) | 136 (31.3) | 327 (36.0) | 385 (42.5) | 631 (68.4) | 705 (76.2) | |||
| Regular exercise | 245 (54.3) | 276 (56.0) | 286 (60.0) | 281 (58.2) | 0.322 | 229 (53.5) | 254 (56.7) | 253 (56.5) | 243 (56.0) | 0.768 | 507 (55.8) | 514 (56.7) | 502 (54.4) | 544 (58.9) | 0.261 |
| BMI (kg/m2) | 21.7±1.9 | 23.7±1.6 | 25.3±1.6 | 27.2±2.1 | <0.001 | 21.9±1.9 | 23.6±1.9 | 25.5±2.1 | 27.6±2.9 | <0.001 | 22.8±2.2 | 24.8±2.9 | 24.4±2.8 | 26.5±2.2 | <0.001 |
| Hypertension | 32 (7.1) | 43 (8.7) | 73 (15.3) | 95 (19.7) | <0.001 | 26 (6.1) | 45 (10.0) | 59 (13.2) | 103 (23.7) | <0.001 | 74 (8.1) | 118 (13.0) | 122 (13.2) | 162 (17.5) | <0.001 |
| Diabetes | 24 (5.3) | 32 (6.5) | 45 (9.4) | 70 (14.5) | <0.001 | 7 (1.6) | 12 (2.7) | 20 (4.5) | 52 (12.0) | <0.001 | 20 (2.2) | 58 (6.4) | 75 (8.1) | 109 (11.8) | <0.001 |
| Hyperlipidemia | 2 (0.4) | 7 (1.4) | 11 (2.3) | 3 (0.6) | 0.035 | 7 (1.6) | 7 (1.6) | 8 (1.8) | 19 (4.4) | 0.014 | 14 (1.5) | 21 (2.3) | 15 (1.6) | 14 (1.5) | 0.510 |
Model were adjusted for demographic factors (age, marital status, employment), health behaviors (smoking, drinking, regular exercise), body mass index, and comorbidities (hypertension, diabetes, hyperlipidemia).
HR, hazard ratio; CI, confidence interval; Q, quartile; Q1, lowest; Q2, low-middle; Q3, middle-high; Q4, highest.
- 1. World Health Organization (WHO). Cardiovascular diseases (CVDs) [Internet]. Geneva: WHO; 2021 [cited 2021 Jun 11]. Available from: https://www.who.int/news-room/fact-sheets/detail/cardiovascular-diseases-(cvds).
- 2. Statistics Korea. Cause of death statistics [Internet]. Daejeon: Statistics Korea; 2020 [cited 2022 Jan 8]. Available from: http://kostat.go.kr/assist/synap/preview/skin/miri.html?fn=eacdb146417035530195851&rs=/assist/synap/preview. Korean.
- 3. Truelsen T, Piechowski-Jozwiak B, Bonita R, et al. Stroke incidence and prevalence in Europe: a review of available data. Eur J Neurol 2006;13:581−98.ArticlePubMed
- 4. Pucciarelli G, Ausili D, Galbussera AA, et al. Quality of life, anxiety, depression and burden among stroke caregivers: a longitudinal, observational multicentre study. J Adv Nurs 2018;74:1875−87.Article
- 5. Caprio FZ, Sorond FA. Cerebrovascular disease: primary and secondary stroke prevention. Med Clin North Am 2019;103:295−308.PubMed
- 6. Khaku AS, Tadi P. Cerebrovascular disease [Internet]. Treasure Island, FL: StatPearls Publishing; 2021 [cited 2021 Aug 11]. Available from: http://www.ncbi.nlm.nih.gov/books/NBK430927/.
- 7. Portegies ML, Koudstaal PJ, Ikram MA. Cerebrovascular disease. Handb Clin Neurol 2016;138:239−61.ArticlePubMed
- 8. Cho NH, Oh TJ, Kim KM, et al. Neck circumference and incidence of diabetes mellitus over 10 years in the Korean Genome and Epidemiology Study (KoGES). Sci Rep 2015;5:18565. ArticlePubMedPMC
- 9. Ben-Noun L, Sohar E, Laor A. Neck circumference as a simple screening measure for identifying overweight and obese patients. Obes Res 2001;9:470−7.ArticlePubMed
- 10. Tibana RA, Teixeira TG, de Farias DL, et al. Relation of neck circumference and relative muscle strength and cardiovascular risk factors in sedentary women. Einstein 2012;10:329−34.PubMed
- 11. Kuciene R, Dulskiene V, Medzioniene J. Association of neck circumference and high blood pressure in children and adolescents: a case-control study. BMC Pediatr 2015;15:127. ArticlePubMedPMC
- 12. Famodu OA, Barr ML, Colby SE, et al. Neck circumference positively relates to cardiovascular risk factors in college students. Int J Environ Res Public Health 2018;15:1480. ArticlePubMedPMC
- 13. Love S, Miners JS. Cerebrovascular disease in ageing and Alzheimer's disease. Acta Neuropathol 2016;131:645−58.ArticlePubMed
- 14. Fantin F, Comellato G, Rossi AP, et al. Relationship between neck circumference, insulin resistance and arterial stiffness in overweight and obese subjects. Eur J Prev Cardiol 2017;24:1532−40.ArticlePubMed
- 15. Levine JA, Ray A, Jensen MD. Relation between chubby cheeks and visceral fat. N Engl J Med 1998;339:1946−7.Article
- 16. Liang J, Wang Y, Dou L, et al. Neck circumference and prehypertension: the cardiometabolic risk in Chinese study. J Hypertens 2015;33:275−8.PubMedPMC
- 17. Arnold TJ, Schweitzer A, Hoffman HJ, et al. Neck and waist circumference biomarkers of cardiovascular risk in a cohort of predominantly African-American college students: a preliminary study. J Acad Nutr Diet 2014;114:107−16.ArticlePubMed
- 18. Zhou JY, Ge H, Zhu MF, et al. Neck circumference as an independent predictive contributor to cardio-metabolic syndrome. Cardiovasc Diabetol 2013;12:76. ArticlePubMedPMC
- 19. Joshipura K, Munoz-Torres F, Vergara J, et al. Neck circumference may be a better alternative to standard anthropometric measures. J Diabetes Res 2016;2016:6058916. ArticlePubMedPMC
- 20. Preis SR, Massaro JM, Hoffmann U, et al. Neck circumference as a novel measure of cardiometabolic risk: the Framingham Heart study. J Clin Endocrinol Metab 2010;95:3701−10.ArticlePubMedPMC
- 21. Ben-Noun LL, Laor A. Relationship between changes in neck circumference and changes in blood pressure. Am J Hypertens 2004;17:409−14.ArticlePubMed
- 22. Kang JH, Ryu BY, Suh HS, et al. Neck circumference as a simple obesity index. J Korean Soc Study Obes 2002;11:142−9. Korean.
- 23. Chaung SK. Neck circumference as a measure for identifying obesity in female college students. J Korean Acad Funda Nurs 2005;12:347−53. Korean.
- 24. Kang JH, Yu BY. Relationship of neck circumference to cardiovascular risk factors. J Korean Soc Study Obes 2003;12:137−45. Korean.
- 25. Kim CS, Kim DS. Correlation of body mass index and neck circumference in patients with obstructive sleep apnea-hypopnea syndrome. Korean Soc Clin Lab Sci 2007;39:141−6. Korean.
- 26. Rosenquist KJ, Massaro JM, Pencina KM, et al. Neck circumference, carotid wall intima-media thickness, and incident stroke. Diabetes Care 2013;36:e153−4.ArticlePubMedPMC
- 27. Medeiros CA, Bruin VM, Castro-Silva Cd, et al. Neck circumference, a bedside clinical feature related to mortality of acute ischemic stroke. Rev Assoc Med Bras (1992) 2011;57:559−64.ArticlePubMed
- 28. Marrugat J, Arboix A, Garcia-Eroles L, et al. The estimated incidence and case fatality rate of ischemic and hemorrhagic cerebrovascular disease in 2002 in Catalonia. Rev Esp Cardiol 2007;60:573−80. Spanish.PubMed
- 29. Ben-Noun L, Laor A. Relationship of neck circumference to cardiovascular risk factors. Obes Res 2003;11:226−31.ArticlePubMed
- 30. Korea Institute for Health and Social Affairs. In-depth analyzes of the third national health and nutrition examination survey: the health interview and health behavior survey part [Internet]. Sejong: Korea Institute for Health and Social Affairs; 2007 [cited 2011 May]. Available from: http://repository.kihasa.re.kr/handle/201002/1419. Korean.
- 31. National Health Insurance. The older you are, the more dangerous “cerebral infarction”, and lifestyle changes are needed [Internet]. Sejong: National Health Insurance; 2016 [cited 2016, Oct 24]. Available from: http://www.mohw.go.kr/react/al/sal0301vw.jsp?PAR_MENU_ID=04&MENU_ID=0403&page=2&CONT_SEQ=334616. Korean.
- 32. Cyn J. Effects of menopause on obstructive sleep apnea. Sleep Med Psychophysiol 2010;17:11−5.
References
Figure & Data
References
Citations
- Neck circumference as a predictor of all-cause mortality in middle-aged and older adults in rural Ecuador
Oscar H Del Brutto, Denisse A Rumbea, Maitri Patel, Robertino M Mera
International Health.2024;[Epub] CrossRef - The association of Carbohydrate Quality Index with cardiovascular disease risk factors among women with overweight and obesity: A cross-sectional study
Darya Khosravinia, Farideh Shiraseb, Atieh Mirzababaei, Elnaz Daneshzad, Shahin Jamili, Cain C. T. Clark, Khadijeh Mirzaei
Frontiers in Nutrition.2022;[Epub] CrossRef
 PubReader
 ePub Link
 Cite
Cite