Analysis of Resistance to Macrolide–Lincosamide–Streptogramin B Among mecA-Positive Staphylococcus Aureus Isolates
Article information
Abstract
Objectives
Genetic determinants conferring resistance to macrolide, lincosamide, and streptogramin B (MLSB) via ribosomal modification such as, erm, msrA/B and ereA/B genes are distributed in bacteria. The main goals of this work were to evaluate the dissemination of MLSB resistance phenotypes and genotypes in methicillin-resistant Staphylococcus aureus (MRSA) isolates collected from clinical samples.
Methods
A total of 106 MRSA isolates were studied. Isolates were recovered from 3 hospitals in Tehran between May 2016 to July 2017. The prevalence of MLSB-resistant strains were determined by D-test, and then M-PCR was performed to identify genes encoding resistance to macrolides, lincosamides, and streptogramins in the tested isolates.
Results
The frequency of constitutive resistance MLSB, inducible resistance MLSB and MSB resistance were 56.2%, 22.9%, and 16.6%, respectively. Of 11 isolates with the inducible resistance MLSB phenotype, ermC, ermB, ermA and ereA were positive in 81.8%, 63.6%, 54.5% and 18.2% of these isolates, respectively. In isolates with the constitutive resistance MLSB phenotype, the prevalence of ermA, ermB, ermC, msrA, msrB, ereA and ereB were 25.9%, 18.5%, 44.4%, 0.0%, 0.0%, 11.1% and 0.0%, respectively.
Conclusion
Clindamycin is commonly administered in severe MRSA infections depending upon the antimicrobial susceptibility findings. This study showed that the D-test should be used as an obligatory method in routine disk diffusion assay to detect inducible clindamycin resistance in MRSA so that effective antibiotic treatment can be provided.
Introduction
Staphylococcus aureus causes a broad variety of illnesses in human beings from minor skin soft-tissue infections to intense infections such as septicemia, toxic shock syndrome, endocarditis and severe pneumonia [1]. At the beginning of 1961, the increasing rate of methicillin-resistant S. aureus (MRSA), and its distribution in therapeutic centers and the community appeared a noteworthy problem worldwide [2]. There are many drugs appropriate for the treatment of Staphylococcal infection such as aminoglycosides, tetracyclines, fluoroquinolones, macrolide (erythromycin), lincosamide (clindamycin), and vancomycin, linezolid, and daptomycin, but they swiftly lose their healing potential because of the capacity of bacteria to progress towards effective mechanisms to challenge these antimicrobials [3]. Use of a macrolide, lincosamide and streptogramin B (MLSB) provides a narrow therapeutic range for treating Staphylococcal infections, but they are often considered as a substitute therapeutic regimen [4]. There are 3 different mechanisms of resistance to MLSB including: (1) the msr gene which encodes active efflux pump; (2) the lun gene which encodes drug inactivation; and (3) ribosomal binding site alteration (by methylation and/or mutation within the 23s rRNA gene), encoded by erm cluster/genes (ermA, ermB, ermC, and ermF) among which, ermA and ermC are the main genes corresponding for resistance to MLSB in Staphylococci, which can be constitutive or inducible. The ermA gene is situated on transposon Tn 554, which has insertion sites on the S. aureus chromosome [4–6]. The ermB gene is carried by transposon Tn551. The ermC gene has been shown to be on a 3.7-kb mobile genetic element on the plasmid.
Staphylococcal strains that are resistant to erythromycin, may be susceptible to clindamycin and give a D-shaped inhibition zone around the clindamycin disk with flattening towards erythromycin (an inducible MLSB phenotype). Isolates resistant to both erythromycin and clindamycin with a spherical inhibition zone are known as having a constitutive resistance MLSB (cMLSB) phenotype [7,8]. Staphylococcal species showing resistance to erythromycin but sensitivity to clindamycin, gave a spherical district of inhibition around clindamycin and was categorized as having an MS (resistant to erythromycin and sensitive to clindamycin) phenotype [8]. The msrA gene codes for an ATP-dependent transporter that disseminates erythromycin and streptogramin B from the cell environment via energy, and has been recognized only in Staphylococcus species [9]. Also, to date, the mere efflux proteins corresponding for acquiring macrolide resistance described in Staphylococcus species, are ABC transporters encoded by plasmid-borne msr genes [5,10]. The goal of the current study was phenotypic and genotypic investigation of resistance to MLSB, by a D-test and PCR for gene amplification among MRSA strains obtained from patients admitted to 3 teaching hospitals, in Tehran, Iran.
Material and Methods
1. Clinical specimens and laboratory identification
In the descriptive cross-sectional study, 106 non-repetitive clinical isolates of MRSA were obtained over 15 months from May 2016 to July 2017 from individuals referred to 3 teaching hospitals (Shariati, Imam Khomeini, and Children’s Medical Center), Tehran, Iran. All isolates were cultured on Mannitol Salt Agar (Mannitol plus 7.5% sodium chloride, Merck, Darmstadt, Germany) and incubated at 37°C for 24 hours. Recognition of all doubtful grown colonies was performed based on routine standard biochemical and microbiological tests. Strains were cultivated in Luria–Bertani broth (Merck, Darmstadt, Germany) plus 20% glycerol at −80°C for further uses.
2. Antibiotic susceptibility test
In accordance with the Clinical and Laboratory Standards Institute (CLSI document M100, 28th ed) recommendation [11], antimicrobial susceptibility assays were carried out on the Mueller-Hinton agar petri dishes (Merck, Darmstadt, Germany) using the disk agar diffusion technique for erythromycin (ERY; 15 μg), clindamycin (CC; 2 μg), gentamicin (GM; 10 μg), ciprofloxacin (CP; 5 μg), tetracycline (TE; 30 μg), ampicillin (AM; 20 μg), mupirocin (MUP; 5 μg), cefoxitin (FOX; 30 μg), rifampin (RA; 5μg), linezolid (LNZ; 30 μg) and trimethoprim-sulfamethoxazole (SXT; 5 μg) (MAST Diagnostics, Merseyside, UK). S. aureus ATCC 25923 was considered as a reference strain.
3. MIC E-test
Vancomycin (VA) MIC E-test strips (ranging from 0.016 to 256 μg/mL and interpretation criteria ≤ 2; S, 4–8; I and ≥ 16; R μg/mL, Liofilchem SRL, Roseto degli Abruzzi, Italy) were used in this study in concordance with the manufacturer’s recommendations.
4. Determination of resistant phenotypes
The resistant phenotypes were identified through the double disk test with erythromycin (ERY; 15 μg), and clindamycin (C; 2 μg) disks applied 20 mm apart. After an incubation period of 24 hours at 35°C, a flattening inhibition zone adjacent to the ERY disk indicating an inducible type (D-shaped zone) of MLSB resistance (IR), while resistance to both ERY and C was referred to as a constitutive type (CR). The absence of a D-shaped zone in ERY resistant and C-susceptible strains were construed as the M/MSB efflux phenotype.
5. Molecular detection of resistance genes
Both M-PCR reactions were performed in a PCR instrument mastercycler gradient (Eppendorf, Hamburg, Germany) for detection of ermA, ermB, ermC, msrA, msrB, ereA, and ereB genes. Cellular DNA was obtained from MRSA isolates using a genomic DNA purification kit (Promega, Madison, Wisconsin, United States) according to the manufacturer’s instructions. Appropriate primers for two M-PCR reactions, each targeting 4 different regions, and product size are listed in Table 1. The first set (S1) of M-PCR primers was designed to identify the mecA, ermA and ereB genes, and the second set (S2) for ermB, ermC, msrA, msrB, ereA genes. Both M-PCR reactions were done under the same conditions as follows: the total volume of the reaction mixture was 25 μL, including; DNA template (1 μL), 10× PCR buffer (1.8 μL), MgCl2 (50 mM; 0.7 μL), dNTPs (10 mM; 0.7 μL), forward/reverse primers (0.5 μL of each primer), Taq DNA polymerase (5 U/μL; 0.7 μL) (Amplicon Co., Denmark) and ddH2O (13.1 μL). The reaction conditions were started by a denaturation phase (95°C for 60 seconds), 33 cycles of denaturation for 45 seconds at 94°C, annealing for 30 seconds at 55°C and extension for 60 seconds at 72°C, and ended with a final extension phase (5 minutes at 72°C). PCR amplicons were examined by electrophoresis in 1.5% agarose gels (Sigma-Aldrich, United States) stained with ethidium bromide. Positive and negative controls were incorporated with each reaction.
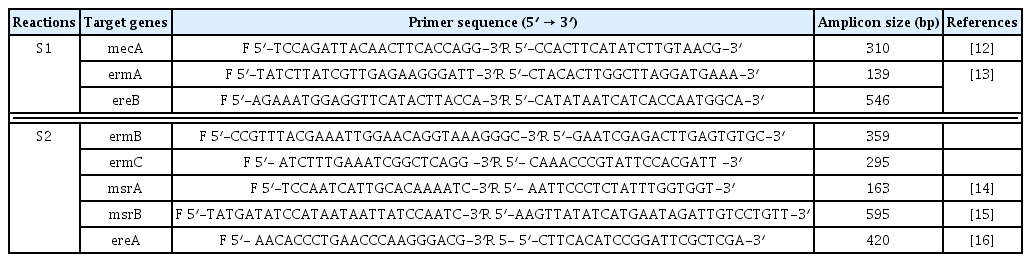
The primer sequences used in the PCR reactions.
6. Statistical analysis
Data were analyzed with Minitab 16 Statistical Software (Minitab Inc., State College, PA, USA). p-value and confidence intervals were < 0.05 and 95%, respectively.
Results
During a 15-month study period, a total of 106 FOX-resistant and MRSA isolates were obtained from various clinical samples including, wound (n = 37, 34.9%), pus (n = 25, 23.5%), blood (n = 21, 19.8%), bronchoalveolar lavage (n = 9, 8.2%), sputum (n = 6, 5.6%), intratracheal tube (n = 4, 3.7%), synovial fluid (n = 3, 2.8%) and cerebrospinal fluid (CSF) (n = 1, 0.9%). The frequency of MRSA isolates based on hospital ward distribution were internal medicine (n = 32), surgery (n = 23), pulmonary (n = 15), pediatrics (n = 12), NICU (N = 10), adult ICU (n = 8), orthopedics (n = 3), ENT (n = 2) and ophthalmology (n = 1). Each isolate was screened to detect the resistance to 12 antimicrobials. The resistance rates to ERY, CC, GM, CP, TE, AM, MUP, RA and SXT were 80.2%, 68.8%, 90.6%, 79.2%, 79.2%, 87.7%, 13.2%, 11.3%, and 66.9%, respectively. All isolates were susceptible to VA and LNZ. The highest susceptibility rates were related to MUP (86.7%) and RA (88.6%) (Table 2). All isolates that were resistant to FOX were considered as MRSA, phenotypically and confirmed by amplification of the mecA-gene by PCR. Furthermore, double disk diffusion test results revealed that 61 (57.5%) of the isolates were resistant to both CC and ERY of which, 48 (78.7%) strains had 4 different resistance phenotypes, of which 27 (56.2%) isolates had the resistant phenotype to cMLSB (resistant to both ERY and CC), 11 (22.9%) isolates had the resistant phenotype to inducible resistance MLSB (iMLSB; resistant to ERY and susceptible to CC), 8 (16.6%) isolates had the MS resistance phenotype (susceptible to ERY and resistant to CC) and finally, 2 (4.2%) isolates were susceptible to ERY and resistant to CC (Figure 1). Of 11 isolates that had the iMLSB resistant phenotype, ermC was positive in 81.8% (n = 9), ermB in 63.6% (n = 7), ermA in 54.5% (n = 6), and ereA in 18.2% (n = 2) of isolates, and out of these, ermA/B/C were co-present in 36.4% (n = 4). One iMLSB-resistant phenotype (9.1%) carried all of the ermA/B/C and ereA genes (Table 3). None of the isolates tested were negative for ereB, msrA and msrB genes. Therefore, 18.2% (n = 2) isolates with iMLSB phenotypes did not have any tested genes.

Antibiotic resistance profile of the isolates tested.

D-shape zone of growth inhibition around C disk (iMLSB resistance phenotype).

Presence of the erm (A, B, C), msr (A, B) and ere (A, B) genes.
In isolates with the cMLSB phenotype, the prevalence of ermA, ermB, ermC, msrA, msrB, ereA and ereB were 7 (25.9%), 5 (18.5%), 12 (44.4%), 0 (0.0%), 0 (0.0%), 3 (11.1%) and 0 (0.0%), respectively. Of the 27 cMLSB strains, 6 (22.2%), 4 (14.8%), 1 (3.7%) and 1 (3.7%) were positive for ermA/ermC, ermA/ermB/ermC, ermA/ermB and ermC/ereA, respectively. In the MS phenotype, ermA, ermB and ermC genes were found in 1 (12.5%), 0 (0.0%) and 3 (37.5%) strains, respectively. Other resistance genes were not found in this phenotype (Figures 2 and 3).
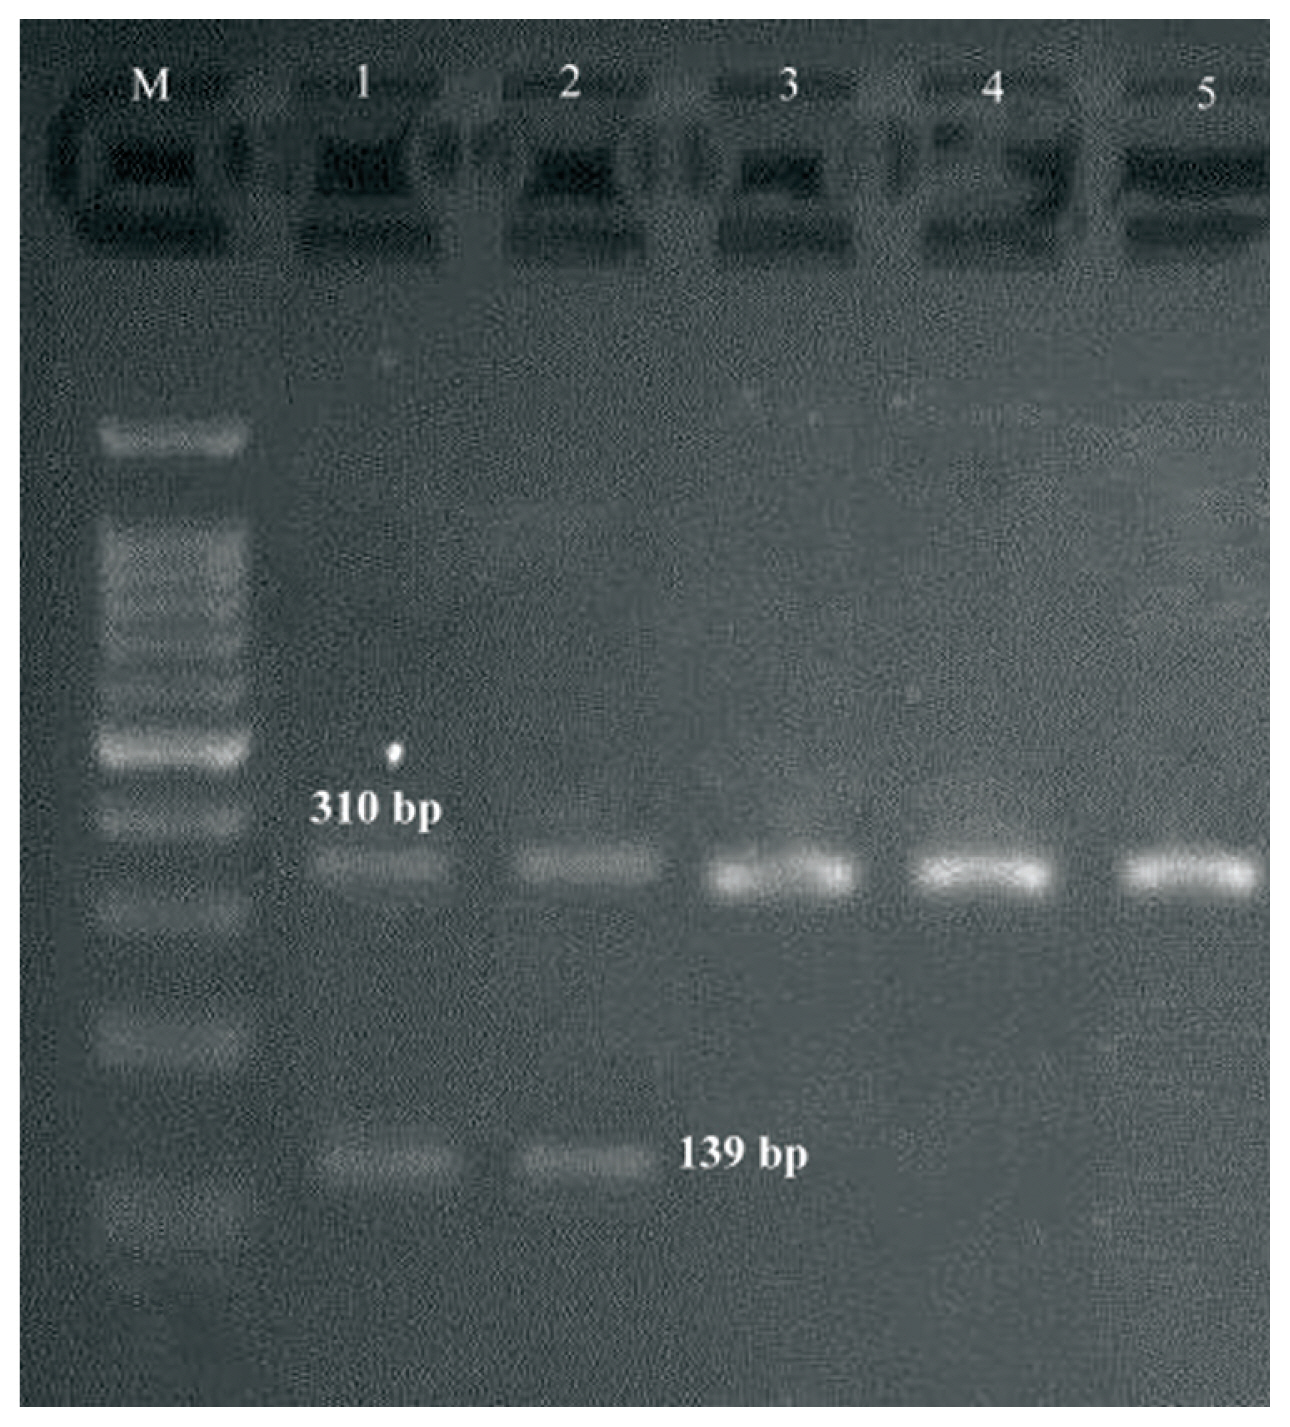
multiplex PCR gel showing of studied S1 genes in Staphylococcus aureus isolates, Lane M: DNA ladder 100 bp, Lanes 1–5: clinical samples.
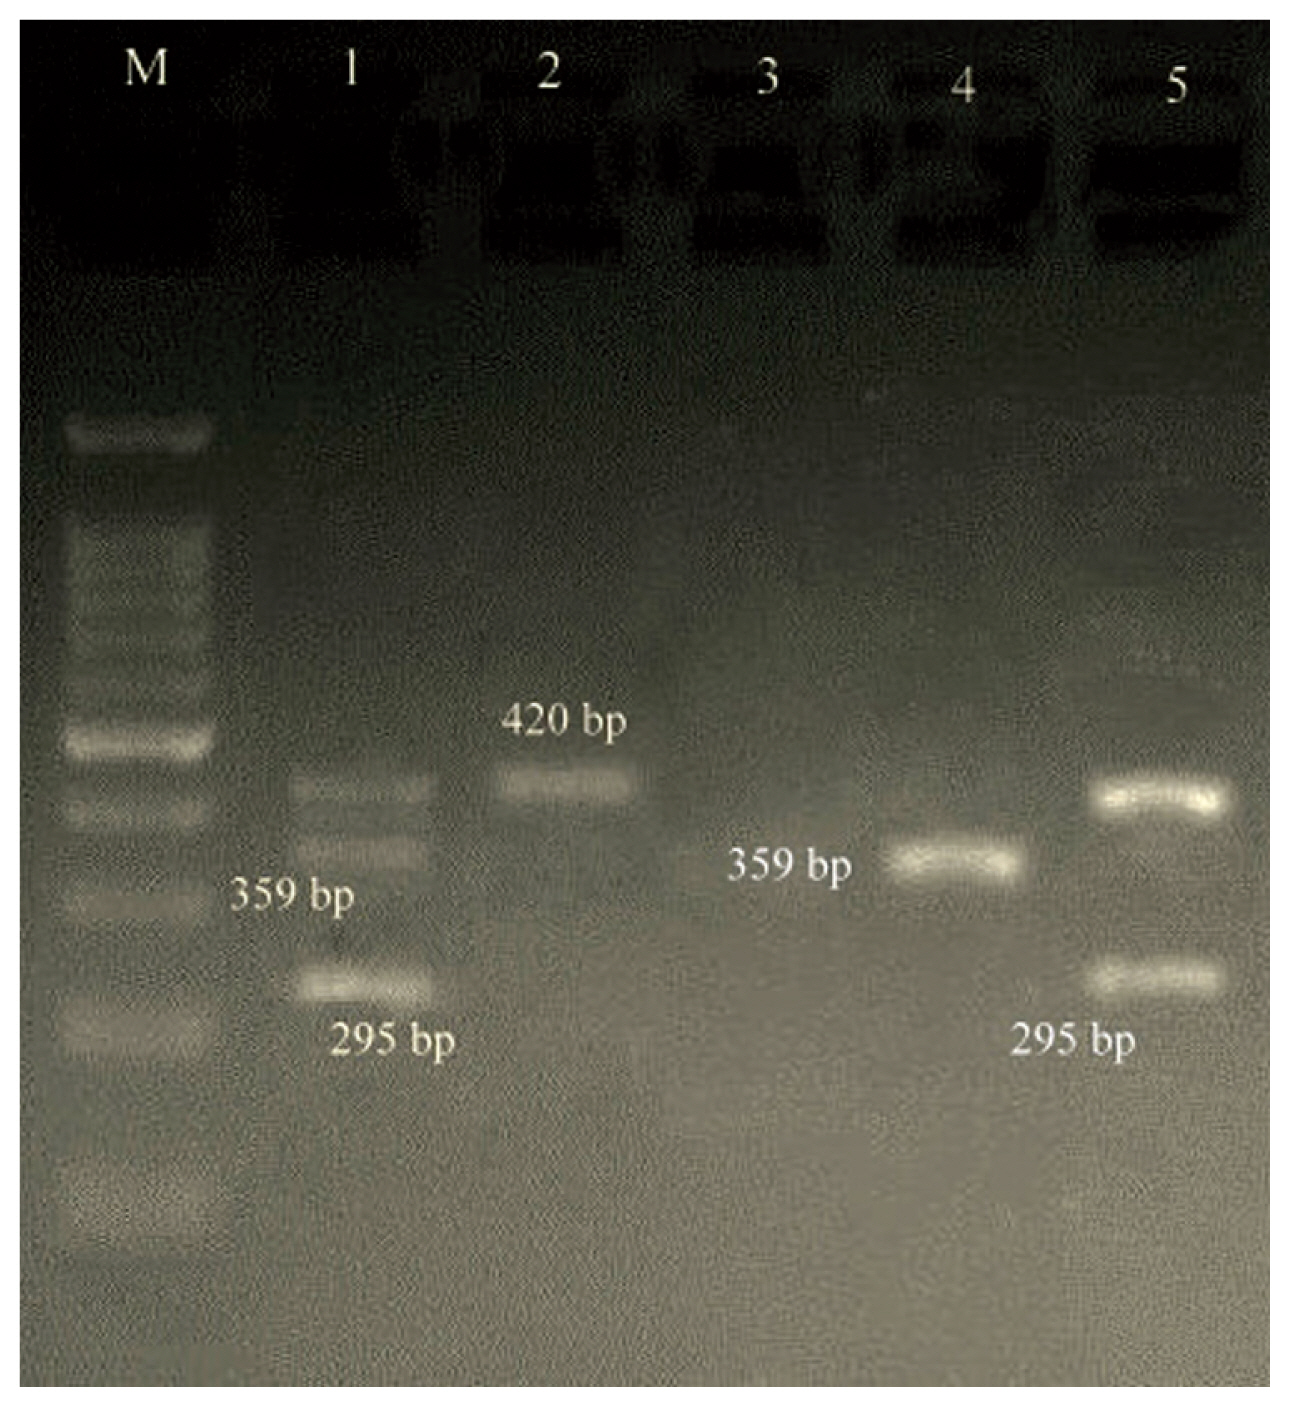
multiplex PCR gel showing of studied S2 genes in Staphylococcus aureus isolates, Lane M: DNA ladder 100 bp, Lanes 1–5: clinical samples.
Discussion
During the last decade, therapeutic drug failure has emerged due to abuse, overuse, and misappropriation of antimicrobial agents. Clindamycin is commonly used to treat skin/soft tissue infections, bone and joint infections because of its tolerability, price, low side effects, oral form, and good tissue penetration. There have been several reports on clindamycin or lincomycin therapy in severe infections due to Staphylococci with inducible MLSB resistance [17–19]. Infections due to MRSA are significant causes of mortality and morbidity across the world [20]. The highest and lowest frequency of samples were collected in order from the wound and CSF. In addition, the highest antibiotic resistance rate was associated with GM (90.6%), and the lowest was RA (11.3%). All isolates were susceptible to VA and LNZ. Therefore, these antimicrobials are the most effective anti-Staphylococcal agent in our study. These data are similar to studies performed by Japoni et al [21], Ghosh et al [11] and Pournajaf et al [22].
The D-test is easy to perform and interpret, reproducible, and low-cost, but still not commonly used. D-test results of our study demonstrated that 61 (57.5%) isolates were sensitive to both ERY and CC; the frequency of cMLSB, iMLSB, and MS resistance phenotypes were found to be 27 (56.2%), 11 (22.9%), and 8 (16.6%), respectively. These results were similar to studies performed by Aktas et al [23] and Seifi et al [24], but in contrast to Ghanbari et al [13], Moosavian et al [25], Rahbar et al [26], and Jethwani et al [27]. These conflicts may be related to the prevalence of isolates with inducible resistance that can be dependent on geographic region, arbitrary use of antibiotics by patients, patient’s age, species of bacteria, patient group, hospital wards, origin of samples and source of the strains like community or nosocomial. The frequency of inducible rates was also dissimilar from one hospital to another and even among patients [25,28]. In the current study and in accordance with Mahesh et al [28], the frequency of the cMLSB resistance phenotype was higher than iMLSB. In contrast, Reddy and Suresh found the frequency of the iMLSB phenotype to be higher than the cMLSB phenotype [29]. The treatment of Staphylococcal infection with resistant strains to iMLSB can lead to the development of cMLSB and failure in CC therapy, therefore detection of resistant strains to iMLSB is more important than detecting other resistant phenotypes. Since, the occurrence of cMLSB, iMLSB, and MS phenotypes vary in different geographical areas, even among different hospitals, awareness of the regional frequency of MLSB resistant isolates is important for microbiology laboratories to determine whether to perform the D-zone test routinely, or the reporting of all ERY-resistant S. aureus as CC-resistant [29]. As revealed in Table 3, the most widespread resistance gene was ermC (n = 24/46; 52.2%), followed by ermA (n = 14/46; 30.4%) and ermB (n = 12/46; 26.1%). Less common was ereA occurring in 10.8% (n = 5/46) of the ERY-resistant MRSA isolates tested. The ereB, msrA and msrB genes were not identified in any of the isolates. The prevalence of ermC and ermA in the present study were similar to the studies performed by Moosavian et al (ermC; 60.3% and ermA; 54.8%) [25] and Saderi et al (ermC; 41.1% and ermA; 17.7%) [30]. In concordance with our results, Cetin et al [4], Schmitz et al [31], and Westh et al [32] showed that ermA and ermC genes were associated with the majority of resistance to ERY among the MRSA. In contrast to Schmitz et al [31], the frequency of ermA and ermC genes was 88% and 47%, respectively. These results agree with Aktas et al [23] among the ERY-resistant MRSA collection, as ermC was predominant in strains expressing a cMLSB (n = 12; 44.4%) and iMLSB (n = 9; 81.8%) phenotype.
Out of the 106 isolates in our study, it was interesting that the ereA gene was present in all 5 (10.8%) strains with a resistant phenotype [(cMLSB; 3 (11.1%), iMLSB; 2 (18.2%)]. In contrast with our results, Schmitz et al [31] analyzed 851 clinical isolates of S. aureus, and showed that the ereA gene was not detected. In addition, the ereB gene was only found in an isolate with a cMLSB phenotype (1.0%). We detected no MRSA with msrA and msrB resistance mechanisms. In contrast to our data, resistance to macrolides via efflux (msrA/msrB genes) was only found in MSSA (n = 14/358; 13%) by Schmitz et al [31], but Lina et al [33] showed the presence of msrA/msrB in both MSSA and MRSA isolates. A notable finding of the present study was that 1 (9.1%) isolate carried all of the ermA/B/C and ereA genes. The prevalence of ermA/C was 13.1% (n = 6) in our isolates. Nikbakht et al [34] showed the simultaneous presence of ermA and ermC in a significant number (n = 39/215, 18.14%) of their isolates. Since strains with inducible resistance may mutate and alter to constitutive resistance, laboratories must correctly identify C susceptibility using the D-zone method for eliminating inducible C resistance. CMLSB was the most frequently encountered phenotypic pattern, with erm (C) being the most prevalent gene, and erm (A, C) the most frequent gene combination. This prevalence is perhaps due to the spread of distinctive clones (which carry ermC and ermA genes) in our area. In agreement with Siberry et al [35], the proportion of S. aureus with in vitro inducible clindamycin resistance (iCR) may differ by age group, region, and methicillin susceptibility. We emphasize that clinical laboratories should report in vitro iCR in S. aureus strains and that physicians should be alert of the potential for antimicrobial therapeutic failure when clindamycin is used to treat serious illnesses due to MRSA with in vitro iCR.
Acknowledgments
We would like to give our appreciation to the staff of the microbiology laboratory of Shariati, Imam Khomeini, and Children’s Medical Center hospitals for collecting samples and assisting in conducting this research.
Notes
Conflicts of Interest
The authors declare that they have no conflicts of interest.