Articles
- Page Path
- HOME > Osong Public Health Res Perspect > Volume 9(4); 2018 > Article
-
Original Article
Regional Differences of Mental Health Status and Associated Factors: Based on the Community Health Survey - Ji Hye Lim
-
Osong Public Health and Research Perspectives 2018;9(4):175-184.
DOI: https://doi.org/10.24171/j.phrp.2018.9.4.06
Published online: August 31, 2018
Department of Healthcare Management, College of Health Science, Youngsan University, Yangsan, Korea
- *Corresponding author: Ji Hye Lim, Department of Healthcare Management, College of Health Science, Youngsan University, Yangsan, Korea, E-mail: limjiart@ysu.ac.kr
• Received: July 2, 2018 • Revised: July 18, 2018 • Accepted: July 19, 2018
Copyright ©2018, Korea Centers for Disease Control and Prevention
This is an open access article under the CC BY-NC-ND license (http://creativecommons.org/licenses/by-nc-nd/4.0/)
Abstract
-
Objectives
- The aim of this study was to determine whether there were differences in mental health specific to regions in Korea, and the factors that affected mental health status.
-
Methods
- Data from the 2016 Community Health Survey in Korea were used; 224,421 health survey participants provided responses on mental health issues, demographics, and health behavior, and were included in the study.
-
Results
- A statistically significant difference was observed in the incidence of mental health status between different regions of Korea. Independent variables that affected mental health were sex, age, marital status, household income, economic activity, whether living with dementia patients, self-reported health status, smoking, alcohol drinking, sleep time, and chronic diseases. Risk factors associated with symptoms of depression were gender (female), bereavement or being divorced, low household income, family member with dementia, poor self-reported health status, currently smoking, level of physical activity, insufficient hours of sleep and suffering from chronic diseases.
-
Conclusion
- This study suggests that a standardized healthcare policy is needed to reduce regional variation in mental health. In the future, similar studies that include medical expenses for mental healthcare and relevant variables according to regions of Korea should be conducted.
- Keywords: community; depression; health survey; mental health; region
- Mental illness is known to be the cause of major health problems worldwide [1]. Recently, Korea has experienced rapid economic development and urbanization, and in the process, it is faced with dysfunctional problems such as increased mental illness and high risk of suicide [2]. National policies have been established to raise awareness of strategies for managing chronic disease. However, mental disorders are not only seen as an individual problem, but also a social issue, which needs to be recognized and taken seriously.
- The most common mental disorder is depression, a disease that affects an individual’s social and physical well-being which compounds any chronic diseases. Moreover, it exerts a negative influence on family relationships and the patients social life, decreasing their quality of life. Depression is a serious disease that can lead to suicide in 10% to 15% of patients [3,4].
- Mental health conditions depend on many factors, not only do they include socioeconomic factors, region, and health behaviors, but also ecological environmental factors [5–7]. Recently, several studies have reported the prevalence of depressive symptoms in the Korean population. In 1998, Cho et al used the Center for Epidemiologic Studies Depression Scale (a self-reporting instrument), to report the nationwide prevalence of depression in Korea [8]. Since 2001, Korea has been conducting epidemiological studies of mental illness every 5 years, and the prevalence of major depressive disorders has been reported to be increasing steadily (2001, 4.0%; 2006, 5.6%; 2011, 6.7%) [8–10]. According to previous studies, many health-related indicators including prevalence rate of mental disorders, showed differences between regions in their countries [11,12]. Hipp et al [12] reported that the prevalence of diabetes showed county-level differences in the USA. Kovess et al [11] reported that prevalence of depression in residents of rural Canada was lower than in urban residents, even after controlling for variables such as gender, age, marital status, education, occupation, etc.
- However, most previous studies related to mental disorder were conducted within a specific age group and region. To date there are only a few studies related to stress or subjective mental health outcomes according to regions, in a representative community sample. The health level of the population group has importance epidemiologically, and it is possible to be more effective at managing the cause of the differences in the distribution of health status when accessed at the community level.
- This study aimed to analyze the regional differences of mental health status and associated factors in Korea using Community Health Survey (CHS) data. The results from this study may provide significant data that could aid the development of regional and national mental health policy design.
Introduction
- The data used in this study was taken from the 2016 CHS, performed by the Korea Center for Disease Control and Prevention. The CHS is an annual, national health survey (conducted since 2008), to provide national-level health indicators of adults aged 19 years or older [13]. The purpose of the CHS is to assess health status, and related behavior determinants in the Korean population, to produce community-based comparable health statistics [14].
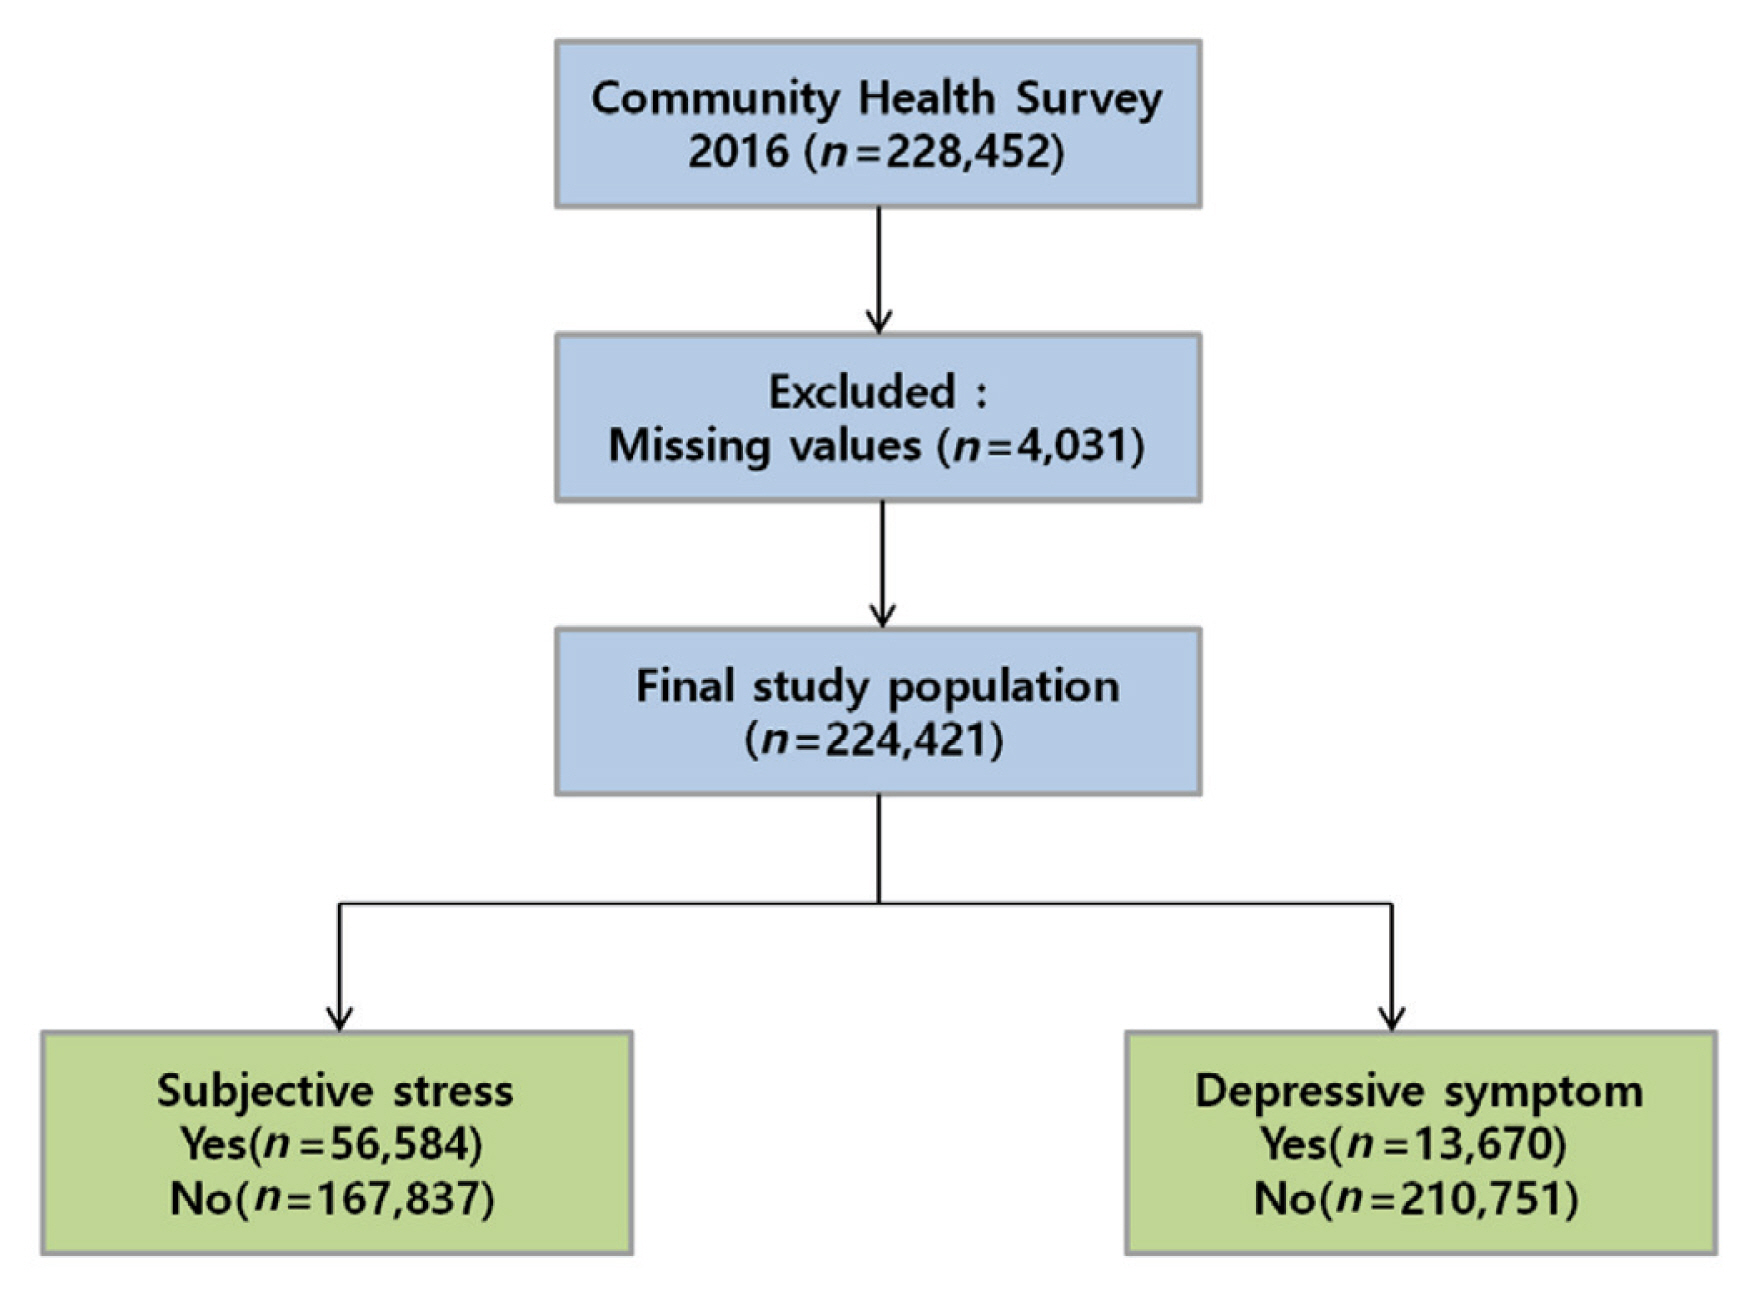
- A total of 228,452 participants took part in the 2016 CHS. Of those, 4,031 participants were excluded from this study because relevant information was not provided such as mental health status. Therefore, 224,421 participants aged 19 years or older were included in the study population (Figure 1).
- For the assessment of mental health status, this study selected a “subjective stress perception” variable and a “depressive symptom experience” variable. Subjective stress perception was determined using the question, “How much stress do you usually feel during daily life?” When participants answered “a lot” they were grouped into “yes” for the subjective stress perception group. Experience of depressive symptoms was determined using the question, “Have you ever felt sadness or despair for more than 2 consecutive weeks, in the last year?” When participants answered “yes”, they were grouped into the “having experienced depression” group. The independent variables were demographic and personal characteristics such as gender, age, religion, marital status, education, household income, economic activity, and whether a family member has dementia. Age groups were categorized into 19–29, 30–39, 40–49, 50–59, 60–69, and ≥ 70 years. Household income was determined as monthly household income, and categorized into < 2.0 million, 2.0–4.0 million, and ≥ 4.0 million Korean won groups. Marital status was categorized into, “with a spouse,” “bereaved or divorced,” and “single (i.e. alone).” Region of residence as a variable was divided into urban or rural. Lifestyle and health status related variables included a self-reported status of health, smoking, alcohol consumption, physical activity, hours of sleep, and medically diagnosed chronic disease. Chronic diseases included hypertension, diabetes mellitus, dyslipidemia, stroke, coronary heart disease, arthritis, and osteoporosis which were diagnosed by a medical doctor. The self-reported health status was classified as good, moderate, or poor. Smoking status was classified as non-smoker, currently smoking, or former smoker. Hours of sleep was classified into less than 6 hours a day, 6–7 hours, ≥ 8 hours. Physical activity was categorized as 0 day, 1–2 days, or ≥ 3 days per week. Physical activity was defined as ≥ 10 minutes of vigorous physical activity which involved breathing very fast or faster than usual.
- This study protocol was reviewed and approved by the Institutional Review Board of Youngsan University (YSUIRB-201804-HR-037-02).
- Data were analyzed using the IBM SPSS program version 24.0 (IBM Co., Armonk, NY, USA). Frequencies and percentages as descriptive statistics were used to examine the regional distribution of the mental health status. To observe the differences in mental health status according to general characteristics, lifestyle, and health status characteristics, Chi-square analysis was conducted. Logistic regression analysis was also carried out to examine the factors that affect mental health status. The model’s goodness of fit was evaluated using the Hosmer-Lemeshow test. Statistical significance was reached when p < 0.05.
Materials and Methods
- Table 1 shows the distribution of mental health status across 17 regions in Korea. The number of participants in the study population with subjective stress perception was the highest in Daejeon province (30.5%), followed by Seoul (28.3%), Gyeonggi (28.3%), Incheon (27.7%), and Gwangju (27.5%). The number of participants experiencing depressive symptoms was highest in Incheon province (7.9%), followed by Chungnam (7.8%), Daejeon (7.5%), Seoul (7.0%) and Gyeonggi (6.6%). A statistically significant difference was observed in mental health status according to region [p < 0.05 (Table 1)].
- Table 2 shows mental health status based on demographics and personal characteristics. The level of subjective stress perception was significantly higher in females, aged 30 to 39 years, with high educational attainment (college level or higher). Moreover, individuals who were single, also had a high level of subjective stress. People who lived in an urban region and those with dementia in the family, and with higher household income (≥ 4.0 million Korean won), also experienced a high level of subjective stress. The number of participants experiencing depressive symptoms was significantly high in females, ≥ 70 years, with low educational attainment (less than elementary education). The data revealed that experience of depressive symptoms was higher in participants who were either bereaved or divorced (10.1%), compared with those who lived with their spouses (5.1%) or those who were single (6.2%). People who lived in urban regions and those with dementia in the family, and those with the lowest household income (< 2.0 million Korean won), also experienced a high rate of depressive symptoms (Table 2).
- Table 3 shows the difference in mental health status based on lifestyle and health status. The levels of subjective stress according to self-reported health status, smoking, alcohol consumption, physical activity, hours of sleep, and chronic disease (diabetes excluded) were significantly different (p < 0.05). The level of subjective stress was the highest in participants who reported a poor health status (35.5%). The level of subjective stress in those who currently smoked was 32.5%, which was significantly higher than former smokers (20.9%). The level of subjective stress was highest when the hours of sleep were ≤ 6 hours (35.6%). Compared to non-drinkers, the level of subjective stress was highest in those that drink alcohol. The level of subjective stress was highest in participants who had dyslipidemia, stroke, coronary heart disease, arthritis and osteoporosis, compared with participants who had no history of chronic disease. The levels of those experiencing symptoms of depression according to self-reported health status, smoking, alcohol consumption, physical activity, hours of sleep, chronic disease were significantly different (p < 0.05). The level of those experiencing symptoms of depression was the highest in those who responded that their health status was poor (12.5%). The level of those experiencing symptoms of depression was highest when they had ≤ 6 hours sleep (10.1%). Compared to those that drink alcohol, the level of those experiencing symptoms of depression was highest in the group that did not consume alcohol. The level of those experiencing symptoms of depression was highest in participants who had hypertension, diabetes mellitus, dyslipidemia, stroke, coronary heart disease, arthritis and osteoporosis, compared with those who did not have a chronic disease (Table 3).
- Tables and 5 shows the results of logistic regression analysis that was performed to examine the variables related to mental health status according to urban or rural living. In urban areas, independent variables such as gender, age, marital status, household income, economic activity, a family member with dementia, self-reported health status, smoking, alcohol consumption, hours of sleep, and chronic disease (dyslipidemia, coronary heart disease, arthritis, osteoporosis), affected subjective stress perception (p < 0.05). Participants that were male (OR, 0.75), elderly (aged ≥ 70; OR, 0.25), single (OR, 0.90), with a high household income (OR, 0.83), and sufficient hours of sleep (hours ≥ 8; OR, 0.48) were associated with a low risk of subjective stress perception. Economic activity (OR, 1.45), a family member with dementia (OR, 1.70), poor self-reported health stress (OR, 4.31), currently smoking (OR, 1.73) and alcohol consumption (OR, 1.08), were associated with a high risk of subjective stress perception. Furthermore, those with dyslipidemia (OR, 1.13), coronary heart disease (OR, 1.11), arthritis (OR, 1.15), and osteoporosis (OR, 1.07) had a high risk of subjective stress. In urban areas, independent variables such as gender, age, marital status, household income, economic activity, family member with dementia, self-reported health status, smoking, alcohol consumption, physical activity, hours of sleep, and chronic disease (hypertension, dyslipidemia, stroke, coronary heart disease, arthritis, osteoporosis), affected symptoms of depression (p < 0.05). Male (OR, 0.46), old age (aged ≥ 70; OR, 0.36), high household income (OR, 0.62), economic activity (OR, 0.78) and sufficient number of hours sleep (hours ≥ 8; OR, 0.67) were associated with a low risk of symptoms of depression. Bereaved or divorced (OR, 1.47), a family member with dementia (OR, 1.88), poor self-reported health stress (OR, 4.43), currently smoking (OR, 1.76), alcohol consumption (OR, 1.07) and physical activity (days ≥ 3; OR, 1.33) were associated with a high risk of symptoms of depression. Furthermore, participants with dyslipidemia (OR, 1.20), stroke (OR, 1.48), coronary heart disease (OR, 1.25), arthritis (OR, 1.24), and osteoporosis (OR, 1.10) had a high risk of symptoms of depression (Table 4).
- In rural areas, independent variables, such as gender, age, marital status, economic activity, a family member with dementia, self-reported health status, smoking, alcohol consumption, hours of sleep, and chronic disease (dyslipidemia, stroke, coronary heart disease, arthritis, osteoporosis), affected perception of subjective stress (p < 0.05). Being male (OR, 0.68), elderly (aged ≥70; OR, 0.23), single (OR, 0.84), and having a sufficient number of hours sleep (hours ≥ 8; OR, 0.45) were associated with a low risk of subjective stress perception. Economic activity (OR, 1.14), a family member with dementia (OR, 1.91), poor self-reported health stress (OR, 3.56), currently smoking (OR, 1.80) and consumption of alcohol (OR, 1.05) were associated with a high risk of perceived subjective stress. Furthermore, participants with dyslipidemia (OR, 1.12), stroke (OR, 1.31), coronary heart disease (OR, 1.14), arthritis (OR, 1.19), and osteoporosis (OR, 1.15) had a high risk of perceived subjective stress. In rural areas, independent variables, such as gender, age, marital status, household income, economic activity, a family member with dementia, self-reported health status, smoking, physical activity, sleep hours, and presence of chronic disease (hypertension, dyslipidemia, stroke, coronary heart disease, arthritis, osteoporosis), affected depressive symptom (p < 0.05). Being a male (OR, 0.52), in old age (aged ≥ 70; OR, 0.31), with a high household income (OR, 0.69), being economically active (OR, 0.63) and having a sufficient number of hours sleep (hours ≥ 8; OR, 0.58) were associated with a low risk of depressive symptoms. Bereaved or divorced (OR, 1.34), a family member with dementia (OR, 2.14), self-reported health described as poor (OR, 3.70), currently smoking (OR, 1.74), and physical activity of 1–2 days per week (OR, 1.37) were associated with a high risk of depressive symptom. Furthermore, participants with dyslipidemia (OR, 1.20), stroke (OR, 1.69), coronary heart disease (OR, 1.36), arthritis (OR, 1.24), and osteoporosis (OR, 1.13) had a high risk of depressive symptoms (Table 5).
Results
- This study was designed to determine the regional differences in mental health and associated factors, using the nationwide CHS data. The level of perceived subjective stress in Korean adults was 25.2% and the level of depressive symptoms was 6.1%. These findings were similar to a report in the USA National Health and Nutrition Examination Survey where data was collected from 2005 to 2008, and reported that the prevalence of depressive symptoms amongst US adults was 6.8% [15].
- The results from this current study showed that individuals who lived in urban areas had a poorer mental health status compared with those who lived in rural areas. Also, a statistically significant difference was observed in the mental health status in 17 regions of Korea. This result is consistent with a previous study that showed that the prevalence of mental diseases was different between regions according to the level of urbanization [16,17]. Other studies have reported that psychosocial changes due to urbanization can become a factor that elevates stress and deteriorates mental health of rural residents [16,17].
- Logistic analysis in this study was used to test factors related to mental health including gender, age, marital status, household income, economic activity, whether living with a dementia patient, self-reported health status, smoking, alcohol consumption, hours of sleep, and chronic diseases, etc. however, there was little difference observed. Odds ratio and factors related to perception of subjective stress and experience of depression symptoms were region (urban versus rural area) dependent. This finding implies that different mental health policies and approaches should be considered for each risk population by region.
- Risk factors associated with depression symptoms were being female, bereaved or divorced, low household income, family member with dementia, self-reported health status as poor, currently smoking, physical activity, insufficient number of hours sleep and chronic diseases. These results are similar to those of previous cohort studies of Koreans that suggested that divorce or bereavement, single, chronic illness, and smoking were risk factors for depression [9,10]. In general, epidemiological studies reported that chronic diseases were associated with depression [18]. In addition, the prevalence of depression was found to increase significantly in cases of a poor perception of subjective health status [19].
- In previous studies, adverse mental health effects were observed for smoking, and people who currently smoked were more likely to experience depressive symptoms [20–22]. In addition, adverse mental health effects have been associated with less than 6 hours of sleep per day. Hashizume et al [23], emphasized the importance of achieving sufficient hours of sleep, because lack of sleep can cause impaired cognitive function, and mental disorders such as depression.
- There were several limitations in this study. Firstly, a cross-sectional design was used, thus, it was not possible to establish causal relationships between mental health and other variables. Secondly, the factors affecting mental health were not distinguished across the 17 regions. Thirdly, this study lacks variables for regional characteristics and environments to investigate the impact of regional differences on mental health. In the future, studies that include medical expenses of mental health diseases and relevant variables according to provinces should be conducted. This study suggests the establishment of a healthcare policy that reduces the variation of mental health by region. These results can be used to develop an effective nationwide program for mental health policies.
Discussion
-
Acknowledgements
- This work was supported by the Research Grant of Youngsan University in 2018.
Acknowledgments
-
Conflicts of Interest
The author declares that they have no conflicts of interest.
Article information
- 1. Ferrari AJ, Charlson FJ, Norman RE, et al. Burden of depressive disorders by country, sex, age, and year: findings from the global burden of disease study 2010. PLoS Med 2013;Nov;10(11). e1001547PMID: 10.1371/journal.pmed.1001547. PMID: 24223526. PMID: 3818162.ArticlePubMedPMC
- 2. Park JE, Lee JY, Jeon HJ, et al. Age-related differences in the influence of major mental disorders on suicidality: a Korean nationwide community sample. J Affect Disord 2014;Jun;162:96−101. PMID: 10.1016/j.jad.2014.03.012. PMID: 24767012.ArticlePubMed
- 3. Wells KB, Stewart A, Hays RD, et al. The functioning and well-being of depressed patients. Results from the Medical Outcomes Study. JAMA 1989;Aug 18 262(7). 914−9. PMID: 10.1001/jama.1989.03430070062031. PMID: 2754791.ArticlePubMed
- 4. Levav I, Rutz W. The WHO World Health Report 2001 new understanding--new hope. Isr J Psychiatry Relat Sci 2002;39(1). 50−6. PMID: 12013710.PubMed
- 5. Barua A, Ghosh MK, Kar N, et al. Socio-demographic Factors of Geriatric Depression. Indian J Psychol Med 2010;Jul;32(2). 87−92. PMID: 10.4103/0253-7176.78503.ArticlePubMedPMC
- 6. Chong MY, Tsang HY, Chen CS, et al. Community study of depression in old age in Taiwan: prevalence, life events and socio-demographic correlates. Br J Psychiatry 2001;Jan;178(1). 29−35. PMID: 10.1192/bjp.178.1.29. PMID: 11136207.ArticlePubMed
- 7. Hoebel J, Maske UE, Zeeb H, et al. Social Inequalities and Depressive Symptoms in Adults: The Role of Objective and Subjective Socioeconomic Status. PLoS One 2017;12(1). e0169764PMID: 10.1371/journal.pone.0169764. PMID: 28107456. PMID: 5249164.ArticlePubMedPMC
- 8. Cho MJ, Nam JJ, Suh GH. Prevalence of symptoms of depression in a nationwide sample of Korean adults. Psychiatry Res 1998;Dec 14 81(3). 341−52. PMID: 10.1016/S0165-1781(98)00122-X.ArticlePubMed
- 9. Shin C, Kim Y, Park S, et al. Prevalence and Associated Factors of Depression in General Population of Korea: Results from the Korea National Health and Nutrition Examination Survey, 2014. J Korean Med Sci 2017;Nov;32(11). 1861−9. PMID: 10.3346/jkms.2017.32.11.1861. PMID: 28960042. PMID: 5639070.ArticlePubMedPMC
- 10. Cho MJ, Seong SJ, Park JE, et al. Prevalence and Correlates of DSM-IV Mental Disorders in South Korean Adults: The Korean Epidemiologic Catchment Area Study 2011. Psychiatry Investig 2015;Apr;12(2). 164−70. PMID: 10.4306/pi.2015.12.2.164. PMID: 25866515. PMID: 4390585.ArticlePubMedPMC
- 11. Kovess V, Murphy HB, Tousignant M. Urban-rural comparisons of depressive disorders in French Canada. J Nerv Ment Dis 1987;Aug;175(8). 457−66. PMID: 10.1097/00005053-198708000-00003. PMID: 3498009.ArticlePubMed
- 12. Hipp JA, Chalise N. Spatial analysis and correlates of county-level diabetes prevalence, 2009–2010. Prev Chronic Dis 2015;Jan 22 12:140404PMID: 10.5888/pcd12.140404.Article
- 13. Choi EJ, Kim SA, Kim NR, et al. Risk factors for falls in older Korean adults: the 2011 Community Health Survey. J Korean Med Sci 2014;Nov;29(11). 1482−7. PMID: 10.3346/jkms.2014.29.11.1482. PMID: 25408578. PMID: 4234914.ArticlePubMedPMC
- 14. Kim J, Kim H. Demographic and Environmental Factors Associated with Mental Health: A Cross-Sectional Study. Int J Environ Res Public Health 2017;Apr 17 14(4). E431PMID: 10.3390/ijerph14040431. PMID: 28420189. PMID: 5409632.Article
- 15. Leggott PJ. Oral complications of cancer therapies. Oral complications in the pediatric population. NCI Monogr 1990;(9). 129−32. PMID: 2188150.PubMed
- 16. Peen J, Schoevers RA, Beekman AT, et al. The current status of urban-rural differences in psychiatric disorders. Acta Psychiatr Scand 2010;Feb;121(2). 84−93. PMID: 10.1111/j.1600-0447.2009.01438.x.ArticlePubMed
- 17. Dekker J, Peen J, Koelen J, et al. Psychiatric disorders and urbanization in Germany. BMC Public Health 2008;Jan 17 8:17PMID: 10.1186/1471-2458-8-17. PMID: 18201380. PMID: 2266738.ArticlePubMedPMCPDF
- 18. Moussavi S, Chatterji S, Verdes E, et al. Depression, chronic diseases, and decrements in health: results from the World Health Surveys. Lancet 2007;Sep 8 370(9590). 851−8. PMID: 10.1016/S0140-6736(07)61415-9. PMID: 17826170.ArticlePubMed
- 19. Ohayon MM, Hong SC. Prevalence of major depressive disorder in the general population of South Korea. J Psychiatr Res 2006;Feb;40(1). 30−6. PMID: 10.1016/j.jpsychires.2005.02.003.ArticlePubMed
- 20. Buser MC, Scinicariello F. Cadmium, Lead, and Depressive Symptoms: Analysis of National Health and Nutrition Examination Survey 2011–2012. J Clin Psychiatry 2017;May;78(5). e515−21. PMID: 10.4088/JCP.15m10383.ArticlePubMedPMC
- 21. Weinberger AH, Kashan RS, Shpigel DM, et al. Depression and cigarette smoking behavior: A critical review of population-based studies. Am J Drug Alcohol Abuse 2017;Jul;43(4). 416−31. PMID: 10.3109/00952990.2016.1171327.ArticlePubMed
- 22. Zale EL, Maisto SA, Ditre JW. Anxiety and Depression in Bidirectional Relations Between Pain and Smoking: Implications for Smoking Cessation. Behav Modif 2016;Jan;40(1–2). 7−28. PMID: 10.1177/0145445515610744. PMID: 4834030.ArticlePubMed
- 23. Hashizume Y. The importance of sleep in the mental health. Nihon Rinsho 2014;Feb;72(2). 341−6. in Japanese. PMID: 24605538.
References
Figure 1Selection process of the study population from the participants of the Community Health Survey, Korea.

Table 1Regional distribution of mental health status in Korea (n = 224,421).
Table 2Differences of mental health status according to demographics and personal characteristics.
| Variable | Subjective stress perception | Depressive symptom experience | ||
|---|---|---|---|---|
| Yes, n (%) | p* | Yes, n (%) | p* | |
| Gender | < 0.001 | < 0.001 | ||
|
|
||||
| Male | 24,576 (24.3) | 4,246 (4.2) | ||
| Female | 32,008 (26.0) | 9,424 (7.7) | ||
|
|
||||
| Age (y) | < 0.001 | < 0.001 | ||
|
|
||||
| 19–29 | 7,520 (30.2) | 1,485 (6.0) | ||
| 30–39 | 10,432 (33.7) | 1,807 (5.8) | ||
| 40–49 | 11,508 (28.5) | 2,044 (5.1) | ||
| 50–59 | 10,533 (23.4) | 2,756 (6.1) | ||
| 60–69 | 7,410 (19.4) | 2,349 (6.2) | ||
| ≥70 | 9,181 (20.4) | 3,229 (7.2) | ||
|
|
||||
| Region | < 0.001 | < 0.001 | ||
|
|
||||
| Urban | 33,903 (26.9) | 7,987 (6.3) | ||
| Rural | 22,681 (23.1) | 5,683 (5.8) | ||
| Marital status | < 0.001 | < 0.001 | ||
| With spouse | 37,137 (24.4) | 7,715 (5.1) | ||
| Bereaved/divorced | 8,899 (23.8) | 3,759 (10.1) | ||
| Single | 10,548 (30.0) | 2,196 (6.2) | ||
|
|
||||
| Education | < 0.001 | < 0.001 | ||
|
|
||||
| Elementary school level or lower | 12,578 (23.0) | 4,334 (7.9) | ||
| Middle school | 5,204 (20.9) | 1,673 (6.7) | ||
| High school | 16,096 (25.3) | 3,714 (5.8) | ||
| College level or higher | 22,706 (28.0) | 3,949 (4.9) | ||
|
|
||||
| Household income (W/mo) | < 0.001 | < 0.001 | ||
|
|
||||
| < 2,000,000 | 20,045 (24.2) | 6,931 (8.4) | ||
| 2,000,000 ~ 4,000,000 | 19,638 (25.5) | 3,888 (5.0) | ||
| ≥ 4,000,000 | 16,901 (26.2) | 2,851 (4.4) | ||
|
|
||||
| Economic activity | < 0.001 | < 0.001 | ||
|
|
||||
| Yes | 38,112 (26.7) | 6,775 (4.7) | ||
| No | 18,472 (22.6) | 6,895 (8.5) | ||
|
|
||||
| Family member with dementia | < 0.001 | < 0.001 | ||
|
|
||||
| Yes | 895 (35.5) | 315 (12.5) | ||
| No | 55,689 (25.1) | 13,355 (6.0) | ||
|
|
||||
| Total | 56,584 (25.2) | 13,670 (6.1) | ||
Table 3Differences in mental health status according to lifestyle and health characteristics.
| Variable | Subjective stress perception | Depressive symptom experience | ||
|---|---|---|---|---|
| Yes, n (%) | p* | Yes, n (%) | p* | |
| Self-reported health status | < 0.001 | < 0.001 | ||
|
|
||||
| Good | 15,628 (19.0) | 2,539 (3.1) | ||
| Moderate | 24,253 (25.5) | 5,236 (5.5) | ||
| Poor | 16,703 (35.5) | 5,895 (12.5) | ||
|
|
||||
| Smoking status | < 0.001 | < 0.001 | ||
|
|
||||
| Currently smoking | 13,476 (32.5) | 2,597 (6.3) | ||
| Former smoker | 8,709 (20.9) | 1,929 (4.6) | ||
| Non-smoker | 34,399 (24.3) | 9,144 (6.5) | ||
|
|
||||
| Alcohol consumption | < 0.001 | < 0.001 | ||
|
|
||||
| Yes | 39,989 (26.2) | 8,410 (5.5) | ||
| No | 16,595 (23.1) | 5,260 (7.3) | ||
|
|
||||
| Physical activity (d/wk) | < 0.001 | 0.022 | ||
|
|
||||
| 0 | 42,648 (24.8) | 10,590 (6.2) | ||
| 1–2 | 5,736 (27.1) | 1,202 (5.7) | ||
| ≥ 3 | 8,200 (26.4) | 1,878 (6.0) | ||
|
|
||||
| Sleep h (h/d) | < 0.001 | < 0.001 | ||
|
|
||||
| < 6 | 14,492 (35.6) | 4,103 (10.1) | ||
| 6–7 | 32,063 (23.7) | 6,803 (5.0) | ||
| ≥ 8 | 10,029 (20.6) | 2,764 (5.7) | ||
|
|
||||
| Hypertension | < 0.001 | < 0.001 | ||
|
|
||||
| Yes | 13,642 (23.3) | 4,148 (7.1) | ||
| No | 42,942 (25.9) | 9,522 (5.7) | ||
|
|
||||
| Diabetes mellitus | 0.310 | < 0.001 | ||
|
|
||||
| Yes | 5,964 (25.5) | 2,007 (8.6) | ||
| No | 50,620 (25.2) | 11,663 (5.8) | ||
|
|
||||
| Dyslipidemia | < 0.001 | < 0.001 | ||
|
|
||||
| Yes | 9,351 (26.7) | 2,938 (8.4) | ||
| No | 47,233 (24.9) | 10,732 (5.7) | ||
|
|
||||
| Stroke | < 0.001 | < 0.001 | ||
|
|
||||
| Yes | 1,426 (28.7) | 648 (13.0) | ||
| No | 55,158 (25.1) | 13,022 (5.9) | ||
|
|
||||
| Coronary heart disease | < 0.001 | < 0.001 | ||
|
|
||||
| Yes | 2,023 (27.6) | 787 (10.7) | ||
| No | 54,561 (25.1) | 12,883 (5.9) | ||
|
|
||||
| Arthritis | < 0.001 | < 0.001 | ||
|
|
||||
| Yes | 8,326 (27.5) | 3,116 (10.3) | ||
| No | 48,258 (24.9) | 10,554 (5.4) | ||
|
|
||||
| Osteoporosis | < 0.001 | < 0.001 | ||
|
|
||||
| Yes | 5,278 (26.9) | 2,042 (10.4) | ||
| No | 51,306 (25.0) | 11,628 (5.7) | ||
|
|
||||
| Total | 56,584 (25.2) | 13,670 (6.1) | ||
Table 4Factors related to mental health status in urban area.
| Variable | Subjective stress perception | Depressive symptom experience | |||
|---|---|---|---|---|---|
| OR (95% CI) | p* | OR (95% CI) | p* | ||
| Gender | Female | 1 | 1 | ||
| Male | 0.753 (0.724–0.783) | < 0.001 | 0.464 (0.431–0.499) | < 0.001 | |
|
|
|||||
| Age (y) | 19–29 | 1 | 1 | ||
| 30–39 | 0.932 (0.884–0.982) | 0.008 | 0.979 (0.887–1.080) | 0.667 | |
| 40–49 | 0.646 (0.610–0.684) | < 0.001 | 0.771 (0.692–0.860) | < 0.001 | |
| 50–59 | 0.433 (0.406–0.461) | < 0.001 | 0.731 (0.651–0.822) | < 0.001 | |
| 60–69 | 0.288 (0.267–0.310) | < 0.001 | 0.479 (0.419–0.548) | < 0.001 | |
| ≥ 70 | 0.245 (0.225–0.267) | < 0.001 | 0.358 (0.309–0.414) | < 0.001 | |
|
|
|||||
| Marital status | With spouse | 1 | 1 | ||
| Bereaved/divorced | 0.944 (0.903–0.987) | 0.011 | 1.473 (1.379–1.573) | < 0.001 | |
| Single | 0.898 (0.858–0.941) | < 0.001 | 1.196 (1.096–1.304) | < 0.001 | |
|
|
|||||
| Education | ≤ Elementary school | 1 | 1 | ||
| Middle school | 0.899 (0.845–0.957) | 0.001 | 1.120 (1.021–1.229) | 0.016 | |
| High school | 0.987 (0.932–1.044) | 0.645 | 1.055 (0.966–1.152) | 0.234 | |
| College level or higher | 1.054 (0.992–1.120) | 0.087 | 0.995 (0.901–1.098) | 0.914 | |
|
|
|||||
| Household Income (W/mo) | < 2,000,000 | 1 | 1 | ||
| 2,000,000 ~ 4,000,000 | 0.825 (0.794–0.857) | < 0.001 | 0.673 (0.632–0.716) | < 0.001 | |
| ≥ 4,000,000 | 0.830 (0.797–0.864) | < 0.001 | 0.621 (0.579–0.665) | < 0.001 | |
|
|
|||||
| Economic activity | No | 1 | 1 | ||
| Yes | 1.452 (1.406–1.499) | < 0.001 | 0.782 (0.741–0.826) | < 0.001 | |
|
|
|||||
| Family member with dementia | No | 1 | 1 | ||
| Yes | 1.704 (1.509–1.925) | < 0.001 | 1.882 (1.581–2.239) | < 0.001 | |
|
|
|||||
| Self-reported health status | Good | 1 | 1 | ||
| Moderate | 1.715 (1.664–1.767) | < 0.001 | 1.803 (1.695–1.918) | < 0.001 | |
| Poor | 4.314 (4.123–4.514) | <0.001 | 4.427 (4.110–4.768) | < 0.001 | |
|
|
|||||
| Smoking | Non-smoker | 1 | 1 | ||
| Currently smoking | 1.727 (1.654–1.802) | < 0.001 | 1.758 (1.625–1.902) | < 0.001 | |
| Former smoker | 1.195 (1.141–1.252) | < 0.001 | 1.387 (1.272–1.512) | < 0.001 | |
|
|
|||||
| Alcohol consumption | No | 1 | 1 | ||
| Yes | 1.075 (1.039–1.113) | < 0.001 | 1.072 (1.012–1.136) | 0.018 | |
|
|
|||||
| Physical activity (d/wk) | 0 | 1 | 1 | ||
| 1–2 | 1.060 (1.016–1.106) | 0.007 | 1.206 (1.112–1.307) | < 0.001 | |
| ≥ 3 | 1.027 (0.989–1.067) | 0.169 | 1.328 (1.240–1.423) | < 0.001 | |
|
|
|||||
| Sleep h (h/d) | < 6 | 1 | 1 | ||
| 6–7 | 0.570 (0.551–0.590) | < 0.001 | 0.641 (0.606–0.678) | < 0.001 | |
| ≥ 8 | 0.480 (0.460–0.501) | < 0.001 | 0.674 (0.628–0.724) | < 0.001 | |
|
|
|||||
| Hypertension | 0.985 (0.947–1.025) | 0.460 | 0.872 (0.816–0.931) | < 0.001 | |
|
|
|||||
| Diabetes mellitus | 1.013 (0.962–1.066) | 0.627 | 1.078 (0.997–1.166) | 0.061 | |
|
|
|||||
| Dyslipidemia | 1.125 (1.080–1.171) | < 0.001 | 1.202 (1.126–1.283) | < 0.001 | |
|
|
|||||
| Stroke | 1.104 (0.993–1.227) | 0.068 | 1.476 (1.284–1.697) | < 0.001 | |
|
|
|||||
| Coronary heart disease | 1.107 (1.017–1.206) | 0.019 | 1.248 (1.106–1.409) | < 0.001 | |
|
|
|||||
| Arthritis | 1.148 (1.090–1.208) | < 0.001 | 1.241 (1.152–1.337) | < 0.001 | |
|
|
|||||
| Osteoporosis | 1.068 (1.003–1.137) | 0.039 | 1.099 (1.007–1.200) | 0.035 | |
|
|
|||||
| Likelihood ratio test: p < 0.05 | Likelihood ratio test: p < 0.05 | ||||
| Hosmer & Lemeshow test: p = 0.077 | Hosmer & Lemeshow test: p = 0.407 | ||||
Table 5Factors related to mental health status in rural areas.
| Variable | Subjective stress perception | Depressive symptom experience | |||
|---|---|---|---|---|---|
| OR (95% CI) | p* | OR (95% CI) | p* | ||
| Gender | Female | 1 | 1 | ||
| Male | 0.684 (0.649–0.721) | < 0.001 | 0.519 (0.471–0.572) | < 0.001 | |
|
|
|||||
| Age (y) | 19–29 | 1 | 1 | ||
| 30–39 | 0.925 (0.850–1.006) | 0.070 | 1.089 (0.923–1.284) | 0.313 | |
| 40–49 | 0.643 (0.589–0.702) | < 0.001 | 0.776 (0.653–0.921) | 0.004 | |
| 50–59 | 0.433 (0.394–0.475) | < 0.001 | 0.689 (0.577–0.824) | < 0.001 | |
| 60–69 | 0.277 (0.250–0.307) | < 0.001 | 0.444 (0.366–0.538) | < 0.001 | |
| ≥ 70 | 0.234 (0.210–0.260) | < 0.001 | 0.311 (0.254–0.379) | < 0.001 | |
|
|
|||||
| Marital status | With spouse | 1 | 1 | ||
| Bereaved/divorced | 0.897 (0.859–0.938) | < 0.001 | 1.338 (1.249–1.434) | < 0.001 | |
| Single | 0.840 (0.785–0.899) | < 0.001 | 1.144 (1.007–1.299) | 0.039 | |
|
|
|||||
| Education | ≤ Elementary school | 1 | 1 | ||
| Middle school | 0.900 (0.851–0.953) | < 0.001 | 1.037 (0.943–1.141) | 0.455 | |
| High school | 0.940 (0.889–0.994) | 0.029 | 1.045 (0.947–1.152) | 0.383 | |
| College level or higher | 0.958 (0.898–1.023) | 0.199 | 0.916 (0.811–1.034) | 0.157 | |
|
|
|||||
| Household Income (W/mo) | < 2,000,000 | 1 | 1 | ||
| 2,000,000 ~ 4,000,000 | 0.956 (0.917–0.997) | 0.035 | 0.693 (0.643–0.748) | < 0.001 | |
| ≥ 4,000,000 | 0.989 (0.940–1.040) | 0.659 | 0.685 (0.622–0.755) | < 0.001 | |
|
|
|||||
| Economic activity | No | 1 | 1 | ||
| Yes | 1.137 (1.095–1.180) | < 0.001 | 0.628 (0.590–0.669) | < 0.001 | |
|
|
|||||
| Family member with dementia | No | 1 | 1 | ||
| Yes | 1.906 (1.685–2.156) | < 0.001 | 2.138 (1.787–2.558) | < 0.001 | |
|
|
|||||
| Self-reported health status | Good | 1 | 1 | ||
| Moderate | 1.530 (1.470–1.593) | < 0.001 | 1.731 (1.590–1.883) | < 0.001 | |
| Poor | 3.563 (3.392–3.743) | < 0.001 | 3.700 (3.375–4.057) | < 0.001 | |
|
|
|||||
| Smoking | Non-smoker | 1 | 1 | ||
| Currently smoking | 1.802 (1.704–1.905) | < 0.001 | 1.739 (1.569–1.926) | < 0.001 | |
| Former smoker | 1.183 (1.116–1.253) | < 0.001 | 1.395 (1.257–1.550) | < 0.001 | |
|
|
|||||
| Alcohol consumption | No | 1 | 1 | ||
| Yes | 1.047 (1.011–1.086) | 0.011 | 0.998 (0.938–1.062) | 0.948 | |
|
|
|||||
| Physical activity (d/wk) | 0 | 1 | 1 | ||
| 1–2 | 1.057 (0.996–1.122) | 0.065 | 1.374 (1.235–1.529) | < 0.001 | |
| ≥ 3 | 1.177 (1.124–1.231) | < 0.001 | 1.330 (1.223–1.446) | < 0.001 | |
|
|
|||||
| Sleep (h/d) | < 6 | 1 | 1 | ||
| 6–7 | 0.518 (0.498–0.538) | < 0.001 | 0.564 (0.529–0.602) | < 0.001 | |
| ≥ 8 | 0.452 (0.432–0.474) | < 0.001 | 0.576 (0.533–0.623) | < 0.001 | |
|
|
|||||
| Hypertension | 0.965 (0.928–1.003) | 0.073 | 0.887 (0.831–0.948) | < 0.001 | |
|
|
|||||
| Diabetes mellitus | 0.997 (0.950–1.047) | 0.913 | 1.075 (0.993–1.163) | 0.073 | |
|
|
|||||
| Dyslipidemia | 1.122 (1.074–1.172) | < 0.001 | 1.201 (1.117–1.290) | < 0.001 | |
|
|
|||||
| Stroke | 1.313 (1.204–1.432) | < 0.001 | 1.694 (1.502–1.910) | < 0.001 | |
|
|
|||||
| Coronary heart disease | 1.138 (1.055–1.227) | 0.001 | 1.363 (1.220–1.524) | < 0.001 | |
|
|
|||||
| Arthritis | 1.188 (1.137–1.242) | < 0.001 | 1.237 (1.153–1.328) | < 0.001 | |
|
|
|||||
| Osteoporosis | 1.153 (1.095–1.214) | < 0.001 | 1.126 (1.039–1.219) | 0.004 | |
|
|
|||||
| Likelihood ratio test: p < 0.05 | Likelihood ratio test: p < 0.05 | ||||
| Hosmer & Lemeshow test: p = 0.253 | Hosmer & Lemeshow test: p = 0.486 | ||||
Figure & Data
References
Citations
Citations to this article as recorded by 
- Linking neighbourhood safety and children's internalizing and externalizing problems: Mediating role of maternal depression
Youngmin Cho
Child & Family Social Work.2023; 28(4): 1089. CrossRef -
Factors Affecting Activity Limitation in the Elderly: Data Processed from the Korea National Health and Nutrition Examination Survey, 2016
Jong-Hoon Moon
Osong Public Health and Research Perspectives.2019; 10(3): 117. CrossRef - Depression Status in Korea
Soo Kyung Koo
Osong Public Health and Research Perspectives.2018; 9(4): 141. CrossRef
 PubReader
 Cite
Cite