
Articles
- Page Path
- HOME > Osong Public Health Res Perspect > Volume 7(6); 2016 > Article
-
Original Article
Instability of Plasma and Serum Progastrin-Releasing Peptide During Repeated Freezing and Thawing - Jae-Eun Leea, Jin-Hyun Leeb, Maria Honga, Seul-Ki Parka, Ji-In Yua, So-Youn Shina, Shine Young Kimb
-
Osong Public Health and Research Perspectives 2016;7(6):351-355.
DOI: https://doi.org/10.1016/j.phrp.2016.11.004
Published online: November 16, 2016
aNational Biobank of Korea, Center for Genome Sciences, Korea National Institute of Health, Korea Centers for Disease Control and Prevention, Cheongju, Korea
bDepartment of Laboratory Medicine, Pusan National University School of Medicine, Busan, Korea
- ∗Corresponding author. dr.shineyoung@gmail.com
• Received: July 5, 2016 • Accepted: November 10, 2016
Copyright © 2016 Korea Centers for Disease Control and Prevention. Published by Elsevier Korea LLC.
This is an open access article under the CC BY-NC-ND license (http://creativecommons.org/licenses/by-nc-nd/4.0/).
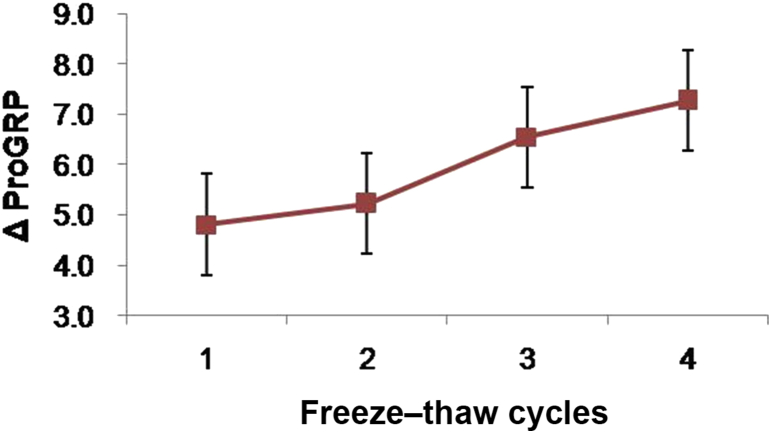

Figure & Data
References
Citations
Citations to this article as recorded by 
- Effect of Repeated Freeze–Thaw Cycles on Influenza Virus Antibodies
Alessandro Torelli, Elena Gianchecchi, Martina Monti, Pietro Piu, Irene Barneschi, Carolina Bonifazi, Rosa Coluccio, Luisa Ganfini, Luciano Michele La Magra, Silvia Marconi, Ginevra Marzucchi, Ramona Pace, Laura Palladino, Bernardo Biagi, Emanuele Montomo
Vaccines.2021; 9(3): 267. CrossRef - The influence of different blood samples treatment methods on pro-gastrin-releasing peptide
Huiqin Jiang, Ling Luo, Kang Xiong, Chengwen He, Huaizhou Wang, Yanghua Qin
Medicine.2019; 98(26): e16130. CrossRef
 PubReader
 Cite
Cite

