Skip Navigation
Skip to contents

PHRP : Osong Public Health and Research Perspectives

OPEN ACCESS
SEARCH
Search

Articles

Page Path
HOME > Osong Public Health Res Perspect > Volume 6(5); 2015 > Article
Original Article
The Determinants of Research and Development Investment in the Pharmaceutical Industry: Focus on Financial Structures
Munjae Lee, Mankyu Choi
Osong Public Health and Research Perspectives 2015;6(5):302-309.
DOI: https://doi.org/10.1016/j.phrp.2015.10.013
Published online: November 6, 2015

School of Health Policy and Management, Korea University, Seoul, Korea

∗Corresponding author. emunjae@korea.ac.kr
• Received: May 27, 2015   • Accepted: October 6, 2015

Copyright © 2015 Korea Centers for Disease Control and Prevention. Published by Elsevier Korea LLC. All rights reserved.
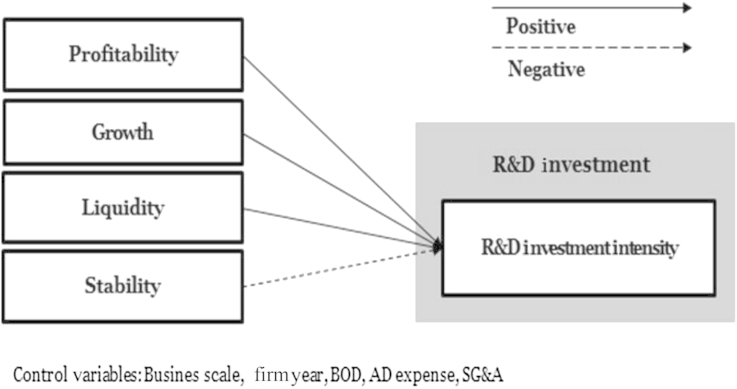
  • 2,714 Views
  • 14 Download
  • 22 Crossref
  • 23 Scopus
  • Objectives
    This study analyzes the influence of the financial structure of pharmaceutical companies on R&D investment to create a next-generation profit source or develop relatively cost-effective drugs to maximize enterprise value.
  • Methods
    The period of the empirical analysis is from 2000 to 2012. Financial statements and comments in general and internal transactions were extracted from TS-2000 of the Korea Listed Company Association (KLCA), and data related to stock price is extracted from KISVALUE-Ⅲ of NICE Information Service Co., Ltd. Stata 12.0 was used as the statistical package for panel analysis.
  • Results
    The current ratio had a positive influence on R&D investment, the debt ratio had a negative influence on R&D investment, and return on investment and net sales growth rate did not have a significant influence on R&D investment.
  • Conclusion
    It was found in this study that the higher liquidity ratio, the greater the R&D investment. The stability of pharmaceutical companies has a negative influence on R&D investment. This finding is consistent with the prediction that if a company faces a financial risk, it will be passive in R&D investment due to its financial difficulties.
The pharmaceutical industry is likely to suffer a market failure as it is directly connected to life and health and its role in limiting the products that are made available to general consumers. Pharmaceutical companies tend to develop new drugs to treat new diseases through research and development (R&D) investment to create a next-generation profit source or develop relatively cost-effective drugs to maximize enterprise value. R&D in the pharmaceutical industry has the characteristic of continuously requiring high investments. Studies that have empirically analyzed R&D investment in the pharmaceutical industry largely clarify factors that have positive relevance for R&D investment. Grabowski and Vernon [1] determined that there is a positive relevance between a firm's internal cash flow and R&D costs among pharmaceutical companies. Vernon [2] studied firms exposed to the U.S. pharmaceutical pricing policy and revealed that there is a positive relevance between the former term's internal cash flow and the current term's expected returns as R&D determinants. Lee and Lee [3] used explanatory variables such as R&D intensity and Bank of International Settlements (BIS) ratio, targeting 63 pharmaceutical companies using data from 2001 to 2006, and analyzed their effects on corporate performance in a time-lag model. They analyzed that R&D cost intensity a year ago had a positive influence on the current term's ratio of ordinary profit but R&D expenditures of 2 years and 3 years previously had a negative influence on that ratio. This was presumably due to the research investment characteristics for new drug developments (long-term investment), and structural characteristics of R&D activities that focus on incrementally modified drugs and generic medicine.
Many theses in Korea, as well as overseas, emphasize that internal cash flow can play an important role in a firm's actual investment decisions in an imperfect capital market. R&D investment is not an exception. The argument that R&D investment can be influenced by internal finances and internal cash flow originates from Arrow [4], who stated that high-risk investments such as technological innovation may face serious “moral hazard” issues and consequently restrict external financing availability. Moreover, Kamien and Schwartz [5] point out that internal financing from current profits and accumulated capital is extremely important for promoting R&D investment. Later, Stiglitz and Weiss [6] and Myers and Majluf [7] supported Arrow [4] in the argument that moral hazards and adverse selection issues can be more serious if R&D investment funds are financed from liabilities and the stock market. According to Modigliani and Miller [8], a firm's investment decisions in a perfect capital market are influenced only by future sales cash flow incurred from investments and are irrelevant to the capital financing method. However, the capital market is imperfect and financial factors intervene in actual investment decisions. Stein [9] summarized the previous theories concerning reasons for the increasing importance of financial factors in investments into two categories.
Firstly, according to the financing constraints hypothesis, there is a cost gap between internal and external funds due to information asymmetry in the imperfect capital market, causing a firm's investment decisions to be influenced by internal cash flow. Financing constraints refer to a situation where there are constraints in making an investment that may have been completed if internal funds could have been used, but is abandoned due to the limited availability of external funds or the cost of external financing [10]. In other words, in such a situation of financial constraints, internal funds are used first as a priority for the investment. Therefore, investment expenditures are sensitive to the amount of internal cash flow. According to the financing constraints hypothesis, the existence of a premium due to information asymmetry in the external capital market results in the issue of adverse selection, in which profitable projects are abandoned due to high external financing costs 6, 7. In particular, if other conditions are equal, firms with more abundant internal cash flow can make necessary investments smoothly; those without this may underinvest.
Secondly, there is the managerial discretion hypothesis in which the manager uses the firm's cash flow for his or her own purposes. If ownership and management are separated, the manager has the ability to use free cash flow for opportunistic purposes such as possibly investing in projects with negative net present value (NPV < 0) to pursue his or her own interests instead of returning the free cash flow to shareholders through dividends. In particular, the manager may use free cash flow to overinvest due to the appeal of the financial and nonfinancial benefits achieved through the expansion of the business scale 11, 12, 13. According to Jensen [11] and Stulz [13], managers tend to increase controllable enterprise resources by expanding the business scale beyond the optimum level if it increases their rewards, power, and fame. If they can achieve both an increase in business scale and personal profit, managers may even implement investment plans with negative NPV (NPV < 0). In this way, the managerial discretion hypothesis explains how a firm's investment plans may respond to the internal financial factor of free cash flow.
Both hypotheses continue to show valid empirical analysis results, but many cases of R&D investment are based on the financing constraints hypothesis. This is because if R&D investment funds are financed from external financial markets, there is a possibility of a serious information asymmetry issue 14, 15. The information asymmetry issue is especially important in R&D investment for the following reasons. To begin with, R&D investment must be supported by both technological and market success, thereby having a much higher risk than real investment; and outside investors face the information asymmetry issue, feeling greater uncertainty regarding potential investment success than company insiders. Next, a firm is likely to promote information asymmetry or secrecy because if information is provided to outside investors, it may be exposed to competitors as well 5, 16. In this case, if the firm's outside investors face information asymmetry about R&D investments, they can demand higher returns above and beyond the R&D investment funds they provided. Moreover, R&D investment has weaker mortgage value than real investments 5, 17, resulting in other difficulties in external financing aside from information asymmetry. Thus, R&D investment depends largely on internal cash flow due to the challenges of information asymmetry, as well as mortgage issues faced with external financing.
As can be seen above, a firm's R&D investment tends to depend largely on internal cash flow when there are issues such as information asymmetry. Moreover, the investment scale may be influenced by the fluctuation of internal cash flow, and the R&D investment scale is adjusted over the long run based on internal cash flow as the source of funding. Therefore, firms using a mechanism that can stabilize internal cash flow despite low cash retention can secure continuous financing for R&D investment. Thus, internal cash flow stabilization relieves the problem of R&D discontinuity or reluctance so that the investment outcome becomes beneficial in increasing market concentration or securing long-term corporate competitiveness, ultimately resulting in a positive influence on enterprise value.
This study aims to clarify the factors that have a positive influence on the R&D investment of pharmaceutical companies. Specific details are as follows:
  • This study analyzes the influence of the financial structure of pharmaceutical companies on R&D investment.

  • This study evaluates the influential factors identified through analysis and examines positive promotion plans.

2.1 Data sources
The period of the empirical analysis was from 2000 to 2012, considering the period after the influence of the financial crisis. Financial statements and comments in general and internal transactions were extracted from TS-2000 of the Korea Listed Company Association (KLCA), and data related to stock price is extracted from KISVALUE-Ⅲ of NICE Information Service Co., Ltd. Stata 12.0 was used as the statistical package for panel analysis. Sample firms were those that belong to the medical substance and drug manufacturing industries. Cases of complete impairment of capital in the relevant year and types of management were excluded, as it may be impossible to compare with other firms and years due to high risk of bankruptcy. The sample firms included firms that closed accounts at the end of December as well as other settling days, but firms that changed the settling days were excluded as the result might be distorted due to a short accounting period in the year in which the day was changed. In analyzing data on R&D investment, there were issues of omitted records, inconsistency, and failure of reflected changes in the database of TS-2000 and KISVALUE-Ⅲ despite the fact that accuracy of R&D cost-related data was extremely important. Thus, this study collected data from the Data Analysis, Retrieval and Transfer System of the Financial Supervisory Service. Ultimately, 786 firm-year data of 81 firms were included in the sample. Unbalanced panel data with different data inclusion periods of variables as in Table 1 could be obtained according to the availability of data.
2.2 Research hypotheses
2.2.1

2.2.1 R&D investment and profitability

A large or increasing profit scale due to high revenues at a firm indicates that the firm is successful, and induces the firm to make active R&D investment. Moreover, a large profit scale and increased profits show that internal funds can be used for R&D investment. Kamien and Schwartz [5] argue that the relationship between R&D investment and net profit differs in intensity depending on the firm. Venture businesses with high risk finance their own investments, making high ordinary profit crucial. This is because securing liquidity from profits generated by the firm itself can be the direct financing for R&D investment. This study sets up the following hypothesis to analyze the influence of the profitability [return on investment (ROI)] of pharmaceutical companies on R&D investment based on previous studies.
Hypothesis 1
Profitability (ROI) will have a positive correlation with R&D.
2.2.2

2.2.2 R&D investment and growth

Firms with higher growth are expected to make more R&D investments. Pindado et al [18] presented an analysis result that a firm's growth and corporate characteristics variables have a positive influence on the efficiency of the R&D investment. R&D investment and high growth of the firm increases opportunities for profit scale expansion, ultimately having a positive effect on enterprise value. This study sets up the following hypothesis to analyze the influence of the net sales growth (SG) rate of pharmaceutical companies on R&D investment based on previous studies.
Hypothesis 2
SG will have a positive correlation with R&D investment.
2.2.3

2.2.3 R&D investment and liquidity

The theory of financing under information asymmetry predicts that there is a positive relationship between a firm's investment expenditures and internal cash flow. That is, as internal cash flow increases, more external financial expense can be saved, thereby increasing the firm's investment expenditures. Myers and Majluf [7] stated that when there is information asymmetry and the manager must represent the interests of the existing shareholders, he or she tends to preferentially use internal financing for investment. The existing shareholders and outsiders share the value increase from investment if external financing such as liabilities or rights issue is used for new investment opportunities. However, if the firm uses internal financing, the increase in enterprise value is all given to the existing shareholders. Therefore, the greater the influence of shareholders on the manager, the greater the possibility of investment decisions dependent on internal cash flow. This study sets up the following hypothesis to analyze the influence of the liquidity level of pharmaceutical companies on R&D investment based on previous studies.
Hypothesis 3
Liquidity (LIQ) will have a positive correlation with R&D investment.
2.2.4

2.2.4 (4) R&D investment and stability

R&D investment can be seen as an intangible asset that contributes to a firm's future growth. Unlike general investment in equipment, it has a high risk of failure and almost no assets to retrieve if it fails. Therefore, banks are reluctant to invest in R&D, demanding strict conditions or collateral for loans. Thus, firms with extensive liabilities hesitate to make R&D investments due to the concern of financial difficulties. In other words, R&D investment expenditure is, by nature, not an essential and urgent expenditure, and thus its size will be influenced by the financial position of the firm. Therefore, firms with high financial risk due to high debt-equity ratios are expected to be passive in R&D investment. This study sets up the following hypothesis to analyze the influence of the debt-equity ratio of pharmaceutical companies on R&D investment based on previous studies.
Hypothesis 4
Stability (LEV) will have a negative correlation with R&D investment.
2.3 Research model
We applied the research model for the empirical analysis as follows (Figure 1; Table 2):
RDit=α+β1ROIit+β2SGit+β3LIQit+β4LEVit+β5SIZEit+β6YEARit+β7BSit+β8ADit+β9SAEit+μi+εit
3.1 Descriptive statistics
Table 3 shows the descriptive statistics of key variables of all firms used in the empirical analysis. The characteristics of probability distribution and the outliers of key variables are as follows. The dependent variable of R&D investment appeared to be approximately 6.29%, and the maximum and minimum values show that there are considerable gaps among firms. The average of the variables related to financial structure was lowest in profitability (ROI) with a value of 4.58, while the average for growth (SG) was 10.73, and that for stability (LEV) was 67.29. The average of liquidity (LIQ) was the highest with 361.77, and the maximum and minimum values show that there are considerable gaps among firms. Firm size and firm age, which this study considered as control variables and factors that may influence R&D investment, turned out not to have a great standard deviation compared with the average and, therefore, appeared not to have a significant problem in normal distribution.
Table 4 shows a summary of the annual average of key variables. The trend for these key variables is as follows. The R&D investment variable (RD) is increasing constantly, while the variables related to financial structure such as profitability (ROI), growth (SG), liquidity (LIQ), and stability (LEV) are showing a downturn since the financial crisis. Variables related to ownership structure were increasing constantly until the financial crisis, after which there was a slowdown for a short time, and then they rose again.
3.2 Correlations
Table 5 presents the Pearson correlation coefficient to verify the multicollinearity status and correlation among explanatory variables. In general, the correlation coefficients among explanatory variables are not significantly high, and thereby the multicollinearity status is not in doubt. In particular, most correlation coefficients among explanatory variables appeared to be 0.5 or below, indicating that there is no multicollinearity problem. Table 5 shows that certain independent variables were interrelated and related to the dependent variables. The following correlations among the dependent variables and between the dependent variables and independent variables are significant: RD and LIQ (0.232) and SAE (0.242) are significantly positively correlated; RD and ROI (−0.167), YEAR (−0.210), AD (−0.091) are significantly negatively correlated.
3.3 Regression
This chapter presents the analysis results of Hypothesis 1, Hypothesis 2, Hypothesis 3, and Hypothesis 4 that are the focus of this study. To verify whether there is a positive influence on the relationship between R&D investment and financial structure, indices including profitability, growth, liquidity, and stability were estimated. Table 6 shows the analysis results of Hypothesis 1, Hypothesis 2, Hypothesis 3, and Hypothesis 4 estimated by the panel fixed effect model.
Profitability (ROI) appeared not to have a statistically significant influence on R&D investment. Therefore, Hypothesis 1 that “ROI will have a positive correlation with R&D investment” is rejected. Growth (SG) showed a negative regression coefficient with statistical significance. This study measured growth using a net sales growth rate. Accordingly, it was found that, as sales increase in comparison to the previous year, R&D investment decreases. Thus, Hypothesis 2 that a “net sales growth rate will have a positive correlation with R&D investment” is rejected. The third hypothesis tests the positive relationship between current ratio and R&D investment ratio. In the model, the current ratio and R&D investment ratio showed a statistically significant positive relationship. Therefore, the R&D investment ratio increases if there is more internal cash flow and liquidity within the firm, which supports Hypothesis 3: “Liquidity will have a positive correlation with R&D investment.” Stability (LEV) is a financial ratio that measures a firm's stability. If this ratio is low, the firm's stability is high, as interest costs due to a firm's use of debt are low, thereby enabling the firm to make more extensive R&D investments. As a result, Hypothesis 4 that the “Stability will have a negative correlation with R&D investment” is supported.
4.1 Discussion
This study conducted an integrated analysis on the factors influencing R&D investment in the Korean pharmaceutical industry, through a detailed review of the financial structure. To explain the factors influencing R&D investment in pharmaceutical companies, this study reviewed previous theories that have been developed, and then examined the logical basis and validity concerning the application of the financial structure theory to pharmaceutical companies. Based on the above analysis, review, and examination, this study selected factors that could consummately explain the influential factors of R&D investment in pharmaceutical companies, and then established a hypothesis for each factor. TS-2000 was used for the analysis data in this study. The study was conducted in two phases targeting the ‘medical substance and drug manufacturing industries’ between 2000 and 2012.
The results showed that: (1) the current ratio had a positive influence on R&D investment (2) the debt ratio had a negative influence on R&D investment and (3) ROI and net sales growth rate did not have a significant influence on R&D investment. The summary of the findings and the interpretation of the significance of this are as follows.
Firstly, it was found in this study that the higher liquidity ratio, the greater the R&D investment. The results of this study are similar to the research findings by Grabowski and Vernon [1], Vernon [2] on pharmaceutical companies, as well as research by Kamien and Schwartz [5], Himmelberg and Petersen [15], Bhagat and Welch [19] on the manufacturing and financial industries. The current ratio is an index that determines a company's ability to pay short-term debts; a high current ratio indicates that the company has significant liquidity, and thus has the ability to generate cash easily. Moreover, greater liquidity implies that the company has the cash to make active R&D investments. When external capital markets are unstable, the fluctuations of a company's internal finances are likely to affect all components of R&D investment. When internal finances decline, funding-constrained companies will reduce their accumulation of assets. The degree of this asset reduction will be influenced by the ease of their disposition or the size of the adjustment costs.
R&D investment requires relatively high adjustment costs. Therefore, R&D that requires liquidity will be restricted when internal finances are reduced, even though it may be a relatively small amount compared to the fixed or inventory investment requirements of the decrement of the total investment. Moreover, as the company tends not to disclose the elements or progress of its R&D to the suppliers of external funds, receiving external financing will be more difficult and the cost of such external funds may be higher than internal funds [16]. This could lead to a phenomenon where the company prefers internal funds to external funds due to the asymmetry of information in the loan markets. In other words, this shows why internal finances have a significant influence on R&D investment at pharmaceutical companies.
Secondly, the stability of pharmaceutical companies has a negative influence on R&D investment. This finding is consistent with the prediction that, if a company faces a financial risk, it will be passive in R&D investment due to its financial difficulties. This conclusion is similar to the findings of the research by Baysinger and Hoskisson [20], Kochhar and David [21], Hoskisson et al [22]. R&D investment is an intangible asset that contributes to the future growth of a company, and strategic decision making is extremely important as R&D has a high risk of failure, unlike general facilities investment [17]. It is necessary to examine the ability of a company to afford external financing, generally determined by the available financial resources within the company [21]. In other words, a company's capital structure has a significant influence on R&D investment, and its debt ratio that represents its capital structure influences its capital financing. Therefore, a company with high debt ratio will often reduce investment in R&D due to a concern about potential financial difficulties caused by default, and face detrimental loan conditions such as high interest rates or onerous security requirements. Especially in the high-risk pharmaceutical industry, a company's financing ability is an important element, which influences its credit rating. Therefore, if the internal cash flow of a company deteriorates, receiving external funding becomes difficult and financing costs increase. In these circumstances, companies with higher degrees of dependence on short-term debt face greater difficulties in terms of internal cash flow. In other words, companies with high debt ratios may reduce investment in R&D due to concerns about potential loan defaults and the decrease in their ability to invest in long-term projects with long payback periods.
4.2 Practical implications
The global pharmaceutical industry is constantly growing and is expected to grow more in the future in connection with demand factors, such as an aging society and chronic diseases, and supply factors, such as the expansion of bioresearch. Although the Korean pharmaceutical industry is also developing, it is expected that the current structure of this small pharmaceutical industry will be greatly adjusted due to institutional factors such as the Free Trade Agreement. The key findings and implications of this study are as follows.
Firstly, according to the results of the analysis verifying the correlation between financial structure and R&D investment, factors that had significant influence on R&D investment were variables such as liquidity and stability. The higher the liquidity (and the lower the stability), the higher was the R&D investment. In other words, information asymmetry resulted in liquidity being a more important factor than stability. Therefore, it is necessary to develop new drugs with high initial costs by establishing a public pharmaceutical company that can easily secure stable funds. Furthermore, it is necessary to provide support by selecting companies in each area such as generic, new drugs, ethical, and over the counter instead of the top one or two companies supported through the pharmaceutical fund by the Ministry of Health and Welfare.
Secondly, there is a need for strategies to develop a portfolio of products that would improve the competitiveness of the relevant company rather than a consistent strategy of new drug development. Recently, many companies consider new drug development as the only way to secure competitiveness in the tough conditions prevailing in the pharmaceutical industry. However, developing new drugs carries great risk, requiring high investment and time. Therefore, not only should new drug development be made, but investment and support should also be provided according to the specific factors suitable to improve the competitiveness of each company, such as generic, incrementally modified drugs, and biosimilar products. Furthermore, it is necessary to support the generic industry, to improve access to drugs. Using generic drugs to reduce medical costs is a global trend, and considering the case of Israel's pharmaceutical company Teva, as well as India's policy of developing the generic industry, fostering the generic industry should be viewed negatively. Therefore, there is a need for strategies that are suitable to improve the competitiveness and characteristics of each company.
The authors have nothing to disclose.

This is an open-access article distributed under the terms of the Creative Commons Attribution-NonCommercial-No Derivative Works License (http://creativecommons.org/licenses/by-nc-nd/4.0) which permits non-commercial use, distribution, and reproduction in any medium, provided the original author and source are credited.

Figure 1
Research model. AD = advertising; BOD = size of the board of directors; R&D = research and development; SG&A = selling and administrative expenses.
gr1
Table 1
Annual distribution of sample firms.
Yr Firms Share Cumulative
2000 39 4.96 4.96
2001 42 5.34 10.31
2002 48 6.11 16.41
2003 51 6.49 22.90
2004 52 6.62 29.52
2005 56 7.12 36.64
2006 58 7.38 44.02
2007 62 7.89 51.91
2008 68 8.65 60.56
2009 72 9.16 69.72
2010 77 9.80 79.52
2011 80 10.18 89.69
2012 81 10.31 100.00
Table 2
Summary of hypotheses.
Hypotheses
1 Profitability (ROI) will have a positive correlation with R&D investment.
2 Growth (SG) will have a positive correlation with R&D investment.
3 Liquidity (LIQ) will have a positive correlation with R&D investment.
4 Stability (LEV) will have a negative correlation with R&D investment.

LEV = stability; LIQ = liquidity; ROI = return on investment; R&D = research and development; SG = sales growth.

Table 3
Descriptive statistics.
Variable Obs Mean SD Min Max
RD 786.00 6.29 9.10 0.12 99.07
SIZE 786.00 7.97 0.43 6.98 9.24
YEAR 786.00 1.02 0.43 0.00 1.71
BS 786.00 0.70 0.15 0.00 1.18
AD 786.00 3.53 3.32 0.00 23.32
SAE 786.00 36.33 14.56 3.26 141.77
ROI 786.00 4.58 8.93 −63.34 41.50
SG 786.00 10.73 25.31 48.72 501.81
LIQ 786.00 361.77 296.09 35.20 2269.89
LEV 786.00 67.29 91.37 0.00 1549.72

AD = advertising expense; BS = business scale; LEV = stability; LIQ = liquidity; Max = maximum; Min = minimum; Obs = observation; RD = research and development investment; SAE = selling and administrative expenses; SD = standard deviation; SG = sales growth; SIZE = size of the board of directors; YEAR = firm age.

Table 4
Annual average of the variables.
Yr RD SIZE YEAR BS AD SAE ROI SG LIQ LEV
2000 2.15 7.87 0.95 0.72 5.08 36.55 4.85 12.16 282.13 110.60
2001 2.38 7.87 0.96 0.75 5.39 35.74 8.62 13.55 313.66 124.72
2002 2.93 7.83 0.94 0.71 4.89 36.03 6.03 10.08 376.72 78.09
2003 3.95 7.84 0.96 0.72 4.26 37.50 4.71 5.25 404.18 79.78
2004 4.60 7.88 1.00 0.72 3.57 35.75 5.34 9.52 407.34 58.79
2005 5.50 7.91 1.01 0.69 3.45 37.71 4.49 11.99 423.39 55.87
2006 5.79 7.94 1.06 0.70 3.63 38.30 4.22 8.57 431.40 59.29
2007 6.63 7.96 1.04 0.68 3.82 38.38 4.54 10.98 414.59 55.27
2008 7.00 7.98 1.02 0.71 3.26 37.17 4.59 19.84 343.75 55.77
2009 7.18 8.02 1.02 0.70 2.96 36.09 4.63 15.59 340.67 60.24
2010 8.15 8.05 1.04 0.68 2.73 35.47 4.98 13.58 340.27 56.46
2011 8.45 8.09 1.07 0.69 2.78 34.29 3.64 5.62 300.05 62.79
2012 10.25 8.11 1.11 0.69 2.49 34.78 1.77 4.07 342.62 61.37
TOTAL 6.29 7.97 1.02 0.70 3.53 36.33 4.58 10.73 361.77 67.29

AD = advertising expense; BS = business scale; LEV = stability; LIQ = liquidity; RD = research and development investment; SAE = selling and administrative expenses; SD = standard deviation; SG = sales growth; SIZE = size of the board of directors; YEAR = firm age.

Table 5
Pearson's correlation coefficients.
RD ROI SG LIQ LEV SIZE YEAR BS AD SAE
RD 1
ROI −0.1677* 1
SG 0.0168 0.1218* 1
LIQ 0.2329* 0.1519* −0.0206 1
LEV −0.0567 −0.2936* −0.032 −0.3012* 1
SIZE 0.0389 0.1020* −0.0328 −0.3840* 0.1238* 1
YEAR −0.2109* −0.1734* −0.0942* −0.3208* 0.2156* 0.5650* 1
BS −0.0075 0.0887* 0.0194 −0.1823* 0.0482 0.4694* 0.3439* 1
AD −0.0914* 0.0790* −0.0555 −0.0967* −0.0518 0.2471* 0.1575* 0.0786* 1
SAE 0.2426* −0.4497* −0.0467 0.0439 0.1129* −0.0728* 0.1075* 0.0034 0.3469* 1

AD = advertising expense; BS = business scale; LEV = stability; LIQ = liquidity; RD = research and development investment; SAE = selling and administrative expenses; SD = standard deviation; SG = sales growth; SIZE = size of the board of directors; YEAR = firm age.

*p < 0.05.

Table 6
Result.
Coef. S.E Coef. S.E Coef. S.E Coef. S.E Coef. S.E Coef. S.E
SIZE 4.513 1.159 4.460 1.162 4.178 1.160 4.748 1.160 4.507 1.156 4.314 1.161
YEAR 1.338 0.912 1.29 0.915 1.405 0.908 1.384 0.909 1.226 0.911 1.309 0.911
BS −1.933 1.586 −1.935 1.587 −1.522 1.586 −1.776 1.583 −1.865 1.583 −1.461 1.583
AD −0.106 0.0826 −0.0995 0.0833 −0.101 0.0822 −0.0997 0.0824 −0.131 0.0833 −0.122 0.0839
SAE 0.0289 0.0197 0.0208 0.0234 0.018 0.0200 0.0262 0.0196 0.0329* 0.0197 0.0146 0.0241
ROI −0.0166 0.0259 0.022 0.0476
SG −0.0165 0.00597 −0.0153 0.0060
LIQ 0.00167 0.00073 0.00146* 0.00075
LEV −0.00399 0.00190 −0.00408 0.00195
Constant −30.35 8.770 −29.53 8.868 −27.49 8.791 −32.91 8.817 −30.02 8.751 −28.55 8.887
Obs 786 786 786 786 786 786
Adj 0.072 0.072 0.082 0.079 0.078 0.095
ID 81 81 81 81 81 81

AD = advertising expense; Adj = adjustment; BS = business scale; Coef. = coefficient; ID = identification; LEV = stability; LIQ = liquidity; Obs = observation; RD = research and development investment; SAE = selling and administrative expenses; SD = standard deviation; S.E. = standard error; SG = sales growth; SIZE = size of the board of directors; YEAR = firm age.

* p < 0.1, † p < 0.05, ‡ p < 0.01.

Figure & Data

References

Citations

Citations to this article as recorded by  

Figure

PHRP : Osong Public Health and Research Perspectives