Skip Navigation
Skip to contents

PHRP : Osong Public Health and Research Perspectives

OPEN ACCESS
SEARCH
Search

Articles

Page Path
HOME > Osong Public Health Res Perspect > Volume 5(Suppl); 2014 > Article
Original Article
Trends and Characteristics of HIV Infection among Suspected Tuberculosis Cases in Public Health Centers in Korea: 2001–2013
Meekyung Keea, Kyoung-Ho Leea, Sae-Young Leea, Chun Kanga, Chaeshin Chub
Osong Public Health and Research Perspectives 2014;5(Suppl):S37-S42.
DOI: https://doi.org/10.1016/j.phrp.2014.11.002
Published online: November 13, 2014

aDivision of AIDS, Korea National Institute of Health, Cheongju, Korea

bDivision of Epidemic Intelligence Service, Korea Centers for Disease Control and Prevention, Cheongju, Korea

∗Corresponding author. keemeekyung@gmail.com
• Received: October 31, 2014   • Revised: November 5, 2014   • Accepted: November 6, 2014

© 2014 Published by Elsevier B.V. on behalf of Korea Centers for Disease Control and Prevention.

This is an Open Access article distributed under the terms of the CC-BY-NC License (http://creativecommons.org/licenses/by-nc/3.0).

  • 2,863 Views
  • 18 Download
  • 1 Crossref
  • 1 Scopus
  • Objectives
    The Republic of Korea reports approximately 35,000 new tuberculosis (TB) patients each year, and the number of HIV-infected individuals is steadily increasing. Public health centers (PHCs) conduct TB diagnosis and treatment for risk groups in communities. This study aimed to identify possible trends and characteristics of HIV infection among suspected TB cases in PHCs.
  • Methods
    Study subjects were suspected TB cases in PHCs who agreed to be tested for HIV from 2001 to 2013. Trends in HIV seroprevalence were assessed through a series of annual cross-sectional analyses. We analyzed suspected TB cases, and HIV-infected individuals among suspected TB cases, by gender, age, nationality, and region.
  • Results
    The number of suspected tuberculosis cases who took an HIV test in PHCs was approximately 6,000 each year from 2001 to 2013. Among the suspected TB cases who took an HIV test, the number of those aged 20–39 is gradually decreasing, while the number of those aged 50–69 is increasing. During this period, 32 HIV-infected individuals were identified; the majority were men (94%), aged 30–49 (68%), Korean (94%), and residents in a metropolitan area (53%). HIV seroprevalence decreased from 8.2 per 10,000 persons in 2001 to 1.9 per 10,000 persons in 2013.
  • Conclusion
    This study has identified trends and characteristics of HIV infection among suspected tuberculosis cases in PHCs. This national data provides a basis for public health policy for HIV and tuberculosis infections.
The Joint United Nations Programme on HIV/AIDS (UNAIDS) estimated that in 2013 there were two billion people with tuberculosis (TB) and 35 million people living with HIV/AIDS worldwide. In 2011, an estimated 8.7 million were newly infected with TB; among these, 1.1 million (12.6%) were HIV-infected. In 2012, approximately 320,000 deaths (36%) of HIV-infected individuals were related to TB [1], demonstrating that TB is a major cause of death among HIV-infected individuals. HIV infection raises the risk of TB infection by 12 to 20 times, and is the strongest risk factor to onset of active TB among latent TB-infected persons [2,3].
The Republic of Korea witnesses approximately 35,000 new TB patients and 2,000–3,000 TB deaths (5 per 100,000 persons) each year, which is higher than other countries [4,5]. There are about 1,000 newly diagnosed HIV infections per year and the number of HIV-infected individuals is small compared with other countries, but it is steadily increasing [6]. TB is a major opportunistic infection (13–25%) in HIV-infected individuals in Korea, and the incidence rate of TB among HIV-infected persons is increasing [7–9].
Korea constructed a national TB control system in 1962; since then, public health centers (PHCs) have conducted prevention, registration and management of patients, and treatment [10]. Since the first HIV-infected person was diagnosed in Korea in 1985, HIV tests have been conducted in PHCs. However, with an increase in household incomes in Korea, increased health insurance coverage, and enhancement of private medical institutions, more TB diagnoses and HIV tests have been performed in clinics and hospitals. As a result, more TB patients and HIV-infected individuals are now found in clinics and hospitals than PHCs [11].
The targets of PHCs' TB programs are older adults, physically challenged persons, residents of group facilities such as residential treatment facilities and social welfare facilities, foreign workers, immigrants by marriage, occupations and regions with limited medical access, miners, and high risk group such as alcoholics and drug addicts [12]. Those who have been tested for HIV include inmates of group facilities, people with limited medical access, and commercial sex workers; the objective of this testing is for prevention and early diagnosis of HIV infection [13].
There is a large burden of TB in Korea, and HIV infection is also on the rise; therefore, it is important to diagnose TB and HIV early, to give infected persons appropriate treatment for preventing disease progress. Furthermore, it is necessary to identify the status and characteristics of HIV infection among suspected TB cases, to establish prevention policy and provide a basis for prevention education.
Suspected TB cases in PHCs belong to risk groups and have high chances of HIV infection. This study aimed to identify trends and characteristics of HIV infection among suspected TB cases in PHCs.
Patients with tuberculosis visiting PHCs belong to at-risk groups and have increased chances of HIV coinfection. Therefore, this study aims to identify the status and characteristics of HIV infection among patients with tuberculosis registered in PHCs.
2.1 Study participants and data collection
Study subjects were suspected TB cases that visited PHCs and agreed to take HIV tests. Among suspected TB cases, if doctors decided to offer HIV tests, the HIV tests were only conducted with the patient's agreement [12]. PHCs managed the test data with a computerized data processing system known as the Health Care Information System (HCIS). This system began to be installed in PHCs in 2000, and installation was completed in all PHCs in 2005. HIV test data were converted from the HCIS into Excel format and reported to the Korea Centers for Disease Control and Prevention (KCDC). Before the installation of the HCIS, only the number of HIV tests were manually recorded and collected. The variables collected in KCDC consist of specimen code, gender, year of birth, the reason for HIV testing, test results, institution of first diagnosis, number of tests code, and confirmatory test code. In this study, we collected all data of suspected TB cases with an HIV test result available in KCDC.
2.2 National HIV testing system
PHCs used enzyme-linked immunosorbent assay (ELISA), particle agglutination (PA), and rapid tests for HIV screening; if positive in PHCs, the specimen was sent to Provincial Institutes for Health and Environment (PIHEs) for confirmatory testing. A total of 17 PIHEs confirm HIV positive specimen with ELISA, antigen ELISA, PA, and western blot tests. If PIHEs had difficulty in confirming HIV infection, the specimen was sent to the division of AIDS at the KCDC for confirmatory testing. If HIV infection was confirmed, the test results were reported to the division of HIV and TB control at the KCDC and registered as an HIV infection [14].
2.3 Statistical analysis
Annual HIV seroprevalence at PHCs was defined as the number of confirmed HIV-infected individuals per 10,000 HIV-tested persons among suspected TB cases at PHCs each year. Trends in HIV seroprevalence were assessed through a series of cross-sectional annual analyses. The testing frequency of each individual in a single year is referred to as the repeated number. We analyzed suspected TB cases and HIV-infected individuals among them at PHCs by gender, age (<20, 20–29, 30–39, 40–49, 50–59, ≥60), nationality (Korean, foreigner) and region (metropolis, smaller city or rural area). All statistical analyses were performed using SAS 9.3 (SAS Institute Inc., Cary, NC, USA).
3.1 HIV test for suspected TB cases in PHCs by year
From 2001 to 2012, more than 6,000 HIV tests were conducted among suspected TB cases in PHCs each year, but the number of HIV tests was lowest in 2013 (5,526). The number of HIV tests per PHC suspected TB case per year was 1.05 to 1.10 times (Table 1).
3.2 Epidemiological characteristics of HIV test takers among suspected TB cases in public health centers
Table 2 shows HIV test results among suspected TB cases from 2001 to 2013 by gender, age, nationality, and region. From 2005 when HCIS was installed in all PHCs, the number of HIV test takers was highest in 2009 (8,052) and decreased to 5,130 in 2013. Men consistently took 60–69% of the HIV tests. Those aged 20–29 took the most HIV tests from 2001–2006, but since 2007 those aged 60 and above have taken the most HIV tests. Since the mid-2000s, 20s and 30s have gradually decreased but 50s and 60s increased. Most HIV test takers were Korean. Foreign suspected TB cases increased from 0.1 percent in 2001 to 8.2 percent in 2013. Regional distribution has also changed; those living in a metropolitan area contributed the most testing initially (54.7%), but decreased to 39.7% in 2013.
3.3 Characteristics of HIV infection and trends of HIV seroprevalence among suspected TB cases
In Table 3, characteristics of HIV infection among suspected TB cases in PHCs were summarized. A total of 32 HIV-infected individuals were identified from 2001 to 2013, and the vast majority (94%) were men. Most of the infections occurred in those aged 30–49. There were 30 Koreans (94%), and more than half (53%) of HIV cases were identified in metropolitan areas. The annual HIV seroprevalence among suspected TB cases decreased from 8.2 per 10,000 persons in 2001 to 1.9 per 10,000 persons in 2013 (Figure 1).
PHCs conducted about 6,000 HIV tests among suspected TB cases every year, and most of them were men (66%). During this period (2001–2013), 32 suspected TB cases tested positive for HIV infection in PHCs; the majority of them were men (94%) and aged 30–49 (69%). HIV seroprevalence decreased from 8.2 per 10,000 person to 1.9 per 10,000 person in 2013.
The seroprevalence reported here (among suspected TB cases) is similar to the overall seroprevalence (all HIV tests) in PHCs up to 2009; however, in the past 3 years, the seroprevalence reported among suspected TB cases has decreased more than the overall seroprevalence. Inmates have also been recommended to take HIV tests; HIV seroprevalence was higher until 2005, but was similar since 2006 [15]. The gender ratio of HIV seroprevalence in men to women was 15 to 1. According to a previous study on TB and HIV infection in Korea, HIV infection among TB patients registered at KCDC from 2001 to 2005 was 6.9 per 10,000 persons. Annual HIV seroprevalence overall was increasing during the same period [9], which was higher than that of suspected TB cases in PHCs.
UNAIDS recommends that TB and HIV treatment management systems be simplified and integrated, because the two infections are often fatal to patients [16]. In the past two years the number of deaths due to co-infection of TB and HIV infection has decreased by 13 percent worldwide, which is attributed to a 45 percent increase of patients taking antiretroviral treatment [16]. To prevent disease progression with co-infection of HIV and TB, the U.S. Centers for Disease Control and Prevention also recommended to periodically test for HIV among not only TB patients but also TB-infection suspected, latent TB infected persons, and contacts of TB patients [17].
There were 124 million TB patients in Korea in 1965. This number decreased to 430,000 persons in 1995 [18], but the decreasing rate of TB patients has slowed due to an ageing population, risk groups and accommodation facilities, increasing multi-drug resistant TB, and sporadic TB outbreaks in small groups such as schools and accommodation facilities [10]. With a decrease in TB incidence in Korea, the proportion of TB patients in high risk groups or socioeconomically susceptible groups increased. Risk groups include the homeless (11 times higher risk), North Korea defectors (10 times higher risk), and inmates of accommodation facilities (2 times higher risk). The TB incidence is high and intensive management is necessary for these groups [19]. TB diagnosis and treatment, including HIV testing in PHCs, is necessary among these groups. Monitoring the scale and characteristics of TB patients in PHCs should also be conducted periodically. This study has identified the size and characteristics of HIV infection among suspected TB cases in PHCs from 2001 to 2013, and this national data can provide a basis for public health policy for infection of HIV and TB.
This study has two limitations. First, the results of this study do not represent HIV seroprevalence among suspected or confirmed TB cases in Korea, because the data were from HIV test results of suspected TB cases in PHCs. Second, in-depth analysis of TB on past treatment history such as confirmed, relapse, first time treatment, and treatment failure was not conducted, because no information of this type was available.
The authors declare no conflicts of interest.
Acknowledgements
This study was supported by two funds (091-4800-4842-302 and 2006-N5100-00) from the Korea Centers for Disease Control and Prevention.

This is an Open Access article distributed under the terms of the Creative Commons Attribution Non-Commercial License (http://creativecommons.org/licenses/by-nc/3.0) which permits unrestricted non-commercial use, distribution, and reproduction in any medium, provided the original work is properly cited.

  • 1. Joint United Nations Programme on HIV/Acquired Immune Deficiency Syndrome (UNAIDS) . Fact sheet 2014. 2014. UNAIDS; Geneva, Switzerland: [Internet]. Available from:. http://www.unaids.org/en/resources/campaigns/2014/2014gapreport/factsheet. [accessed 16.11.14].
  • 2. Getahun H., Gunneberg C., Granich R.. HIV infection associated tuberculosis: the epidemiology and the response. Clin Infect Dis 50(Suppl. 3). 2010;S201−S207. PMID: 20397949.ArticlePubMed
  • 3. Selwyn P.A., Hartel D., Lewis V.A.. A prospective study of the risk of tuberculosis among intravenous drug users with human immunodeficiency virus infection. N Eng J Med 320:1989;545−550.Article
  • 4. Korea Center for Disease Control and Prevention . Annual report on the notified tuberculosis in Korea 2013. 2013. KCDC; Osong: p 10.
  • 5. Korea Center for Disease Control and Prevention (KCDC) . 2013 Guidelines for the control of tuberculosis. 2013. KCDC; Osong: p 6.
  • 6. Korea Center for Disease Control and Prevention (KCDC) . Annual report on the notified HIV/AIDS in Korea 2012. 2013. KCDC; Osong: p 8.
  • 7. Kim J.M., Cho G.J., Hong S.K.. Epidemiology and clinical features of HIV infection/AIDS in Korea. Yonsei Med J 44(3). 2003 Jun;363−370. PMID: 12833572.ArticlePubMed
  • 8. Oh M.D., Park S.W., Kim H.B.. Spectrum of opportunistic infections and malignancies in patients with human immunodeficiency virus infection in South Korea. Clin Infect Dis 29(6). 1999 Dec;1524−1528. PMID: 10585807.ArticlePubMed
  • 9. Lee C.H., Hwang J.Y., Oh D.K.. The burden and characteristics of tuberculosis/human immunodeficiency virus (TB/HIV) in South Korea: a study from a population database and a survey. BMC Infect Dis 10:2010 Mar;66PMID: 20226025.ArticlePubMed
  • 10. Korea Center for Disease Control and Prevention (KCDC) . Disease control white paper 2012. 2013. KCDC; Osong: p 80.
  • 11. Lee J.H., Hong K.J., Wang J.S.. Estimation of hospital-based HIV seroprevalence as a nationwide scale by novel method; 2002-2008 in Korea. BMC Public Health 10:2010 Nov;739PMID: 21114869.ArticlePubMed
  • 12. Korea Center for Disease Control and Prevention (KCDC) . 2013 Guidelines for the control of tuberculosis. 2013. KCDC; Osong: p 25.
  • 13. Korea Center for Disease Control and Prevention (KCDC) . 2013 Guidelines for the control of HIV/AIDS. 2013. KCDC; Osong: pp 36−37.
  • 14. Korea Center for Disease Control and Prevention (KCDC) . 2013 Guidelines for the control of HIV/AIDS. 2013. KCDC; Osong: p 72.
  • 15. Kee M.K., Lee J.H., Wang J.. Ten-year trends in HIV prevalence among visitors to public health centers under the National HIV Surveillance System in Korea, 2000 to 2009. BMC Public Health 12:2012 Sep;831PMID: 23020818.ArticlePubMed
  • 16. Joint United Nations Programme on HIV/Acquired Immune Deficiency Syndrome (UNAIDS) . UNAIDS and the Stop TB Partnership join forces to stop HIV/TB deaths. 2012. UNAIDS; Geneva, Switzerland: Available from:. http://www.unaids.org/en/resources/presscentre/pressreleaseandstatementarchive/2012/november/20121127prstoptb. [accessed 15.11.14].
  • 17. Centers for Disease Control and Prevention (CDC) . Recommendations for human immunodeficiency virus (HIV) screening in tuberculosis (TB) clinics. 2012. CDC; Atlanta, GA: Available from:. http://www.cdc.gov/tb/publications/factsheets/testing/HIVscreening.htm. [accessed 15.11.14].
  • 18. Ministry of Health and Welfare, Korean National Tuberculosis Association . Report on the 7th tuberculosis prevalence survey in Korea 1995. 1996. Ministry of Health & Welfare, Korean National Tuberculosis Association; Seoul, Korea.
  • 19. Ministry of Health and Welfare, Korean National Tuberculosis Association . Korean National Tuberculosis Association health examination. 2007. Ministry of Health and Welfare, Korean National Tuberculosis Association; Seoul, Korea.
Figure 1
The trend in human immunodeficiency virus seroprevalence in suspected tuberculosis cases at public health centers during 2001–2013 in Korea. HIV seroprevalence is presented as the number of confirmed HIV-infected individuals per 10,000 HIV-tested individuals among suspected tuberculosis cases at public health centers every year. HIV = human immunodeficiency virus.
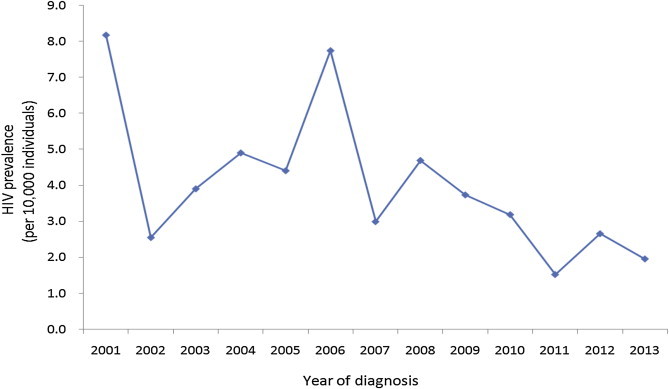
gr1
Table 1
Human immunodeficiency virus testing of suspected tuberculosis patients in public health centers during 2001–2013 in Korea.
Year Total
HCIS
Frequency of testc
No. of HIV testsa No. of PHCs No. of HIV tests No. of HCISb
2001 7,617 215 4,039 (53) 114 1.10
2002 6,385 222 4,314 (68) 150 1.10
2003 6,905 222 5,785 (84) 186 1.13
2004 6,902 225 6,442 (93) 210 1.05
2005 7,411 246 7,411 (100) 246 1.09
2006 8,280 251 8,280 (100) 251 1.07
2007 7,181 251 7,181 (100) 251 1.07
2008 6,749 253 6,749 (100) 253 1.05
2009 8,580 253 8,580 (100) 253 1.07
2010 6,758 253 6,758 (100) 253 1.07
2011 7,053 253 7,053 (100) 253 1.07
2012 7,982 254 7,982 (100) 254 1.06
2013 5,526 253 5,526 (100) 253 1.08

HCIS = Health Care Information System; HIV = human immunodeficiency virus; PHC = public health center.

a “Total no. of HIV” is the number of tests collected by the HCIS, which included documentation from PHCs.

b “No. of HCIS” is the number of PHCs with HCIS.

c Frequency of test” is the number of HIV tests per PHC visitor per year.

Table 2
Characteristics of the trends of human immunodeficiency virus test takers among suspected tuberculosis cases in public health centers during 2001–2013 in Korea.
2001
2002
2003
2004
2005
2006
2007
2008
2009
2010
2011
2012
2013
N (%) N (%) N (%) N (%) N (%) N (%) N (%) N (%) N (%) N (%) N (%) N (%) N (%)
Total 3,675 3,933 5,134 6,132 6,822 7,759 6,705 6,405 8,052 6,292 6,599 7,550 5,130
Sex
 Male 2,514 (68.4) 2,693 (68.5) 3,586 (69.8) 4,231 (69.0) 4,676 (68.5) 5,154 (66.4) 4,565 (68.1) 4,266 (66.6) 5,314 (66.0) 4,110 (65.3) 4,130 (62.6) 4,600 (60.9) 3,290 (64.1)
 Female 1,161 (31.6) 1,240 (31.5) 1,548 (30.2) 1,901 (31.0) 2,146 (31.5) 2,605 (33.6) 2,140 (31.9) 2,139 (33.4) 2,738 (34.0) 2,182 (34.7) 2,469 (37.4) 2,950 (39.1) 1,840 (35.9)
Age (y)
 <20 387 (10.5) 347 (8.8) 430 (8.4) 608 (9.9) 677 (9.9) 777 (10.0) 848 (12.6) 936 (14.6) 1,123 (13.9) 840 (13.4) 988 (15.0) 1,605 (21.3) 903 (17.6)
 20–29 935 (25.4) 1,062 (27.0) 1,492 (29.1) 1,435 (23.4) 1,703 (25.0) 1,891 (24.4) 1,485 (22.1) 1,248 (19.5) 1,601 (19.9) 1,121 (17.8) 1,070 (16.2) 1,015 (13.4) 952 (18.6)
 30–39 624 (17.0) 646 (16.4) 1,004 (19.6) 1,228 (20.0) 1,167 (17.1) 1,399 (18.0) 1,134 (16.9) 1,044 (16.3) 1,313 (16.3) 986 (15.7) 1,003 (15.2) 958 (12.7) 624 (12.2)
 40–49 551 (15.0) 588 (15.0) 750 (14.6) 956 (15.6) 1,063 (15.6) 1,208 (15.6) 949 (14.2) 971 (15.2) 1,209 (15.0) 1,005 (16.0) 1,067 (16.2) 1,097 (14.5) 725 (14.1)
 50–59 409 (11.1) 451 (11.5) 523 (10.2) 697 (11.4) 739 (10.8) 803 (10.3) 790 (11.8) 765 (11.9) 970 (12.0) 851 (13.5) 1,027 (15.6) 1,196 (15.8) 753 (14.7)
 60 or older 769 (20.9) 839 (21.3) 935 (18.2) 1,208 (19.7) 1,473 (21.6) 1,681 (21.7) 1,499 (22.4) 1,441 (22.5) 1,836 (22.8) 1,489 (23.7) 1,444 (21.9) 1,679 (22.2) 1,173 (22.9)
Nationality
 Korean 3,672 (99.9) 3,922 (99.7) 4,614 (89.9) 5,775 (94.2) 6,725 (98.6) 7,376 (95.1) 6,486 (96.7) 6,261 (97.8) 7,206 (89.5) 5,877 (93.4) 6,020 (91.2) 7,112 (94.2) 4,710 (91.8)
 Foreign 3 (0.1) 11 (0.3) 520 (10.1) 357 (5.8) 97 (1.4) 383 (4.9) 219 (3.3) 144 (2.2) 846 (10.5) 415 (6.6) 579 (8.8) 438 (5.8) 420 (8.2)
Region
 Metropolis 2,011 (54.7) 2,131 (54.2) 2,651 (51.6) 2,896 (47.2) 3,289 (48.2) 3,605 (46.5) 3,791 (56.5) 3,289 (51.4) 3,617 (44.9) 2,702 (42.9) 2,480 (37.6) 2,638 (34.9) 2,037 (39.7)
 Small city or rural area 1,664 (45.3) 1,802 (45.8) 2,483 (48.4) 3,236 (52.8) 3,533 (51.8) 4,154 (53.5) 2,914 (43.5) 3,116 (48.6) 4,435 (55.1) 3,590 (57.1) 4,119 (62.4) 4,912 (65.1) 3,093 (60.3)
Table 3
Characteristics of human immunodeficiency virus-infected individuals among suspected tuberculosis cases in public health centers in Korea (2001–2013).
N (%)
Total 32 (100)
Sex
 Men 30 (93.8)
 Women 2 (6.2)
Age (y)
 <20 0 (0.0)
 20–29 3 (9.4)
 30–39 11 (34.4)
 40–49 11 (34.4)
 50–59 5 (15.6)
 60 or older 2 (6.2)
Nationality
 Korean 30 (93.8)
 Foreign 2 (6.2)
Region
 Metropolis 17 (53.1)
 Small city or rural area 15 (46.9)

Figure & Data

References

    Citations

    Citations to this article as recorded by  
    • Is Tuberculosis Still the Number One Infectious Disease in Korea?
      Hae-Wol Cho, Chaeshin Chu
      Osong Public Health and Research Perspectives.2014; 5: S1.     CrossRef

    • PubReader PubReader
    • Cite
      Cite
      export Copy
      Close
    • XML DownloadXML Download
    Figure

    PHRP : Osong Public Health and Research Perspectives