Corrigendum to “Associations between Social and Physical Environments, and Physical Activity in Adults from Urban and Rural Regions”[Osong Public Health Res Perspect 2018;9(1):16–24]
Article information
Osong Public Health Res Perspect. 2018;9(5):283-285
aDepartment of Nursing, College of Health Science, Cheongju University, Cheongju, Korea
bDepartment of Nursing, Sangmyung University, Cheonan, Korea
*Corresponding author: Hye Sun Hyun, Department of Nursing, Sangmyung University, Cheonan, Korea, E-mail:
hshyun76@gmail.com
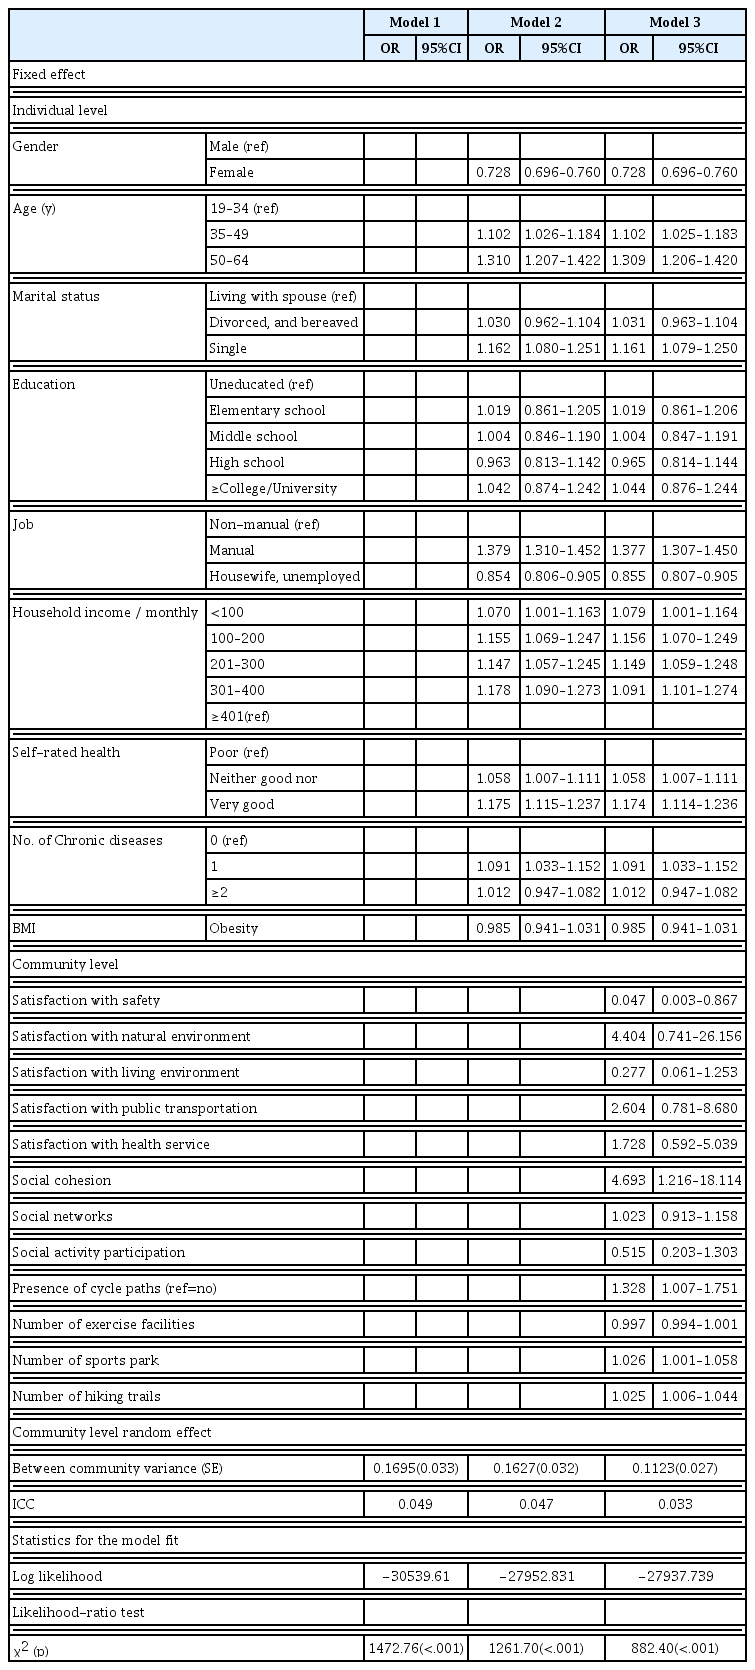
The authors regret to report that in the original paper [1], the OR and 95% CI values of the individual level variables in are missing. Furthermore, the OR values and 95% CI values of individual and community level variables are missing or incorrectly presented in .
Effects of individual and community level factors upon moderate or vigorous physical activity: a multilevel analysis; urban.
Effects of individual and community level factors upon moderate or vigorous physical activity: a multilevel analysis; rural.
The authors would like to apologize for any inconvenience caused.
References
1. Kim BJ, Hyun HS. Associations between Social and Physical Environments,and Physical Activity in Adults from Urban and Rural Regions. Osong Public Health Res Perspect 2018;9(1):16–24.
10.24171/j.phrp.2018.9.1.04. 29503801. 5831682.
Article information Continued
Copyright ©2018, Korea Centers for Disease Control and Prevention
Table 4
Effects of individual and community level factors upon moderate or vigorous physical activity: a multilevel analysis; urban.
|
Model 1 |
Model 2 |
Model 3 |
| OR |
95%CI |
OR |
95%CI |
OR |
95%CI |
| Fixed effect |
|
| Individual level |
|
| Gender |
Male (ref) |
|
|
|
|
|
|
| Female |
|
|
0.675 |
0.653–0.696 |
0.675 |
0.653–0.697 |
|
| Age (y) |
19–34 (ref) |
|
|
|
|
|
|
| 35–49 |
|
|
1.033 |
0.988–1.081 |
1.033 |
0.988–1.080 |
| 50–64 |
|
|
1.295 |
1.299–1.364 |
1.295 |
1.229–1.364 |
|
| Marital status |
Living with spouse (ref) |
|
|
|
|
|
|
| Divorced, and bereaved |
|
|
1.086 |
1.028–1.147 |
1.086 |
1.028–1.363 |
| Single |
|
|
1.377 |
1.314–1.443 |
1.376 |
1.313–1.442 |
|
| Education |
Uneducated (ref) |
|
|
|
|
|
|
| Elementary school |
|
|
1.019 |
0.861–1.205 |
1.019 |
0.861–1.206 |
| Middle school |
|
|
1.004 |
0.846–1.190 |
1.004 |
0.847–1.191 |
| High school |
|
|
0.963 |
0.813–1.142 |
0.965 |
0.814–1.144 |
| ≥College/University |
|
|
1.042 |
0.874–1.242 |
1.044 |
0.876–1.244 |
|
| Job |
Non-manual (ref) |
|
|
|
|
|
|
| Manual |
|
|
1.077 |
1.034–1.121 |
1.078 |
1.035–1.122 |
| Housewife, unemployed |
|
|
1.022 |
0.985–1.059 |
1.022 |
0.985–1.059 |
|
| Household income / monthly |
<100 |
|
|
1.129 |
1.041–1.224 |
1.129 |
1.040–1.224 |
| 100–200 |
|
|
1.075 |
0.993–1.164 |
1.075 |
0.993–1.164 |
| 201–300 |
|
|
1.171 |
1.081–1.268 |
1.170 |
1.080–1.267 |
| 301–400 |
|
|
1.176 |
1.088–1.269 |
1.175 |
1.088–1.268 |
| ≥401(ref) |
|
|
|
|
|
|
|
| Self-rated health |
Poor (ref) |
|
|
|
|
|
|
| Neither good nor |
|
|
1.098 |
1.059–1.138 |
1.097 |
1.059–1.138 |
| Very good |
|
|
1.217 |
1.169–1.267 |
1.217 |
1.169–1.266 |
|
| No. of Chronic diseases |
0 (ref) |
|
|
|
|
|
|
| 1 |
|
|
1.040 |
0.995–1.086 |
1.040 |
0.995–1.086 |
| ≥2 |
|
|
0.916 |
0.865–0.969 |
0.916 |
0.865–0.969 |
|
| BMI |
Obesity |
|
|
0.974 |
0.939–1.009 |
0.974 |
0.939–1.009 |
|
| Community level |
|
| Satisfaction with safety |
|
|
|
|
1.362 |
0.256–5.941 |
|
| Satisfaction with natural environment |
|
|
|
|
0.446 |
0.159–1.378 |
|
| Satisfaction with living environment |
|
|
|
|
2.596 |
0.382–17.314 |
|
| Satisfaction with public transportation |
|
|
|
|
2.829 |
1.001–7.223 |
|
| Satisfaction with health service |
|
|
|
|
0.927 |
0.357–2.288 |
|
| Social cohesion |
|
|
|
|
0.660 |
0.308–1.477 |
|
| Social networks |
|
|
|
|
0.969 |
0.876–1.072 |
|
| Social activity participation |
|
|
|
|
2.534 |
0.768–14.318 |
|
| Presence of cycle paths (ref=no) |
|
|
|
|
0.993 |
0.815–1.148 |
|
| Number of exercise facilities |
|
|
|
|
1.001 |
0.996–1.001 |
|
| Number of sports park |
|
|
|
|
0.978 |
0.960–0.995 |
|
| Number of hiking trails |
|
|
|
|
0.994 |
0.989–0.999 |
|
| Community level random effect |
|
| Between community variance (SE) |
0.1389(0.026) |
0.1406(0.027) |
0.0938(0.022) |
|
| ICC |
0.040 |
0.040 |
0.028 |
|
| Statistics for the model fit |
|
| Log likelihood |
−53990.092 |
−50962.909 |
−50943.399 |
|
| Likelihood-ratio test |
|
|
|
|
| χ2 (p) |
2198.89(<.001) |
2074.46 (<.001) |
1339.29(<.001) |
Table 5
Effects of individual and community level factors upon moderate or vigorous physical activity: a multilevel analysis; rural.
|
Model 1 |
Model 2 |
Model 3 |
| OR |
95%CI |
OR |
95%CI |
OR |
95%CI |
| Fixed effect |
|
| Individual level |
|
| Gender |
Male (ref) |
|
|
|
|
|
|
| Female |
|
|
0.728 |
0.696–0.760 |
0.728 |
0.696–0.760 |
|
| Age (y) |
19–34 (ref) |
|
|
|
|
|
|
| 35–49 |
|
|
1.102 |
1.026–1.184 |
1.102 |
1.025–1.183 |
| 50–64 |
|
|
1.310 |
1.207–1.422 |
1.309 |
1.206–1.420 |
|
| Marital status |
Living with spouse (ref) |
|
|
|
|
|
|
| Divorced, and bereaved |
|
|
1.030 |
0.962–1.104 |
1.031 |
0.963–1.104 |
| Single |
|
|
1.162 |
1.080–1.251 |
1.161 |
1.079–1.250 |
|
| Education |
Uneducated (ref) |
|
|
|
|
|
|
| Elementary school |
|
|
1.019 |
0.861–1.205 |
1.019 |
0.861–1.206 |
| Middle school |
|
|
1.004 |
0.846–1.190 |
1.004 |
0.847–1.191 |
| High school |
|
|
0.963 |
0.813–1.142 |
0.965 |
0.814–1.144 |
| ≥College/University |
|
|
1.042 |
0.874–1.242 |
1.044 |
0.876–1.244 |
|
| Job |
Non-manual (ref) |
|
|
|
|
|
|
| Manual |
|
|
1.379 |
1.310–1.452 |
1.377 |
1.307–1.450 |
| Housewife, unemployed |
|
|
0.854 |
0.806–0.905 |
0.855 |
0.807–0.905 |
|
| Household income / monthly |
<100 |
|
|
1.070 |
1.001–1.163 |
1.079 |
1.001–1.164 |
| 100–200 |
|
|
1.155 |
1.069–1.247 |
1.156 |
1.070–1.249 |
| 201–300 |
|
|
1.147 |
1.057–1.245 |
1.149 |
1.059–1.248 |
| 301–400 |
|
|
1.178 |
1.090–1.273 |
1.091 |
1.101–1.274 |
| ≥401(ref) |
|
|
|
|
|
|
|
| Self-rated health |
Poor (ref) |
|
|
|
|
|
|
| Neither good nor |
|
|
1.058 |
1.007–1.111 |
1.058 |
1.007–1.111 |
| Very good |
|
|
1.175 |
1.115–1.237 |
1.174 |
1.114–1.236 |
|
| No. of Chronic diseases |
0 (ref) |
|
|
|
|
|
|
| 1 |
|
|
1.091 |
1.033–1.152 |
1.091 |
1.033–1.152 |
| ≥2 |
|
|
1.012 |
0.947–1.082 |
1.012 |
0.947–1.082 |
|
| BMI |
Obesity |
|
|
0.985 |
0.941–1.031 |
0.985 |
0.941–1.031 |
|
| Community level |
|
| Satisfaction with safety |
|
|
|
|
0.047 |
0.003–0.867 |
|
| Satisfaction with natural environment |
|
|
|
|
4.404 |
0.741–26.156 |
|
| Satisfaction with living environment |
|
|
|
|
0.277 |
0.061–1.253 |
|
| Satisfaction with public transportation |
|
|
|
|
2.604 |
0.781–8.680 |
|
| Satisfaction with health service |
|
|
|
|
1.728 |
0.592–5.039 |
|
| Social cohesion |
|
|
|
|
4.693 |
1.216–18.114 |
|
| Social networks |
|
|
|
|
1.023 |
0.913–1.158 |
|
| Social activity participation |
|
|
|
|
0.515 |
0.203–1.303 |
|
| Presence of cycle paths (ref=no) |
|
|
|
|
1.328 |
1.007–1.751 |
|
| Number of exercise facilities |
|
|
|
|
0.997 |
0.994–1.001 |
|
| Number of sports park |
|
|
|
|
1.026 |
1.001–1.058 |
|
| Number of hiking trails |
|
|
|
|
1.025 |
1.006–1.044 |
|
| Community level random effect |
|
| Between community variance (SE) |
0.1695(0.033) |
0.1627(0.032) |
0.1123(0.027) |
|
| ICC |
0.049 |
0.047 |
0.033 |
|
| Statistics for the model fit |
|
| Log likelihood |
−30539.61 |
−27952.831 |
−27937.739 |
|
| Likelihood-ratio test |
|
|
|
|
| χ2 (p) |
1472.76(<.001) |
1261.70(<.001) |
882.40(<.001) |