Developing the High-Risk Drinking Scorecard Model in Korea
Article information
Abstract
Objectives
This study aimed to develop a high-risk drinking scorecard using cross-sectional data from the 2014 Korea Community Health Survey.
Methods
Data were collected from records for 149,592 subjects who had participated in the Korea Community Health Survey conducted from 2014. The scorecard model was developed using data mining, a scorecard and points to double the odds approach for weighted multiple logistic regression.
Results
This study found that there were many major influencing factors for high-risk drinkers which included gender, age, educational level, occupation, whether they received health check-ups, depressive symptoms, over-moderate physical activity, mental stress, smoking status, obese status, and regular breakfast. Men in their thirties to fifties had a high risk of being a drinker and the risks in office workers and sales workers were high. Those individuals who were current smokers had a higher risk of drinking. In the scorecard results, the highest score range was observed for gender, age, educational level, and smoking status, suggesting that these were the most important risk factors.
Conclusion
A credit risk scorecard system can be applied to quantify the scoring method, not only to help the medical service provider to understand the meaning, but also to help the general public to understand the danger of high-risk drinking more easily.
Introduction
Moderate alcohol consumption is generally known to reduce the risk of ischemic heart disease [1,2]. However, alcohol consumption has been recognized as one of the major risk factors of preventable mortality and morbidity. Binge drinking and heavy drinking have been associated with violence, poor management of diabetes, neurological damage, hypertension, hepatitis, gastrointestinal and heart disease, liver cirrhosis, cancers such as oral, rectal, and liver cancer, stroke, and alcohol dependence [3–5]. The 2016 Korea National Health and Nutrition Examination Survey [conducted by the Korea Centers for Disease Control and Prevention (KCDC)] revealed rates of monthly alcohol consumption and high-risk drinking of 61.9% and 13.8%, respectively. This rate of high-risk drinking is very high compared to the rates reported by the World Health Organization for Africa (5.7%), the Americas (13.7%), the Eastern Mediterranean (0.1%), Europe (16.5%), South-East Asia (1.6%), and the Western Pacific Region (7.7%) [6]. In addition, many longitudinal studies in Korea have focused on the health effects of alcohol drinking [7–9].
Many recent studies have found that age, income level, employment status, smoking status, obesity, subjective assessment of health, and presence of spouse are all related to high-risk drinking [10,11]. Previous studies ranged from small scale sample surveys which were designed and surveyed individually, to large scale sample surveys which were collected the nationally. Some studies involved individuals exposed to high-risk drinking thus were a group that needs an improvement of drinking culture the most. Logistic regression analysis was the preferred method of most studies to detect risk factors for high-risk drinking. However, there was a difficulty in interpreting the results of high-risk drinking predictions, generally or utilizing it in medical service.
The purpose of this study was to develop a predictive model of high-risk drinking in Korea using data mining. Scorecards for high-risk drinking may be used by employing the developed prediction model.
Materials and Methods
1. Study design
This study was a secondary analysis of data that was collected in a nationally representative cross sectional and population-based survey conducted by the KCDC. The overall framework of this study is shown in Figure 1.

Framework of the study.
KCHS = Korea Community Health Survey; PDO = point to double the odds.
2. Subjects
This study was based on data acquired in the Korea Community Health Survey (KCHS) from 2014. The KCHS is a national health survey conducted since 2008 to provide population-based estimates of health indicators to be used for the development and assessment of public health policies and programs. The 2014 KCHS used a multistage sampling design to obtain a representative sample of adults aged 19 years or older. Those aged 19 years or older were initially selected. Subjects who did not respond to the questionnaires about sociodemographic variables and health-related variables were excluded. After exclusion criteria were applied, 149,592 subjects were included in the final analysis.
3. Study variables
The target variable in this study was the alcohol consumption pattern. Any person who had drunk any kind of alcoholic beverage during the past year was classified as a current drinker and was asked more questions on the quantity consumed in a typical day and the drinking frequency. “High-risk” was defined as the male respondents who consumed more than 7 drinks twice a week or more, as well as female respondents who consumed more than 5 drinks twice a week or more. All others were defined as “normal.”
For the comprehensive analysis of the various factors associated with high-risk alcohol consumption, health behaviors, sociodemographic variables, and self-rated health status, including mental health, were selected as independent variables. The sociodemographic variables were gender, age, marital status, monthly household income, education level, and occupation. The lifestyle and health-related variables were over-moderate physical activity (participated in moderate physical activity for 5 days or more per week, and for 30 minutes or more per activity, or in vigorous activity for 3 days or more per week, and for 20 minutes or more per activity), eating a breakfast regularly, current smoking status, health check-ups during the past 2 years (proxy variable indication for interest on self-health care [12–14]), experience of depression (yes, no), subjective health status (good, bad), subjective stress recognition (yes, no), and obesity status (Table 1).

Data description in the analysis.
4. Statistical analysis
Data analysis, predictive model and scorecard development were performed with SAS version 9.4. In order to calculate the total population that the sample would represent, the stratification variables and sampling weights designated by the KCDC were employed. All data were described as unweighted frequency, and weighted percentage. χ2-test for categorical variables were performed. The high-risk drinking predictive model was built on the training set and tested the validity of the models on the validation set. The data set was divided into the training data set (60%) and the validation data set (40%). The training set contained 90,015 cases (60%) represented by 73,250 normal cases and 16,765 high-risk cases. The validation set comprised 59,577 cases (40%), divided into 48,512 normal cases and 11,065 high-risk cases.
In this study, the weighted multiple logistic regression model was employed to develop the high-risk predictive model and a predictive scorecard was suggested for high-risk drinkers using a developed model.
Results
1. Differences in variables by target groups
Table 2 shows the key input variables used in the analysis by target groups. Of the 149,592 Korean adults, 27,830 (18.6%) participants were in the high-risk group and 121,762 (81.4%) participants were in the normal group. Significant differences between the 2 groups were observed in sociodemographic factors. The percentage of male participants in the high-risk group was 83.7% and 49.7% in the normal group. In the high-risk group, there were significantly higher numbers of participants who were between 40–49 years old and who were high school graduates compared with the normal group. The biggest proportion of the high-risk group was participants employed in elementary work (30.9%), while the biggest proportion of the normal group had a different employment status [unemployed, full-time student, soldier (33.3%)]. Table 2 also provides a breakdown of the proportion in both groups depending on whether they received health checkups during the prior 2 years, or they participated in over-moderate physical activity, or they were stressed. In addition, the percentage of current smokers in the high-risk group was higher than in the normal group [21.3% normal group, 51.5% high-risk group (Table 2)].
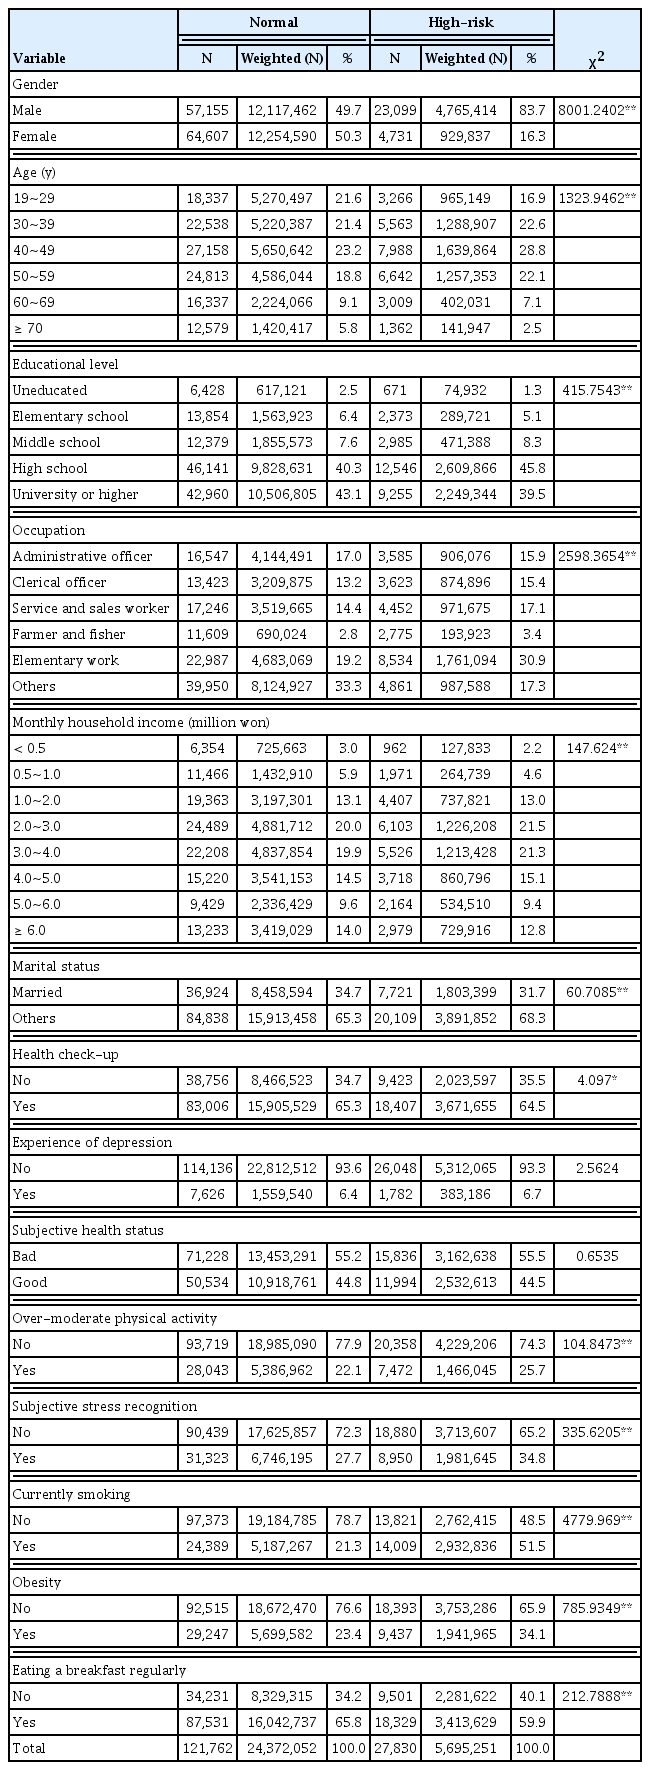
Descriptive characteristics for the variables in the analysis.
2. Model building and performance
The data set was divided into the training set (60%) and the validation set (40%). The models on the training set were built and the validity of the models on the validation set were tested. The performance of the developed model was evaluated with respect to discrimination using the area under a receiver operating characteristic (ROC) curve, misclassification rate, and Kolmogorov-Smirnov statistics (Table 3).
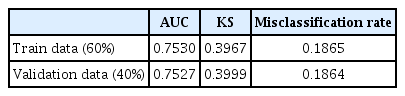
AUC, Kolmogorov-Smirnov statistics, and misclassification rate for the predictive model.
The ROC charts are graphical displays that give the global measure of the predictive accuracy of the model (Figure 2). They display the sensitivity against 1-specificity of a classifier for a range of cut-offs. Sensitivity is a measure of accuracy for predicting events that is equal to the true positive divided by the total actual positive. 1-specificity is a measure of accuracy for predicting non-events that is equal to the true negative divided by the total actual negative. The performance of the models is demonstrated by the degree to which the ROC curves push up and to the left. The area under the curves can provide a quantitative performance measure. The area will range from 0.5, for a worthless model, to 1, for a perfect classifier. The shapes of the ROC curves indicate that the predictive power of the model for predicting high-risk and normal is reasonably good (Figure 2).
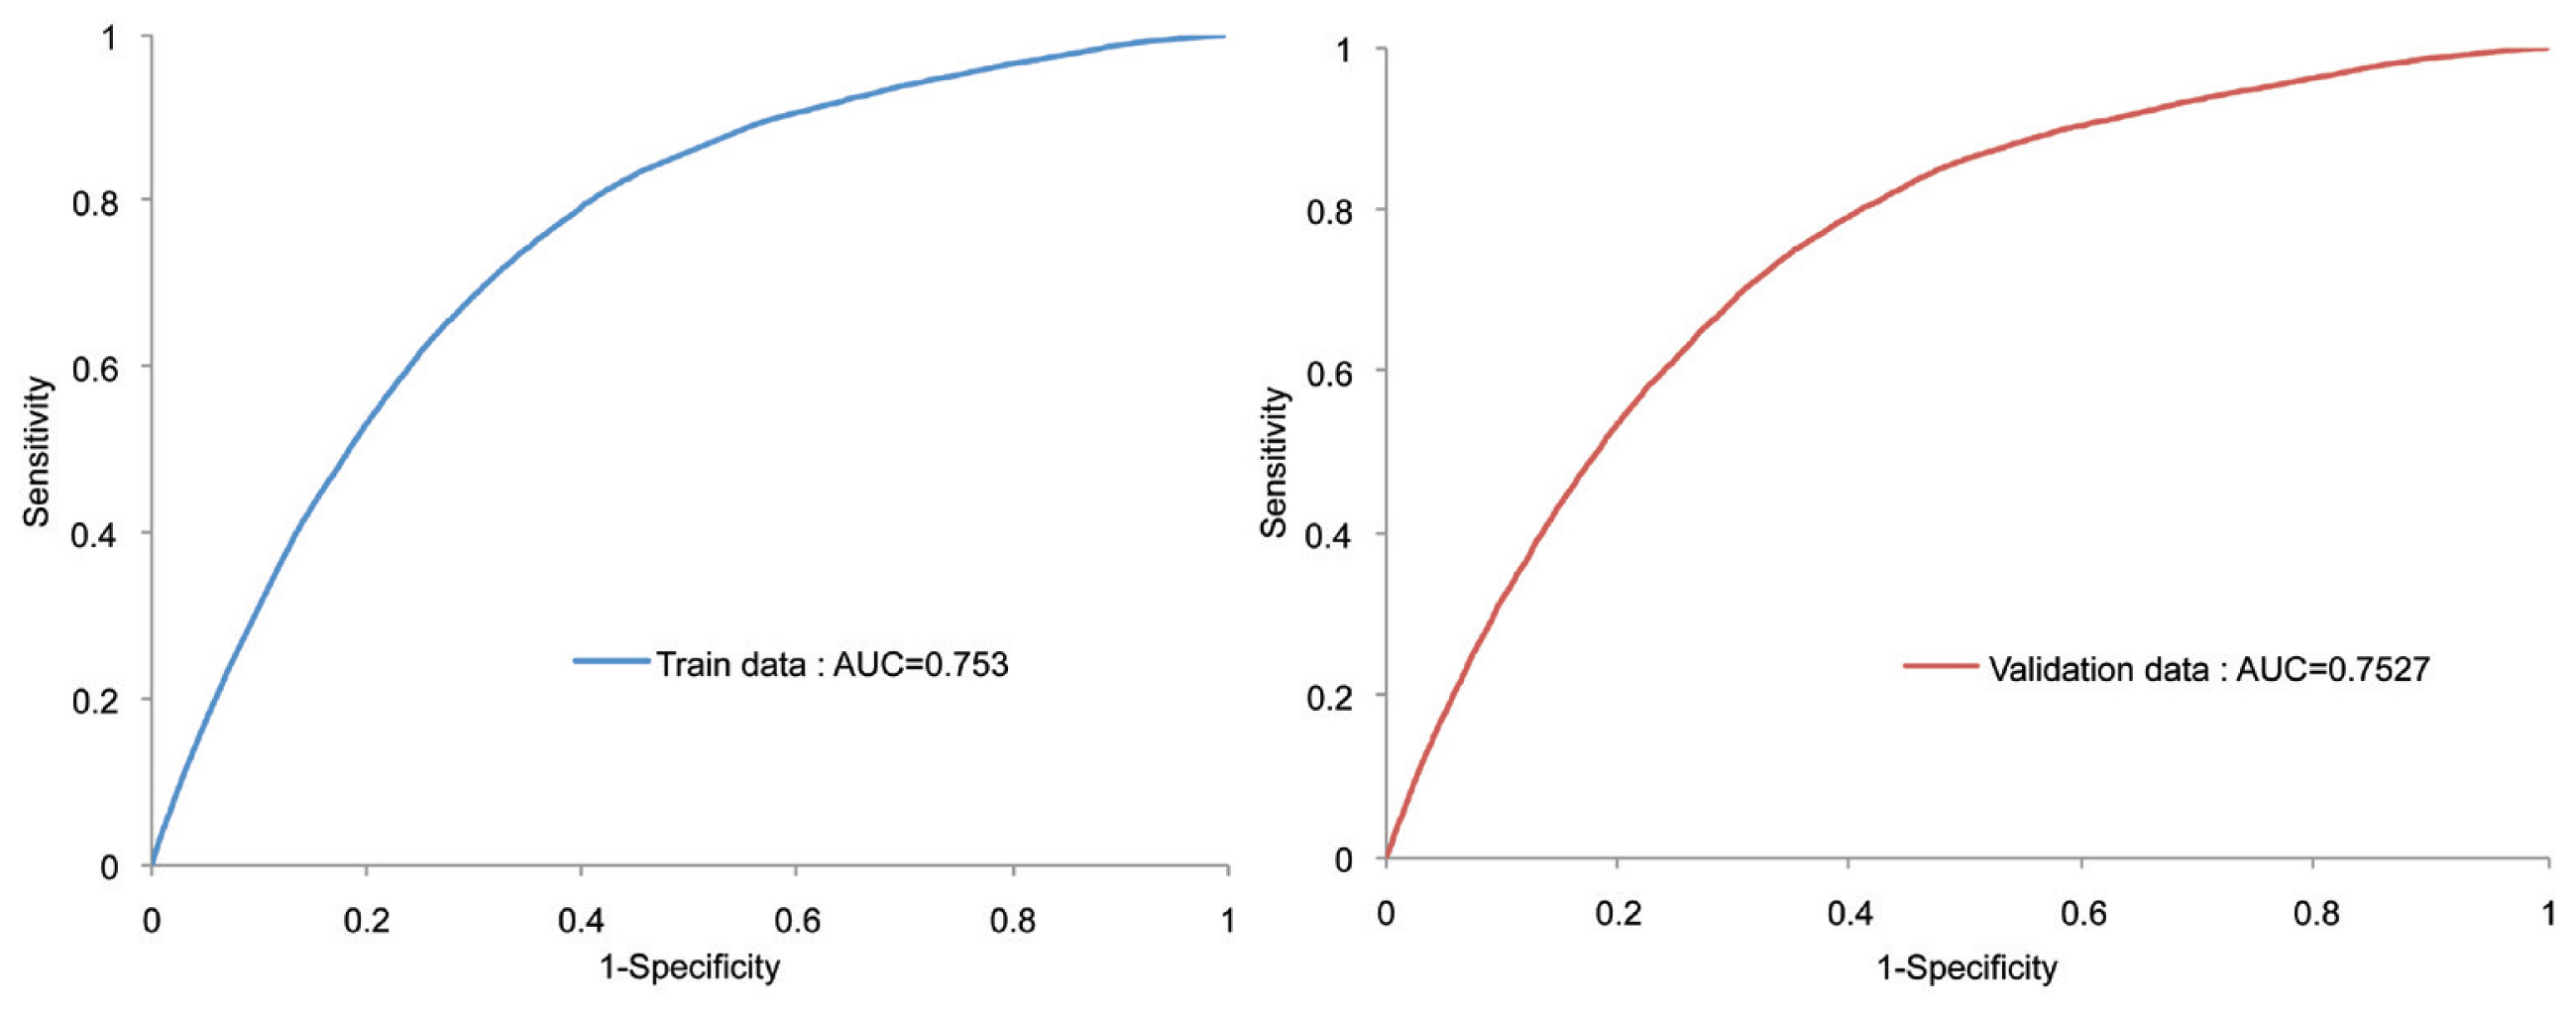
ROC curve for the predictive model.
AUC = area under the curve; ROC = receiver operating curve.
Table 4 provides the parameter estimates of the risk prediction model for falling into high-risk group. The weighted logistic regression estimates revealed that men were significantly more likely to belong to high-risk group than women (p < 0.01). The parameter estimate for age groups showed that participants between the ages of 30 and 59 years old were significantly more likely to belong to a high-risk group than those aged under 29 (p < 0.01). Participants who had graduated from high school or had a lower level of education, were significantly more likely to belong to the high-risk group than those who had graduated from university or had a higher qualification (p < 0.01). Participants who worked in business, sales and related occupations were significantly more likely to belong to the high-risk group than administrative employees (p < 0.01). The ORs of those participating in over-moderate physical activity was higher than those without over-moderate physical activity. The ORs of person who had at least one of the following factors (smoking, depression experience, and stress relative to their reference group) were significantly higher [p < 0.01 (Table 4)].

Result of weighted logistic regression analysis.
3. Scorecard development
Scorecards for high-risk drinking were evaluated using the developed prediction model. In this study, the concept of point to double the odds (PDO), which is the most widely used scaling in the credit risk industry. For example, if PDO is set at 20, the odds of the person who receives 520 points through this method is twice as likely as those of the person who has 500 points. To make the scorecard, the adjusted coefficient was calculated by subtracting the smallest regression coefficient estimate from the assumed coefficient estimates of each variable to make the adjusted coefficient greater than or equal to zero. Then, the appropriate PDO was determined and the corrected regression coefficient transformed linearly into a single score as shown in Equation 1 [15,16].
In this study, PDO was set at 58.43994, and Table 5 showed the result of the scorecard (Table 5).

Result of scorecard.
Table 2 also showed that males (score: 248.0), uneducated participants (score: 110.0), participants under 69 years of age (score: 114.8–186.4), and current smokers (score: 141.8) had scores higher than 100. For example, if an individual belongs in the following categories:
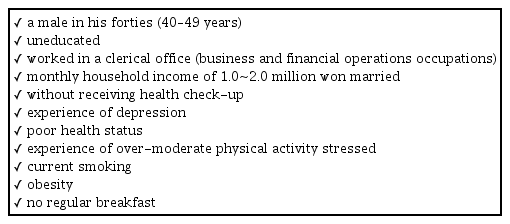
The total score will be 1,000 (248.0 + 186.4 + 110.0 + 83.6 + 19.5 + 7.9 + 17.1 + 33.3 + 7.7 + 15.2 + 39.5 + 141.8 + 51.2 + 38.7) and he will belong to the most high-risk drinking group.
Discussion
The high-risk drinking predictive model was developed in Korea using cross-sectional data from KCHS (2014). A total of 149,592 individuals were included in this study, and the weighted multiple logistic regression model was employed to develop the high-risk drinking predictive model. In addition, a scorecard for high-risk drinking can be used that was designed using the developed prediction model.
This study found that the major influencing factors for being a high-risk drinker were gender, age, educational level, occupation, whether they received health check-up, depressive symptoms, over-moderate physical activity, mental stress, smoking status, obese status, and regular breakfast. These finding were largely consistent with previous studies [17–19]. High-risk drinkers were more likely to be men in their thirties to fifties (30–59 years), or were office or sales workers. In particular, current smokers had an increased likelihood of high-risk drinking. However, monthly household income, marital status, and health status were not significantly related to the risk of falling into the high-risk drinking group in this study.
The results from the scorecard showed that the largest score range were found in the following factors: gender, age, educational level, and smoking status. In addition, the uneducated participants had the highest risk factor score according to the education level, and that of clerical officers was the highest according to the occupation category. For example, a male who is in his forties (40~49 years), uneducated, worked in a clerical office, and currently smoking, will score at least 769.9 points for high-risk drinking. In Korea, individuals with the above-mentioned factors are more likely to become involved in social relationships, which could increase the likelihood of high-risk drinking [11].
A scorecard is mainly used by credit rating agencies to measure consumers’ credit so that the company prevent losses caused by consumers’ activities such as taking loans, issuing credit cards and buying insurance, etc. This scorecard system can be applied, to quantify the scoring method, not only to help medical service providers to understand the meaning, but also to help the general public to understand the dangers of high-risk drinking more easily. In this respect, this study is meaningful. In addition, it can provide a basis for more effective healthcare services such as education to prevent high-risk drinking. In addition to the data used in this study, further refinement of the model by reflecting the local, social environment and geographical factors related to drinking is expected to enable the setting of various measures to solve and prevent high-risk drinking.
Finally, the scorecard modeling methodology will be helpful in measuring and understanding the level of health risk behaviors measured by various statistical models of health education program providers and users besides drinking.
Notes
Conflicts of Interest
All authors declare that they have no conflicts of interest.