Skip Navigation
Skip to contents

PHRP : Osong Public Health and Research Perspectives

OPEN ACCESS
SEARCH
Search

Articles

Page Path
HOME > Osong Public Health Res Perspect > Volume 3(3); 2012 > Article
Articles
Early Detection of Nosocomial Outbreaks Caused by Rare Pathogens: A Case Study Employing Score Prediction Interval
Hiroshi Nishiuraa,b
Osong Public Health and Research Perspectives 2012;3(3):121-127.
DOI: https://doi.org/10.1016/j.phrp.2012.07.010
Published online: June 30, 2012

aSchool of Public Health, University of Hong Kong, Hong Kong

bPRESTO, Japan Science and Technology Agency, Saitama, Japan.

Corresponding author. E-mail: nishiura@hku.hk
• Received: July 23, 2012   • Revised: July 24, 2012   • Accepted: July 25, 2012

Copyright ©2012, Korea Centers for Disease Control and Prevention

This is an Open Access article distributed under the terms of the Creative Commons Attribution Non-Commercial License () which permits unrestricted non-commercial use, distribution, and reproduction in any medium, provided the original work is properly cited.

  • 3,315 Views
  • 20 Download
  • 8 Crossref
  • 8 Scopus
prev next
  • Objectives
    Nosocomial outbreaks involve only a small number of cases and limited baseline data. The present study proposes a method to detect the nosocomial outbreaks caused by rare pathogens, exploiting score prediction interval of a Poisson distribution.
  • Methods
    The proposed method was applied to three empirical datasets of nosocomial outbreaks in Japan: outbreaks of (1) multidrug-resistant Acinetobacter baumannii (n = 46) from 2009 to 2010, (2) multidrug-resistant Pseudomonas aerginosa (n = 18) from 2009 to 2010, and (3) Serratia marcescens (n = 226) from 1999 to 2000.
  • Results
    The proposed method successfully detected all three outbreaks during the first 2 months. Both the model-based and empirically derived threshold values indicated that the nosocomial outbreak of rare infectious disease may be declared upon diagnosis of index case(s), although the sensitivity and specificity were highly variable.
  • Conclusion
    The findings support the practical notion that, upon diagnosis of index patient(s), one should immediately start the outbreak investigation of nosocomial outbreak caused by a rare pathogen. The proposed score prediction interval can permit easy computation of outbreak threshold in hospital settings among healthcare experts.
Nosocomial infection refers to the infection event within medical and healthcare facilities at which medical services for some diseases or health conditions are provided. The nosocomial infection is seen not only among patients but also among patients’ relatives and healthcare workers. Because medical and healthcare facilities involve treatment of a wide spectrum of diseases and thus patients tend to be vulnerable to infectious diseases, less virulent and commonly seen pathogen can often cause nosocomial infection, and moreover, prior antibiotic treatment tends to induce infections caused by antibiotic-resistant bacteria. The nosocomial infection can occur regardless of the size of healthcare facility, and technically it will never be eliminated. However, the nosocomial infection can sometimes influence the prognosis of patients, and so healthcare experts are expected to control an outbreak event by detecting it at the early stage. To investigate and understand the epidemiology of any nosocomial outbreaks, epidemiological surveillance would play a key role [1]. In Japan, the Ministry of Health, Labour, and Welfare has conducted a routine surveillance program of nosocomial infection [2], and each medical facility with an independent clinical laboratory section maintains the system of infectious agent surveillance report through the isolation of causative pathogens from patients’ samples. Given such a system, it is fruitful to fully utilize the information, in particular, by detecting any outbreak during the early stage.
To analyze the community-based surveillance data, various statistical and epidemiological studies on the early detection of community outbreaks have been conducted. Farrington and Andrews [3] comprehensively reviewed representative detection methods for the investigation of the temporal or spatiotemporal incidence data of infectious diseases. In addition to classical statistical modeling approaches, hypothesis testing method for detecting clusters of cases using an objective novel statistic has also been developed [4]. The socalled “scan statistic” has been used for detecting spatiotemporal spread, and substantial revisions and improvements have been made to detect the clusters using a variety of data types [5,6]. Moreover, rather than relying on case data with confirmed diagnosis, eventbased surveillance or the so-called syndromic surveillance has also been explored for the sake of early detection [7].
Nevertheless, the majority of existing study requires us to have historical baseline data for the long time period in order to define an “abnormality” in the data. In other words, to extrapolate a statistical model with trend and seasonality or to employ a time-series technique to analyze the infectious disease data, having sufficient long time-series data in the past would be essential to form the baseline. This condition does not always hold for nosocomial outbreaks caused by rare pathogens. Moreover, except for the detection method of clustering, existing published methods tend to be focused on community-based surveillance data and thus are not always directly applicable to detecting small outbreaks. That is, the issue of early detection of nosocomial outbreaks caused by rare pathogens without substantial baseline incidence has yet to be discussed in a scientifically rigorous manner. The present study aims to propose a simple method for detecting small nosocomial outbreaks caused by rare pathogens, applying it to actual outbreak datasets and assessing the validity of detection.
2.1. Observed data and motivation
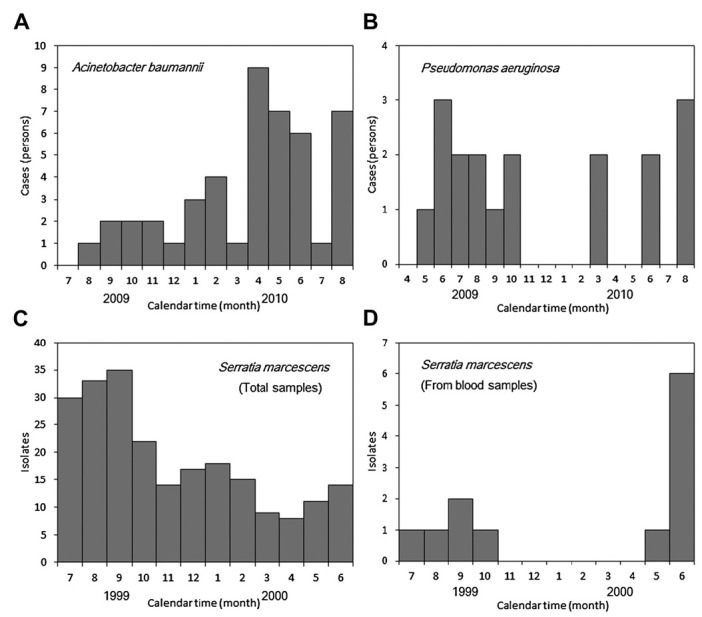
To clearly demonstrate the study motivation, the observed epidemic curves of three nosocomial outbreaks are presented in Figure 1. The outbreak data were retrieved from openly published case notification reports. Figure 1A shows the monthly incidence of multidrug resistant Acinetobacter baumannii (MDRAB) in a tertiary hospital with approximately 1150 beds (n = 46) from 2009 to 2010. While Acinetobacter baumannii is broadly distributed in the environment, its nosocomial infection is known to easily spread from person to person, and thus it is hard to control without substantial effort [8]. Within healthcare facilities, the infection is frequently seen among patients who are intubated for respiratory support, and MDR-AB is known as a key factor to exacerbate respiratory function and elevate the risk of death [8,9]. Figure 1B shows an epidemic curve of a nosocomial outbreak caused by multidrug resistant Pseuedomonas aeruginosa (MDRP) at a secondary hospital with approximately 580 beds (n = 18) from 2009 to 2010. MDRP is frequently isolated from patients staying for the long time and also those requiring surgical management or antibiotic treatment [10]. The extent of transmission is sometimes a single ward scale (e.g., through contaminated handwashing basin), worsening clinical course of infected patients in that particular ward [11]. Figure 1C and D show the monthly counts of Serratia marcescens isolations (n = 226), counting the total samples and isolates only from blood samples at a secondary hospital with 380 beds from 1999 to 2000. Although the isolation of Serratia marcescens has not been rare in this hospital for the long time, especially when we count the total samples (Figure 1C), an abrupt increase in severe cases was observed from May to June 2000 with eight fatal outcomes. Separately counting the samples by anatomical site, isolation from blood samples showed an apparent increase in the corresponding period (Figure 1D), and indeed, many severe cases had experienced septic shock before an outbreak investigation was conducted. Serratia marcescens is commonly isolated from the respiratory and urinary tracts of hospitalized adults and is responsible for catheter-associated bacteremia, urinary tract infections and wound infections. All three diseases have greatly influenced the prognosis of patients, indicating the importance of early detection of the outbreaks and corresponding actions for swift control. If the outbreak can be detected sufficiently early, infected cases within a single ward may be managed together, with particular care for the prevention of further transmission events (e.g., admit and manage cases in the same room) and moreover, nurses
Figure 1.

Monthly incidence of nosocomial outbreaks. (A) Multidrug resistant Acinetobacter baumannii (MDR-AB) in a tertiary hospital with approximately 1150 beds (n= 46) from 2009 to 2010. (B) Multidrug resistant Pseuedomonas aeruginosa (MDRP) at a secondary hospital with approximately 580 beds (n = 18) from 2009 to 2010. (C) Total samples and (D) blood samples of Serratia marcescens (n = 226) at a secondary hospital with 380 beds from 1999 to 2000. The horizontal axis represents the month of diagnosis. Before the observation in the earlier year (i.e., 2009 for A and B, and 1999 for C and D), there was no report of cases since January.

EPHRP1-03-121-g001
and other staffs responsible for infected cases may also be limited to particular persons. In addition, doctors can order additional laboratory testing of other suspicious cases at the early stage, and respiratory function of infected cases can be closely monitored.
In the present study, an outbreak is defined as the occurrence of defined infectious disease cases clearly in excess of the normal expectancy within a certain period of time. This study attempts to detect the outbreak based on monthly counts of cases using a statisticalmodel. In reality, the detection does not have to rely solely on the temporal data. Usually, additional insights are gained from contact information and other risk-associated information (e.g., whether the infection is opportunistic or not), and also from examining the spatiotemporal distribution of cases within a hospital. Moreover,microbiological and clinical findings (e.g., isolation of similar genotypes frommultiple patients) can help demonstrate the transmission events. Among these, the present study specifically focuses on the temporal distribution for two reasons. First, the temporal data are routinely collected even when there is no outbreak. In other words, the temporal counts of bacterial isolations or case notifications would be readily available at any time, and such a dataset should be effectively used for public health purposes. Second, for a rare pathogen, even an occurrence of a single casemay be regarded as an outbreak in practical sense. Then, an outbreak defined by an occurrence of index patient(s) does not practically require rigorous statistical detection. However, issuing an alarm based on a single diagnosis (or diagnosis of the first fewcases) should ideally rest on rigorous scientific grounds, and the present study offers the theoretical basis examining the relevant condition at which one can declare the outbreak caused by rare pathogens.
2.2. Outbreak and prediction interval
Here the outbreak detection is described by equations. To detect an outbreak based on the time series data, the issue of epidemiological detection is conventionally expressed as the hypothesis testing of “aberration” (i.e., if the observed data exceeds a defined threshold) under a certain type I error [3]. That is, using θU to define the upper bound for detecting an outbreak, the observed data Y should satisfy
EPHRP1-03-121-e001.jpg
where α is the probability that normal observation is incorrectly detected as an outbreak and may be interpreted as the risk of false positive alarms (e.g., one may use α = 0.025). The upper bound θU thus acts as the reference value for detection, and this key value should be calculated from the prediction interval, i.e., the expected range within which the population data in future lies. The interpretation of the prediction interval resembles that of the confidence interval (CI): the 95% CI of a sample indicates the “range in which the population data lie at 95% probability,” while the 95% prediction interval represents the range in which the future population data, which cannot be observed at present, lie at 95% probability based on observed data in the past [12]. Let x={xi} be the sample monthly counts of cases based on observation in month i (i = 1,2,.,n) for the length of n months, and let us consider the predicted number of cases y in (n + 1)th month. Then, the interval (L(x), U(x)) which satisfies
EPHRP1-03-121-e002.jpg
is referred to as the 100(1–2α)% prediction interval (L(x), U(x)).
Among the published prediction intervals, the simplest one may be based on an assumption that the population data follow a normal distribution, and this method was actually employed by the Centers for Disease Control and Prevention and applied to various practical settings [13]. Assuming that there is no trend in the occurrence of cases, let the sample average and sample standard error be
EPHRP1-03-121-e013.jpg
and s, respectively. The 100(1–2α)% prediction interval for ((n + 1)th month given past observation for n months is
EPHRP1-03-121-e003.jpg
where z1–α is the 100(1 – α) percentile of the standard normal distribution (e.g., 1.96 for the 95% prediction interval). Although detailed derivation process of (3) is omitted here, this point is discussed in a variety of literature on the interval estimation [13,14].
There are two technical problems in applying the abovementioned prediction interval for three nosocomial outbreaks in Figure 1. First, it is strictly not appropriate to apply normal distribution to the datasets with very small counts. Nevertheless, although the prediction interval of continuous distributions tends to be studied relatively well [15,16], that of discrete distribution has not been often discussed, except for normal approximations by means of the Wald method. Second, the occurrence has been very uncommon due to causation by rare pathogens, and thus, the baseline information is extremely limited. Sometimes, the survey starts only after confirming the diagnosis of index patients.
2.3. Statistical model
Since the occurrence is very rare with very small number of observed cases, the present study ignores the time trend (i.e., assumes stationary process) and employs a Poisson distribution. The transmission dynamics of infectious diseases are theoretically described by the Poisson process, and the resulting number of cases with time in an endemic equilibrium is known to follow a Poisson distribution [17]. In the stationary state, there is no increase or decrease in the number of cases (i.e., the nonstationarity indicates the outbreak). Let X and Y be the random variables representing the cumulative number of cases for n months and the number of cases in (n + 1)th month. It is assumed that X follows a Poisson distribution with an average Xn (where Xn is the observed sample cumulative number), and also that the predicted value in (n + 1)th month similarly follows a Poisson distribution with an average θ. These satisfy the following equation:
EPHRP1-03-121-e004.jpg
To derive the prediction interval, we consider a random variable W that represents the difference between Y in (n + 1)th month and predicted value X/n for (n + 1)th month (i.e., W = Y – X/n). The average of W is obtained from the averages of Y and X/n, i.e.,
EPHRP1-03-121-e005.jpg
The variance of W is calculated as the sum of the variances of Y and X/n:
EPHRP1-03-121-e006.jpg
Standardizing W, we get
EPHRP1-03-121-e007.jpg
Provided that θ and Xn/n are sufficiently large, the probability z asymptotically follows a normal distribution, and we obtain
EPHRP1-03-121-e008.jpg
As we compute the Wald CI, the 100(1 – 2α)% prediction interval based on equation (8) is
EPHRP1-03-121-e009.jpg
where
EPHRP1-03-121-e014.jpg
is equal to Xn/n in the range Xn > 0. If Xn is zero (i.e., no occurrence in the past), an arbitrary small value, e.g., Xn = 0.5, is conventionally adapted for the computation [18]. The approximate prediction interval (9) based on asymptotic normality is referred to as the Nelson prediction interval [19]. It should be noted that the coverage probability of the Wald CI for a normal approximation to the binomial distribution is known to be extremely small when the binomial probability is too close to 0 or 1 [20]. In the case of approximate prediction interval (9) for the Poisson distribution, the coverage probability should also be small for small number of observations, and thus, the applicability of prediction interval (9) may be limited [21]. However, the exact prediction interval is too complex for nonexperts, and moreover, the exact prediction interval of discrete distribution is known not necessarily to yield better coverage probability as compared to approximate ones [20].
Hence, a score prediction interval, which is relevant to Wilson score CI that yields much better coverage probability than the Wald method in equation (9), is derived. The score prediction interval of a binomial distribution has been already proposed in a statistical study and published elsewhere [22]. To derive the score prediction interval of a Poisson distribution, let us consider a joint sampling of X and Y, as if the predicted value of the variance of W in equation (7) is θxy = (X+Y )/(n+1). Namely, we use the following quantity that asymptotically follows a normal distribution:
EPHRP1-03-121-e010.jpg
As mentioned above, no occurrence in the past with Xn = 0 is replaced by Xn = 0.5. The score prediction interval is derived from taking the square of both sides of equation (10) and solving it for Y as a quadratic equation of Y [20,23]. Thus, the 100(1 – 2α)% prediction interval is calculated as:
EPHRP1-03-121-e011.jpg
2.4. Application to nosocomial outbreak data
Using the prediction interval (11), the early detection was attempted for the observed three nosocomial outbreaks. For all three outbreaks, the hospital surveillance had been routinely conducted before the outbreak, and the baseline data were available from January of the corresponding earlier year of observation. As mentioned above, as long as the number of reports in the past remains zero, theoretical cumulative number Xn = 0.5 was used for the computation of the prediction interval. The 1st month at which the observed number exceeded the upper 95% prediction interval was regarded as the month of successful detection.
Subsequently, the detection performance was assessed by employing the receiver operating characteristic curve, which was used for identifying an empirically defined optimal cutoff point to define an outbreak, especially by referring to the Youden index (i.e., sensitivity plus specificity minus 1) [24]. The period of outbreak was defined to be from the 1st month to the last month with reporting of at least one case: August 2009 to August 2010 for MDRAB, May 2009 to March 2010 for MDRP and May–June 2000 for Serratia (although a few earlier cases occurred in summer 1999, they were not clinically serious and were separated from the 2000 outbreak). Using the optimal threshold of monthly case counts, the sensitivity and specificity of outbreak detection were estimated. The 95% CIs of the sensitivity and specificity were computed using normal approximation to the binomial distribution, and similarly, the calculation of the 95% CI of the area under the curve (AUC) was made using the Wald method by means of logit transformation of the AUC.
Figure 2 compares observed and predicted values along with the upper 95% prediction intervals for all three outbreaks. The observed number of cases initially exceeded (and thus, the outbreak was detected) in the 1st month (August 2009) for MDR-AB and the 2nd month forMDRP (June, 2009) and sepsis caused by Serratia marcescens (June, 2000). The calculated upper 95% prediction intervals for these months were 0.97, 1.62, and 1.64 cases for MDR-AB, MDRP, and Serratia, respectively. That is, if we round up the thresholds to the next integer, the proposed method suggests that one should use the cutoff number of 1, 2, and 2 cases to define the outbreak caused by the rare pathogens. If we round down the threshold values that are 1 or greater, all the cutoff values would suggest one case to define the nosocomial outbreak.
Empirical optimal threshold was also estimated to be one case for all three outbreaks. However, the AUC varied by outbreak and were estimated to be 100%, 78.1% (95% CI, 53.7–91.7), and 87.5% (95% CI, 26.4–99.3) for MDR-AB, MDRP, and Serratia, respectively. Since there was no month with zero report during the outbreak of MDR-AB, both the sensitivity and specificity were estimated at 100%. As for MDRP, the specificity was 100%, but the sensitivity was calculated at 56.3% (95% CI, 37.5–81.3%) due to several zero reports during the course of the outbreak. With respect to Serratia marcescens, the sensitivity was 100%, but the specificity was 60.0% (95% CI, 30.0–90.0%) due to a few isolation reports from blood samples before the outbreak.
Figure 2.

Early detection of three nosocomial outbreaks. (A) Multidrug resistant Acinetobacter baumannii (MDR-AB). (B) Multidrug resistant Pseuedomonas aeruginosa (MDRP). (C). Isolation of Serratia marcescens from blood samples. Filled circles represent the observed monthly counts of cases. Straight line represents the expected value based on historical baseline, and dashed line represents the upper 95% prediction interval to define an outbreak. In each panel, an arrow represents the 1st month at which the outbreak is successfully detected.

EPHRP1-03-121-g002
The present study proposed the score prediction interval for detecting nosocomial outbreaks caused by rare pathogens, applying the method to three actual outbreak events in Japan, caused by MDR-AB, MDRP and Serratia marcescens. The proposed approach is regarded as an extension of a classical method invented by Stroup et al [13], which employed a normal distribution with a static baseline, in that the nonhomogeneity (i.e., the outbreak) in the proposed approach can be identified even for rare diseases with very small number of counts for the baseline as it exploits a Poisson distribution. In all three outbreaks, the threshold to define the outbreak was computed to be one or two cases, which agreed well with empirically calculated threshold based on the receiver operating characteristic curve and Youden index. These findings support the notion that one should immediately start the outbreak investigation of any nosocomial outbreak caused by rare pathogens upon diagnosis of index patient(s).
To the best of the author’s knowledge, the present study is the first to epidemiologically support the notion that the nosocomial outbreak caused by rare pathogens should be regarded as an outbreak even when there is only one case. Based on the single report of index case, the hospital may issue an alert. Although declaring an outbreak and starting the investigation and interventions with one case can easily be justified in practice, the present study has offered a firm theoretical support for that action and demonstrated its scientific validity. However, the performances of outbreak detection (e.g., sensitivity, specificity, and AUC) were not shown to be always excellent, because of the nature of using threshold at one case, with highly variable sensitivity and specificity values. However, the imperfect performance of detection when using the defined threshold should not be regarded as a flaw of the proposed model, but rather the nature of reliance on the temporal distribution of cases. In reality, the declaration of outbreak can also account for additional information such as spatiotemporal growth of cases, the times of admission and illness onset among cases, and identification of risk factors through outbreak investigations.
An advantage of using score prediction interval is that the coverage probability is much higher than other approximate prediction intervals proposed in the past [19,21,25,26]. Moreover, the present study has shown that the analytical solution remains to be tractable, and the proposed score prediction interval permits easy computation in hospital settings among healthcare workers using spreadsheet program. Given a ward-based surveillance data for n months with cumulative counts Xn, and given that we wish to test if there is an outbreak within the ward, one can satisfy this task by comparing the observed counts in (n + 1)th month against
EPHRP1-03-121-e012.jpg
and, if the observed data exceeds the threshold, the hospital ward may regard it as an abnormal excess. Due to its simplicity, equation (12) has a potential to greatly help any local clinical setting (including clinical laboratory section) to issue an alarm of excess without devising any complex computer system. In fact, it is known that the isolation of MDR-AB in the laboratory section was not sufficiently informed to infection control team during the MDR-AB outbreak in Figure 1A during its early stage, and using equation (12) among clinical or laboratory experts should have at least helped recognize the abnormality.
Although there have been a number of studies aiming to detect infectious disease outbreaks employing a variety of sophisticated mathematical and statistical techniques, not so many detection systems have been put into practice, especially at the levels of local medical and healthcare facilities. In particular, early detection approach to small scale outbreaks such as nosocomial ones has been extremely limited. In this sense, I believe that equation (12) based on the proposed method and scientific support to issue an alarm upon diagnosis of index patient(s) would greatly help in managing nosocomial outbreaks at the hospital- and ward-levels in the future.
Acknowledgements
The author received funding support from the Japan Science and Technology Agency (JST) PRESTO program. This work received financial support from the Harvard Center for Communicable Disease Dynamics from the National Institute of General Medical Sciences (grant no. U54 GM088558). The funding bodies were not involved in the collection, analysis and interpretation of data, the writing of the manuscript or the decision to submit for publication.
  • 1. Ministry of Health, Labour and Welfare, Japan. Guides for surveillance at middle- and small-scale healthcare facilities.. Ministry of Health, Labour and Welfare, Japan.; Tokyo: 2010. 4th ed.Available from: http://www.nih-janis.jp/material/ [in Japanese]..
  • 2. Ministry of Health, Labour and Welfare, Japan. Surveillance for nosocomial infection.. Ministry of Health, Labour and Welfare, Japan; Tokyo: 2010. [in Japanese]..
  • 3. Farrington P Andrews N. . Outbreak detection: application to infectious disease surveillance. In: Brookmeyer R, Stroup DF, editors. Monitoring the health of populations.. Oxford University Press; New York: 2004. pp 203−31.
  • 4. Tango T. . The detection of disease clustering in time. Biometrics 3;1984;40(1). 15−26. PMID: 6733224.ArticlePubMed
  • 5. Kulldorff M Heffernan R Hartman J et al.. A space–time permutation scan statistic for disease outbreak detection. PLoS Med 3;2005;2(3). e59PMID: 15719066.ArticlePubMedPMC
  • 6. Takahashi K Kulldorff M Tango T et al.. A flexibly shaped spaceetime scan statistic for disease outbreak detection and monitoring. Int J Health Geogr 11 4 2008;7:14PMID: 18402711.ArticlePubMedPMC
  • 7. Kawana A Teruya K Kirikae T et al.. “Syndromic surveillance within a hospital” for the early detection of a nosocomial outbreak of acute respiratory infection. Jpn J Infect Dis 12;2006;59(6). 377−9. PMID: 17186956.PubMed
  • 8. Abbo A Navon-Venezia S Hammer-Muntz O et al.. Multidrug-resistant Acinetobacter baumannii. Emerg Infect Dis 1;2005;11(1). 22−9. PMID: 15705318.ArticlePubMedPMC
  • 9. Dent LL Marshall DR Pratap S et al.. Multidrug resistant Acinetobacter baumannii: a descriptive study in a city hospital. BMC Infect Dis 7;2010;7:10−196.Article
  • 10. Aloush V Navon-Venezia S Seigman-Igra Y et al.. Multidrugresistant Pseudomonas aeruginosa: risk factors and clinical impact. Antimicrobial Agents Chemother 1;2006;50(1). 43−8.Article
  • 11. Hota S Hirji Z Stockton K et al.. Outbreak of multidrug-resistant Pseudomonas aeruginosa colonization and infection secondary to imperfect intensive care unit room design. Infect Control Hosp Epidemiol 1;2009;30(1). 25−33. PMID: 19046054.ArticlePubMed
  • 12. Krishnamoorthy K Mathew T. . Statistical tolerance regions. Theory, applications, and computation.. Wiley; New York: 2009.
  • 13. Stroup DF Williamson GD Herndon JL et al.. Detection of aberrations in the occurrence of notifiable diseases surveillance data. Stat Med 3;1989;8(3). 323−9. PMID: 2540519.ArticlePubMed
  • 14. Davis CB McNichols RJ. . One-sided intervals for at least p of m observations from a normal population on each of r future occasions. Technometrics 1987;29(3). 359−70.Article
  • 15. Patel JK. . Prediction intervals–a review. Commun Stat Theory Methods 1989;18:2393−465.Article
  • 16. Lawless JF Fredette M. . Frequentist prediction intervals and predictive distributions. Biometrika 9;2005;92(3). 529−42.Article
  • 17. Diekmann O Heesterbeek JAP. . Mathematical epidemiology of infectious diseases: model building, analysis and interpretation.. Wiley; New York: 2000.
  • 18. Krishnamoorthy K Peng J . Improved closed-form prediction intervals for binomial and Poisson distributions. J Statist Plann Inference 5;2011;141(5). 1709−18.Article
  • 19. Nelson W . Applied life data analysis.. Wiley; New York: 1982.
  • 20. Agresti A Coull BA . Approximate is better than “exact” for interval estimation of binomial proportion. Am Stat 5;1988;52(2). 119−25.
  • 21. Wang H . Coverage probability of prediction intervals for discrete random variables. Comp Stat Data Anal 9;2008;53(1). 17−26.Article
  • 22. Wang H . Closed form prediction intervals applied for disease counts. Am Stat 2010;64(3). 250−6.Article
  • 23. Wilson EB . Probable inference, the law of succession, and statistical inference. JASA 1927;22(158). 209−12.Article
  • 24. Nishiura H Kamiya K . Fever screening during the influenza (H1N1-2009) pandemic at Narita International Airport, Japan. BMC Infect Dis 3 5 2011;11:111PMID: 21539735.ArticlePubMedPMC
  • 25. Bain LJ Patel JK . Prediction intervals based on partial observations for some discrete distributions. IEEE Trans Reliability 1993;42(3). 459−63.Article
  • 26. Ejima K Omori R Cowling BJ et al. The time required to estimate the case fatality ratio of influenza using only the tip of an iceberg: joint estimation of the virulence and the transmission potential. Comput Math Methods Med 2012;2012:978901PMID: 22649483.ArticlePubMedPMC

Figure & Data

References

    Citations

    Citations to this article as recorded by  
    • Lean back and wait for the alarm? Testing an automated alarm system for nosocomial outbreaks to provide support for infection control professionals
      Christin Schröder, Luis Alberto Peña Diaz, Anna Maria Rohde, Brar Piening, Seven Johannes Sam Aghdassi, Georg Pilarski, Norbert Thoma, Petra Gastmeier, Rasmus Leistner, Michael Behnke, Surbhi Leekha
      PLOS ONE.2020; 15(1): e0227955.     CrossRef
    • Time series non-Gaussian Bayesian bivariate model applied to data on HMPV and RSV: a case of Dadaab in Kenya
      Raymond Nyoka, Thomas N. O. Achia, Jimmy Omony, Samuel M. Musili, Anthony Gichangi, Henry Mwambi
      BMC Public Health.2019;[Epub]     CrossRef
    • Neural Network-Based Uncertainty Quantification: A Survey of Methodologies and Applications
      H. M. Dipu Kabir, Abbas Khosravi, Mohammad Anwar Hosen, Saeid Nahavandi
      IEEE Access.2018; 6: 36218.     CrossRef
    • Automated detection of hospital outbreaks: A systematic review of methods
      Brice Leclère, David L. Buckeridge, Pierre-Yves Boëlle, Pascal Astagneau, Didier Lepelletier, Andre Scherag
      PLOS ONE.2017; 12(4): e0176438.     CrossRef
    • Journal Publishing: Never Ending Saga
      Hae-Wol Cho, Chaeshin Chu
      Osong Public Health and Research Perspectives.2014; 5(1): 1.     CrossRef
    • Roll the Dice
      Hae-Wol Cho, Chaeshin Chu
      Osong Public Health and Research Perspectives.2014; 5(5): 243.     CrossRef
    • Summing Up Again
      Hae-Wol Cho, Chaeshin Chu
      Osong Public Health and Research Perspectives.2014; 5(4): 177.     CrossRef
    • Sample Size Considerations for One-to-One Animal Transmission Studies of the Influenza A Viruses
      Hiroshi Nishiura, Hui-Ling Yen, Benjamin J. Cowling, Maciej F. Boni
      PLoS ONE.2013; 8(1): e55358.     CrossRef

    • PubReader PubReader
    • Cite
      Cite
      export Copy
      Close
    • XML DownloadXML Download
    Figure
    • 0
    • 1
    Early Detection of Nosocomial Outbreaks Caused by Rare Pathogens: A Case Study Employing Score Prediction Interval
    Image Image
    Figure 1. Monthly incidence of nosocomial outbreaks. (A) Multidrug resistant Acinetobacter baumannii (MDR-AB) in a tertiary hospital with approximately 1150 beds (n= 46) from 2009 to 2010. (B) Multidrug resistant Pseuedomonas aeruginosa (MDRP) at a secondary hospital with approximately 580 beds (n = 18) from 2009 to 2010. (C) Total samples and (D) blood samples of Serratia marcescens (n = 226) at a secondary hospital with 380 beds from 1999 to 2000. The horizontal axis represents the month of diagnosis. Before the observation in the earlier year (i.e., 2009 for A and B, and 1999 for C and D), there was no report of cases since January.
    Figure 2. Early detection of three nosocomial outbreaks. (A) Multidrug resistant Acinetobacter baumannii (MDR-AB). (B) Multidrug resistant Pseuedomonas aeruginosa (MDRP). (C). Isolation of Serratia marcescens from blood samples. Filled circles represent the observed monthly counts of cases. Straight line represents the expected value based on historical baseline, and dashed line represents the upper 95% prediction interval to define an outbreak. In each panel, an arrow represents the 1st month at which the outbreak is successfully detected.
    Early Detection of Nosocomial Outbreaks Caused by Rare Pathogens: A Case Study Employing Score Prediction Interval

    PHRP : Osong Public Health and Research Perspectives
    TOP