Figure 1
Stock and flow simulation model for population with different levels of blood pressure.
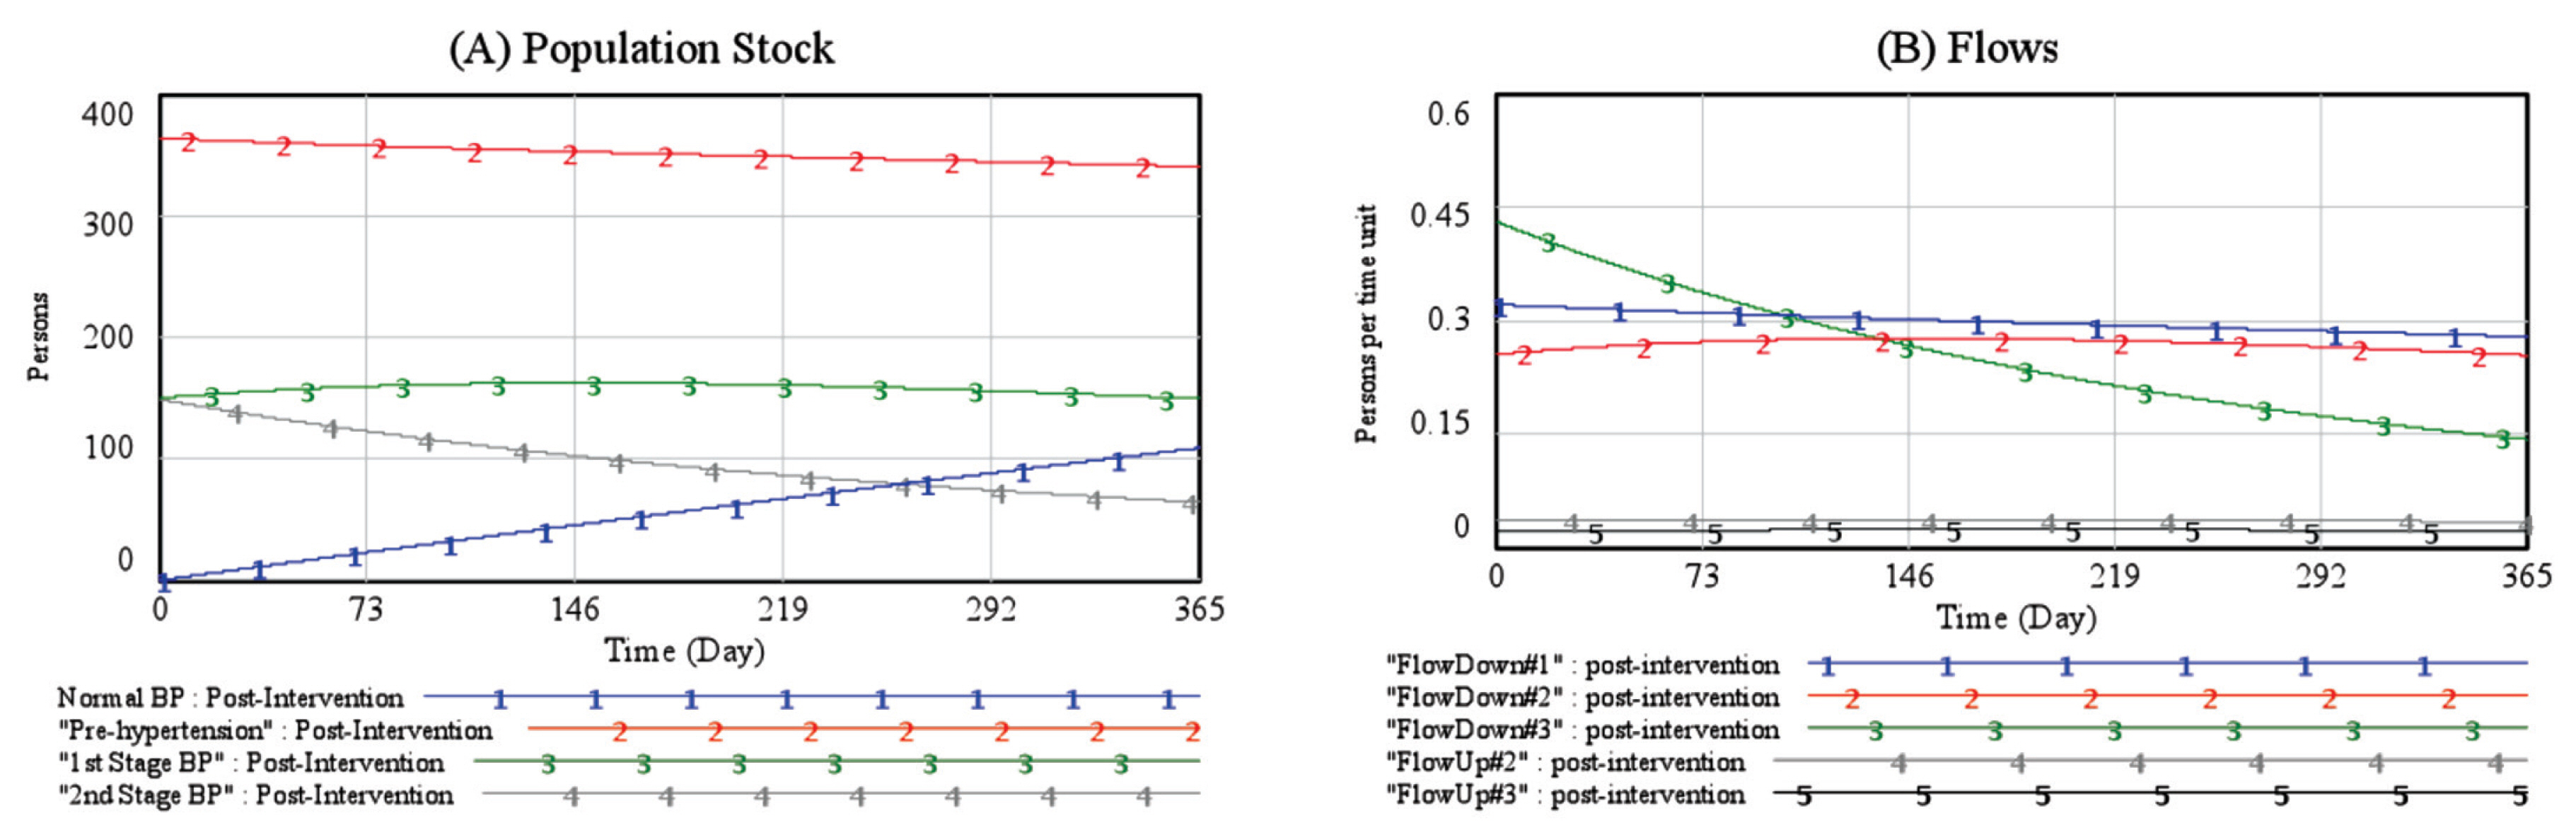
The population stock in each category changed in response to changes in flow ups and downs. The birth, death, and migration rates were assumed to be zero because the simulation period was set for a year or 365 days only. The flow rates or the rates of change were calculated based on information from the first and second blood pressure (BP) measurements.
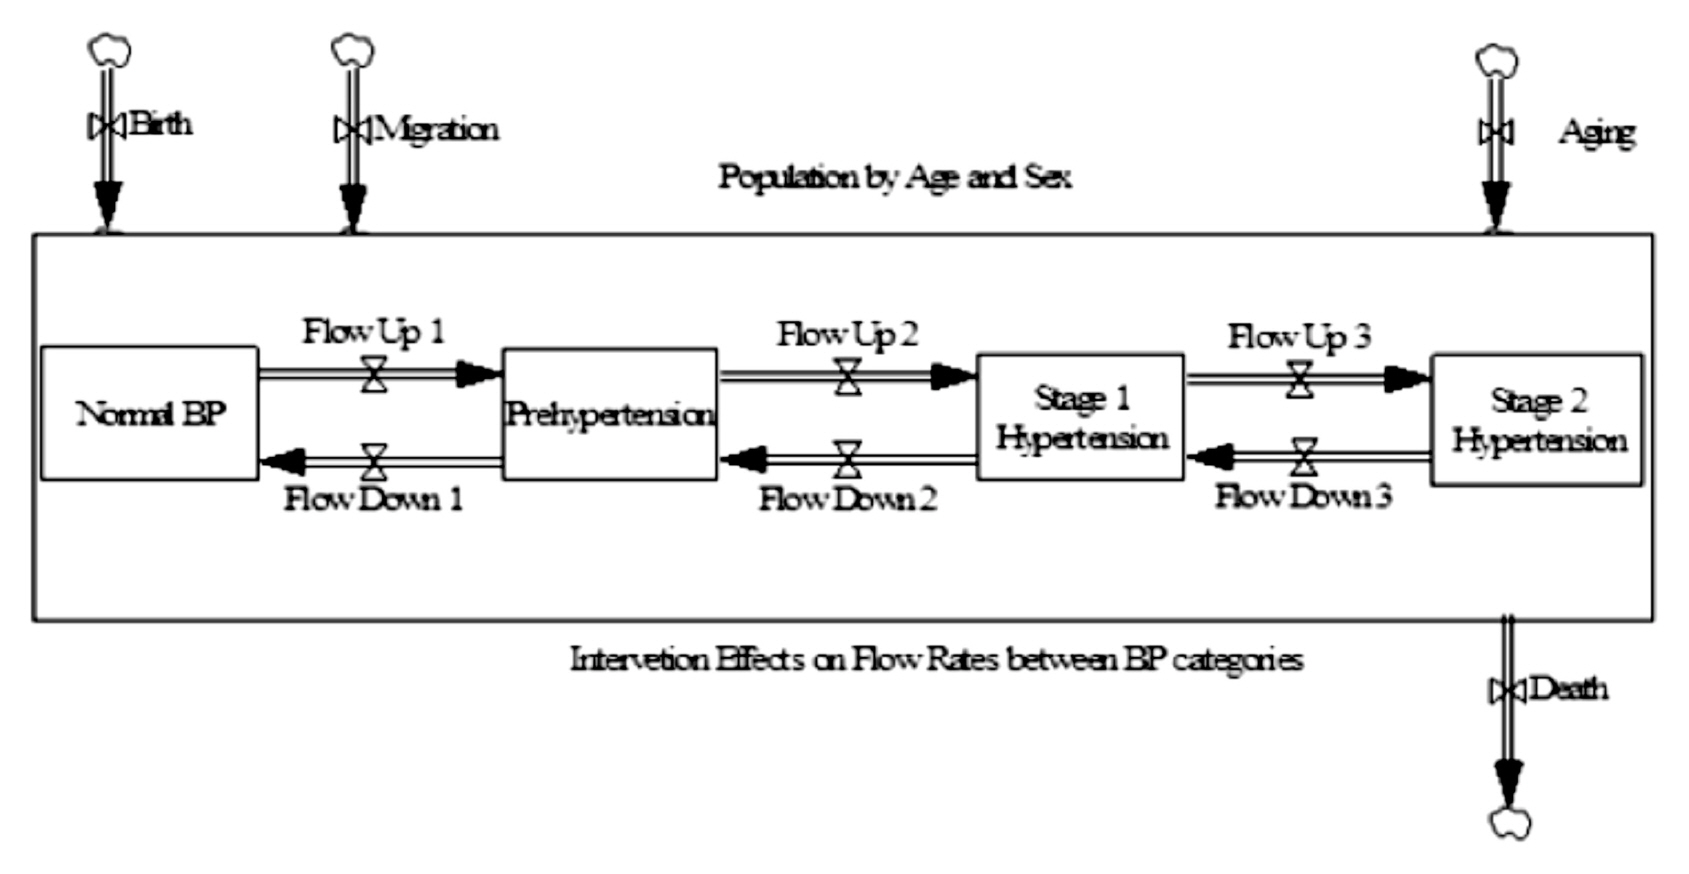
Figure 2Estimated impacts of the Korea International Cooperation Agency (KOICA) - Yonsei programs on blood pressure for all participants in the Comas and Callo districts, Lima, Peru, 2015.

Table 1Location of Korea International Cooperation Agency health centers and local district population.
|
District*
|
Name of Health Center*
|
District Population*
|
|
Comas |
Santa Luzmila II |
33,369 |
|
Comas |
Laura Rodriguez Dulanto |
34,246 |
|
Callao |
Bellavista |
75,163 |
|
Callao |
Pachacutec |
42,827 |
|
Total |
|
185,605 |
Table 2Blood pressure chart.
|
Category*† |
Top number (systolic) (mmHg) *† |
|
Bottom number (diastolic) (mmHg) *† |
|
Normal |
≤120 |
and |
≤80 |
|
Prehypertension |
120–139 |
or |
80–89 |
|
Stage 1 hypertension |
140–159 |
or |
90–99 |
|
Stage 2 hypertension |
160 higher |
or |
≥ 100 |
Table 3Description of the Korea International Cooperation Agency (KOICA) - Yonsei intervention programs from June 1st to December 31st, 2015.
|
Session |
Activity |
Description |
Provider (Time) |
|
1 |
Health Assessment |
Check health conditions based on preliminary research results Create a personal health record Write a follow-up action plan Measure blood pressure, weight, and abdomen circumference Distribute notebooks to document for blood pressure management, exercise, nutrition practice
|
Nurse (50 min) |
|
|
2 |
Blood Pressure Management Training |
Provide education on definition, causes, symptoms, and complications of hypertension Provide education on blood pressure measurement and classification of blood pressure Measure blood pressure, weight, and abdomen circumference
|
Nurse (30 min) |
|
|
|
|
3 |
Provide education on the importance of healthy lifestyle (smoking, drinking, exercise, nutrition) and also the need for medication Measure blood pressure, weight, and abdomen circumference Distribute stretching machine and obesity meters
|
Nurse (30 min) |
|
|
4 |
Physical Exercise Training |
Provide education on the importance of physical activity for blood pressure control Provide education on type of exercise needed for hypertension prevention Measure blood pressure, weight, and abdomen circumference
|
Nurse & Nutritionist (30 min) |
|
|
|
5 |
Organize training sessions on aerobic, anaerobic, other physical exercises that are suitable for each participant (e.g. stretching, tai chi, and dance) Each participant is required to complete at least one session. Measure blood pressure, weight, and abdomen circumference
|
|
|
6 |
Nutrition Education |
Provide education on the importance of controlling dietary habits for blood pressure control Organize training sessions on how to eat low sodium foods, analyze personal dietary habits by writing meals journal, and understand food tower. Measure blood pressure, weight, and abdomen circumference
|
Nutritionist (30 min) |
|
|
|
7 |
Organize a training session on finding the best meal plan using the Dietary Approaches to Stop Hypertension (DASH) diet Each participant is required to complete the session Measure blood pressure, weight, and abdomen circumference
|
|
|
8 |
Self-Care Education |
Provide education on the importance of self-care and the best practices for healthy living Measure blood pressure, weight, and abdomen circumference
|
Nurse (30 min) |
Table 4Hypertension prevalence by age and sex before and after the Korea International Cooperation Agency (KOICA) -Yonsei programs (n = 663).
|
|
n
|
Before |
% |
After |
% |
% Change |
p
|
|
Male |
Normal BP |
|
0 |
0% |
9 |
4% |
+9*
|
|
|
Prehypertension |
|
108 |
51% |
123 |
58% |
0.14 |
|
|
1st Stage Hypertension |
|
49 |
23% |
41 |
19% |
−0.16 |
|
|
2nd Stage Hypertension |
|
55 |
26% |
39 |
18% |
−0.29 |
|
|
Total |
212 |
212 |
100% |
212 |
100% |
|
|
|
SBP (mmHg) |
212 |
136.22 ± 21.01 |
|
127.97 ± 17.11 |
|
|
< 0.001 |
|
DBP (mmHg) |
212 |
75.40 ± 12.05 |
|
73.175 ± 11.50 |
|
|
< 0.001 |
|
BMI |
125 |
29.67 ± 5.20 |
|
29.04 ± 5.09 |
|
|
< 0.001 |
|
Ab. Circumf. (cm) |
124 |
98.34 ± 10.39 |
|
97.75 ± 8.83 |
|
|
< 0.100 |
|
Female |
Normal BP |
|
0 |
0% |
100 |
22% |
+1001 |
|
|
Prehypertension |
|
256 |
57% |
215 |
48% |
−0.16 |
|
|
1st Stage Hypertension |
|
101 |
22% |
109 |
24% |
0.08 |
|
|
2nd Stage Hypertension |
|
94 |
21% |
27 |
6% |
−0.71 |
|
|
Total |
451 |
451 |
100% |
451 |
100% |
|
|
|
SBP (mmHg) |
451 |
133.72 ± 21.03 |
|
123.16 ± 18.05 |
|
|
< 0.001 |
|
DBP (mmHg) |
451 |
73.33 ± 12.30 |
|
70.48 ± 10.62 |
|
|
< 0.001 |
|
BMI |
302 |
29.51 ± 4.87 |
|
28.83 ± 4.54 |
|
|
< 0.001 |
|
Ab. Circumf. (cm) |
303 |
96.13 ± 10.81 |
|
96.45 ± 10.80 |
|
|
< 0.100 |
|
< 60 years†
|
Normal BP |
|
0 |
0% |
72 |
0% |
+72*
|
|
|
Prehypertension |
|
192 |
55% |
158 |
55% |
−0.18 |
|
|
1st Stage Hypertension |
|
13 |
23% |
17 |
23% |
0.31 |
|
|
2nd Stage Hypertension |
|
57 |
22% |
15 |
22% |
−0.74 |
|
|
Total |
262 |
262 |
100% |
262 |
100% |
|
|
|
SBP (mmHg) |
262 |
133.30 ± 20.01 |
|
122.13 ± 16.52 |
|
|
< 0.001 |
|
DBP (mmHg) |
262 |
78.01 ± 12.07 |
|
74.96 ± 10.72 |
|
|
< 0.001 |
|
BMI |
180 |
29.67 ± 4.63 |
|
28.88 ± 4.54 |
|
|
< 0.001 |
|
Ab. Circumf. (cm) |
180 |
97.65 ± 11.51 |
|
97.01 ± 10.74 |
|
|
< 0.100 |
|
≥ 60 years†
|
Normal BP |
|
0 |
0% |
37 |
27% |
+37*
|
|
|
Prehypertension |
|
172 |
73% |
180 |
60% |
0.05 |
|
|
1st Stage Hypertension |
|
137 |
5% |
133 |
6% |
−0.03 |
|
|
2nd Stage Hypertension |
|
92 |
22% |
51 |
6% |
−0.45 |
|
|
Total |
401 |
401 |
100% |
401 |
100% |
|
|
|
SBP (mmHg) |
401 |
135.38 ± 21.67 |
|
126.43 ± 18.55 |
|
|
< 0.001 |
|
DBP (mmHg) |
401 |
71.38 ± 11.67 |
|
68.97 ± 10.51 |
|
|
< 0.001 |
|
BMI |
246 |
29.50 ± 5.39 |
|
28.98 ± 5.21 |
|
|
< 0.001 |
|
Ab. Circumf. (cm) |
247 |
96.08 ± 10.08 |
|
96.63 ± 9.88 |
|
|
< 0.100 |


 PubReader
 Cite
Cite