Articles
- Page Path
- HOME > Osong Public Health Res Perspect > Volume 14(6); 2023 > Article
-
Original Article
Estimation of the onset time of diabetic complications in type 2 diabetes patients in Thailand: a survival analysis -
Natthanicha Sauenram
 , Jutatip Sillabutra, Chukiat Viwatwongkasem, Pratana Satitvipawee
 -
Osong Public Health and Research Perspectives 2023;14(6):508-519.
DOI: https://doi.org/10.24171/j.phrp.2023.0084
Published online: November 23, 2023
Department of Biostatistics, Faculty of Public Health, Mahidol University, Bangkok, Thailand
- Corresponding author: Jutatip Sillabutra Department of Biostatistics, Faculty of Public Health, Mahidol University, Ratchawithi Road, Ratchathewi, Bangkok 10400, Thailand E-mail: jutatip.sil@mahidol.edu
© 2023 Korea Disease Control and Prevention Agency.
This is an open access article under the CC BY-NC-ND license (http://creativecommons.org/licenses/by-nc-nd/4.0/).
- 1,182 Views
- 66 Download
Abstract
-
Objectives
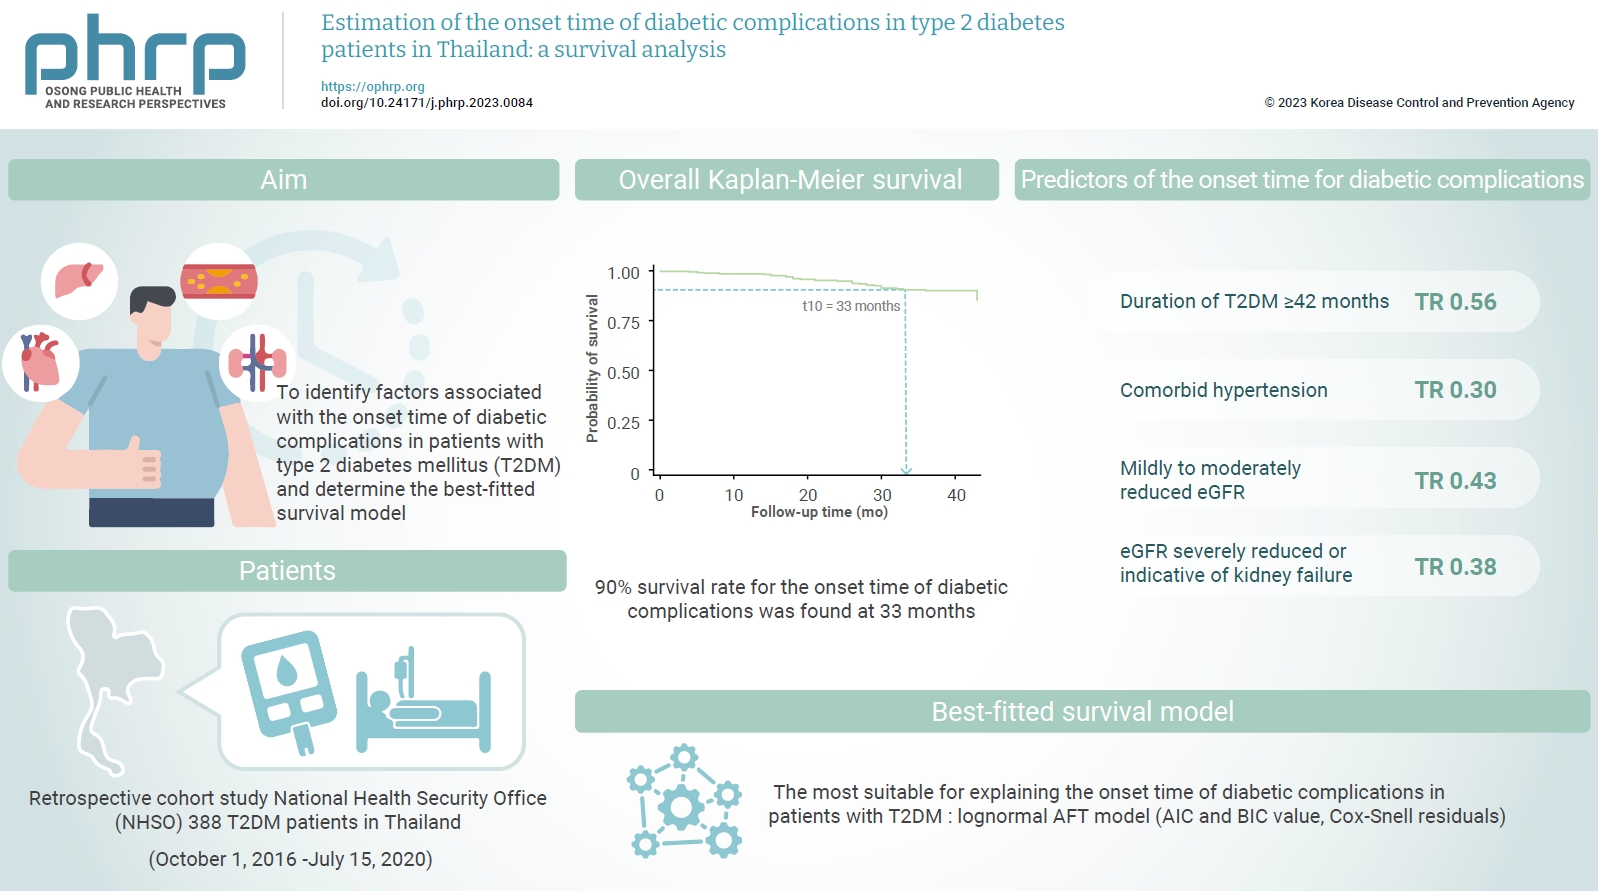
- This study aimed to identify factors associated with the onset time of diabetic complications in patients with type 2 diabetes mellitus (T2DM) and determine the best-fitted survival model.
-
Methods
- A retrospective cohort study was conducted among T2DM patients enrolled from October 1, 2016 to July 15, 2020 at the National Health Security Office (NHSO). In total, 388 T2DM patients were included. Cox proportional-hazard and parametric models were used to identify factors related to the onset time of diabetic complications. The Akaike information criterion, Bayesian information criterion, and Cox-Snell residual were compared to determine the best-fitted survival model.
-
Results
- Thirty diabetic complication events were detected among the 388 patients (7.7%). A 90% survival rate for the onset time of diabetic complications was found at 33 months after the first T2DM diagnosis. According to multivariate analysis, a duration of T2DM ≥42 months (time ratio [TR], 0.56; 95% confidence interval [CI], 0.33–0.96; p=0.034), comorbid hypertension (TR, 0.30; 95% CI, 0.15–0.60; p=0.001), mildly to moderately reduced levels of the estimated glomerular filtration rate (eGFR) (TR, 0.43; 95% CI, 0.24–0.75; p=0.003) and an eGFR that was severely reduced or indicative of kidney failure (TR, 0.38; 95% CI, 0.16–0.88; p=0.025) were significantly associated with the onset time of diabetic complications (p<0.05).
-
Conclusion
- Patients with T2DM durations of more than 42 months, comorbid hypertension, and decreased eGFR were at risk of developing diabetic complications. The NHSO should be aware of these factors to establish a policy to prevent diabetic complications after the diagnosis of T2DM.
- Diabetes refers to metabolic diseases characterized by hyperglycemia, which results from defects in insulin secretion, insulin action, or both [1]. As of 2021, the global prevalence of diabetes among individuals aged 20 to 79 was estimated to be 10.5% (95% confidence interval [CI], 8.3%–12.0%), and this figure is projected to rise to 12.2% (95% CI, 9.5%–14.0%) by 2045. In the Western Pacific region, the prevalence of diabetes was 11.9% (95% CI, 10.1%–13.5%), and it is expected to increase to 14.4% (95% CI, 12.1%–16.4%) by 2045 [2]. In Thailand, the prevalence of diabetes was estimated to be 9.7% among individuals aged 20 to 79 years in 2021 [3]. In 2019, the International Diabetes Federation Atlas reported that 4.2 million people died from diabetes, corresponding to approximately 11.3% of deaths from all causes [4].
- Type 2 diabetes mellitus (T2DM) accounts for over 90% of all diabetes mellitus cases and is characterized by impaired insulin secretion from pancreatic islet β-cells, tissue insulin resistance, and an insufficient compensatory insulin secretion response [5]. In 2017, T2DM was prevalent in approximately 6.28% of the global population, corresponding to a rate of 6,059 cases per 100,000 individuals. This figure is projected to increase to 7,079 cases per 100,000 individuals by 2030 [6]. The incidence and prevalence of T2DM continue to rise, and uncontrolled blood glucose levels in patients can result in long-term complications.
- An observational study conducted across 28 countries in Asia, Africa, South America, and Europe found that 50% of patients with T2DM experienced microvascular complications, while 27% experienced macrovascular complications [7]. A prospective study of Thai T2DM patients revealed a prevalence of 38.3% for diabetic nephropathy, 23.7% for retinopathy, and over 15% for foot problems [8]. Numerous studies have highlighted significant factors contributing to diabetic complications in T2DM patients. These include age, sex, body mass index (BMI), smoking habits, family history of diabetes, duration of diabetes, ethnic group, hyperglycemia, hypertension, and hypercholesterolemia [9−12]. Additionally, several studies have found that screening for foot and eye issues could delay the onset of diabetes-related complications [13−15].
- Survival analysis is a statistical method employed to examine the time leading up to a failure event or the conclusion of a study, and it can be instrumental in identifying risk factors [16]. Regression models, such as Cox proportional hazard (PH) and parametric models, can be used to estimate the time until the occurrence of a failure event [17].
- The primary assumption of the PH model is that the hazard ratio is constant over time. In contrast, parametric models are capable of modeling survival times, even when the PH assumption is not met, due to their assumption of a specific distribution for the outcome variable [18,19]. This study focused on parametric models, including Weibull and log-normal accelerated failure time (AFT). The characteristics of the hazard function for these 2 models are as follows: (1) the Weibull model can either increase or decrease with increasing survival time, and (2) the log-normal model can increase, decrease, or invert [20]. These models are also suitable for fitting diabetes data.
- This study compared the performance of Cox PH, Weibull, and log-normal AFT models to identify factors associated with the onset time of diabetic complications in patients with T2DM. The best-fitted survival model was also determined.
Introduction
- This study was structured as a retrospective cohort study. We collected secondary data from diabetes patients, spanning from October 1, 2016 to July 15, 2020, from the National Health Security Office (NHSO) database. We selected patients who were first diagnosed with T2DM between October 1, 2016, and September 30, 2017. Patients with incomplete laboratory data, such as fasting blood glucose (FBG), hemoglobin A1c (HbA1c), total triglycerides (TG), low-density lipoprotein cholesterol (LDL-C), and estimated glomerular filtration rate (eGFR), were excluded. Additionally, we excluded patients who had a history of health issues related to complications. The final dataset for analysis consisted of 388 records from T2DM patients with complete data.
- Using the survival analysis formula [21], it was established that the data collected in this study constituted a suitable sample size.
- With the alpha error set to 95% and a power of 90%, a hazard ratio of 0.726 for developing neuropathy for patients with and without hypertension [22], the minimum sample size was determined to be 329.
- Data from the NHSO database, comprising 388 entries, were analyzed. The variables considered included sex, age, age at T2DM diagnosis, duration of T2DM, BMI, comorbidity with hypertension, foot and retina examinations, FBG, HbA1c, TG, LDL-C, eGFR, and diabetic complications such as nephropathy, retinopathy, neuropathy, and peripheral vascular disease.
- The onset time of diabetic complications was defined as the duration, in months, between the diagnosis of T2DM and the development of complications. Clinical complications such as nephropathy, retinopathy, neuropathy, and peripheral vascular disease were diagnosed by a physician and documented in the NHSO database. Patients were categorized into 2 groups: those with diabetic complication events and those with censored data.
- The other variables were defined as independent variables. Sex was categorized into 2 groups: male and female. Age was categorized into 3 groups: ≤49 years, 50 to 59 years, and ≥60 years [23]. Age at the diagnosis of T2DM was categorized into 2 groups: <35 years and ≥35 years. The duration of T2DM was categorized into 2 groups: <42 months and ≥42 months. BMI was categorized into 4 groups according to the Asian criteria: underweight (<18.5 kg/m2), normal (18.5–22.9 kg/m2), overweight (23–24.9 kg/m2), and obese (≥25 kg/m2) [24]. Comorbid hypertension was dichotomized as yes and no. Whether foot examinations or retina examinations had been performed was also categorized into 2 groups: yes and no. FBG was categorized into 2 groups: <130 mg/dL and ≥130 mg/dL. HbA1c was categorized into 2 groups: <7% and ≥7%. TG was also dichotomized as <150 mg/dL and ≥150 mg/dL. LDL-C was categorized into 2 groups: <100 mg/dL and ≥100 mg/dL. eGFR was categorized into 3 groups: normal to mild decline (>60 mL/min/1.73 m2), mild to moderate decline (30–59 mL/min/1.73 m2), and severe decline to kidney failure (<30 mL/min/1.73 m2) [25−27].
- Model Estimation
- The Kaplan-Meier (KM) technique is a nonparametric survival probability estimator for observations of both censored data and events of interest [28]. The KM estimator of a survival function S(t)=P(T≥t) is given by
- Where di is the observed number of events at time ti and ni is number of individuals at risk at time ti.
- The Cox PH model is the most widely used multivariate statistical model for survival analysis [29]. The Cox PH is a semi-parametric model, where the baseline hazard can be described as follows:
- Where h0(t) is the baseline hazard function and Xi is a vector of covariates and β is a vector of parameters for effect of the predictors.
- Two types of graphical techniques are used to evaluate the PH assumption. The first is the ln(-ln(s(t))) plot, where parallel curves indicate that the PH hypothesis has not been violated. The second technique involves the KM and predicted survival plot. If the observed and predicted survival curves are closely aligned, it suggests that the PH assumption has not been violated. After fitting a Cox model, we can also test using Schoenfeld residuals. In this case, there was no evidence to suggest that the PH assumption was violated (p>0.05) [30].
- An alternative to the Cox model is a parametric survival model, which assumes a specific form for the survival distribution. The models most frequently used are the Weibull and log-normal models. The AFT model posits that the effect of covariates multiplies with survival time [31]. In this study, we used the Weibull and log-normal AFT models for evaluation within the parametric model. The distribution of time to event, represented as T, as a function of a single covariate, is expressed as follows:
- Where β1 is the coefficient for corresponding covariate, ε follows the extreme minimum value distribution G(0, σ), and σ is the shape parameter [32].
- Data Analysis
- All data were cleaned to ensure completeness and consistency. The variables were categorized based on the criteria used to determine the reference group, as derived from the literature review, and were then exported to STATA statistical software ver. 17.0 (STATA Corp.). Descriptive statistics were employed to outline the characteristics of the sample. The KM method was used to estimate the survival experience of patients across different groups, represent median time, and estimate percentiles across various time scales [33]. The log-rank test was utilized to compare survival times between subgroups within each variable. Factors associated with diabetic complication events were examined using univariate and multivariate analysis, based on the Cox PH, Weibull, and log-normal AFT models, in order to identify the most fitting model. The best-fitted survival model was determined by comparing the Akaike information criterion (AIC) and Bayesian information criterion (BIC). The model with the lowest AIC and BIC values was selected. The Cox-Snell residuals were used to assess the overall fit of the model.
- Ethics Approval
- All procedures conducted in the studies received ethical approval from the Faculty of Public Health, Mahidol University, Thailand (No: MUPH 45/2021). The Committee for Human Research Ethics granted an exemption for this research under protocol number MUPH 45/2021. The research complied with the non-disclosure agreement with the National Health Security Office.
Materials and Methods
- Characteristics of Study Participants
- Of the 388 newly diagnosed T2DM patients, 250 (64.4%) were women. The average age of the patients was 61±12 years, with ages ranging from 18 to 94 years. The majority of patients (n=376, 96.9%), were diagnosed with T2DM at or after the age of 35 and had been living with T2DM for less than 42 months, accounting for 319 (82.2%) of the patients. Half of the patients (n=195, 50.3%), were classified as obese. Most patients (n=357, 92.0%), did not have comorbid hypertension. The number of patients who had not undergone foot and retinal examinations was 296 (76.3%) and 323 (83.2%), respectively. More than half of the patients (n=236, 60.8%), had an FBG level of 130 mg/dL or higher, and 244 (62.9%) had an HbA1c level of 7% or higher. Furthermore, 205 (52.8%) had TG levels of 150 mg/dL or higher. Three-quarters of the patients (n=292, 75.3%), had LDL-C levels of 100 mg/dL or higher. The majority of patients (n=290, 74.7%), had normal to mildly decreased eGFR (>60 mL/min/1.73 m2) (Table 1).
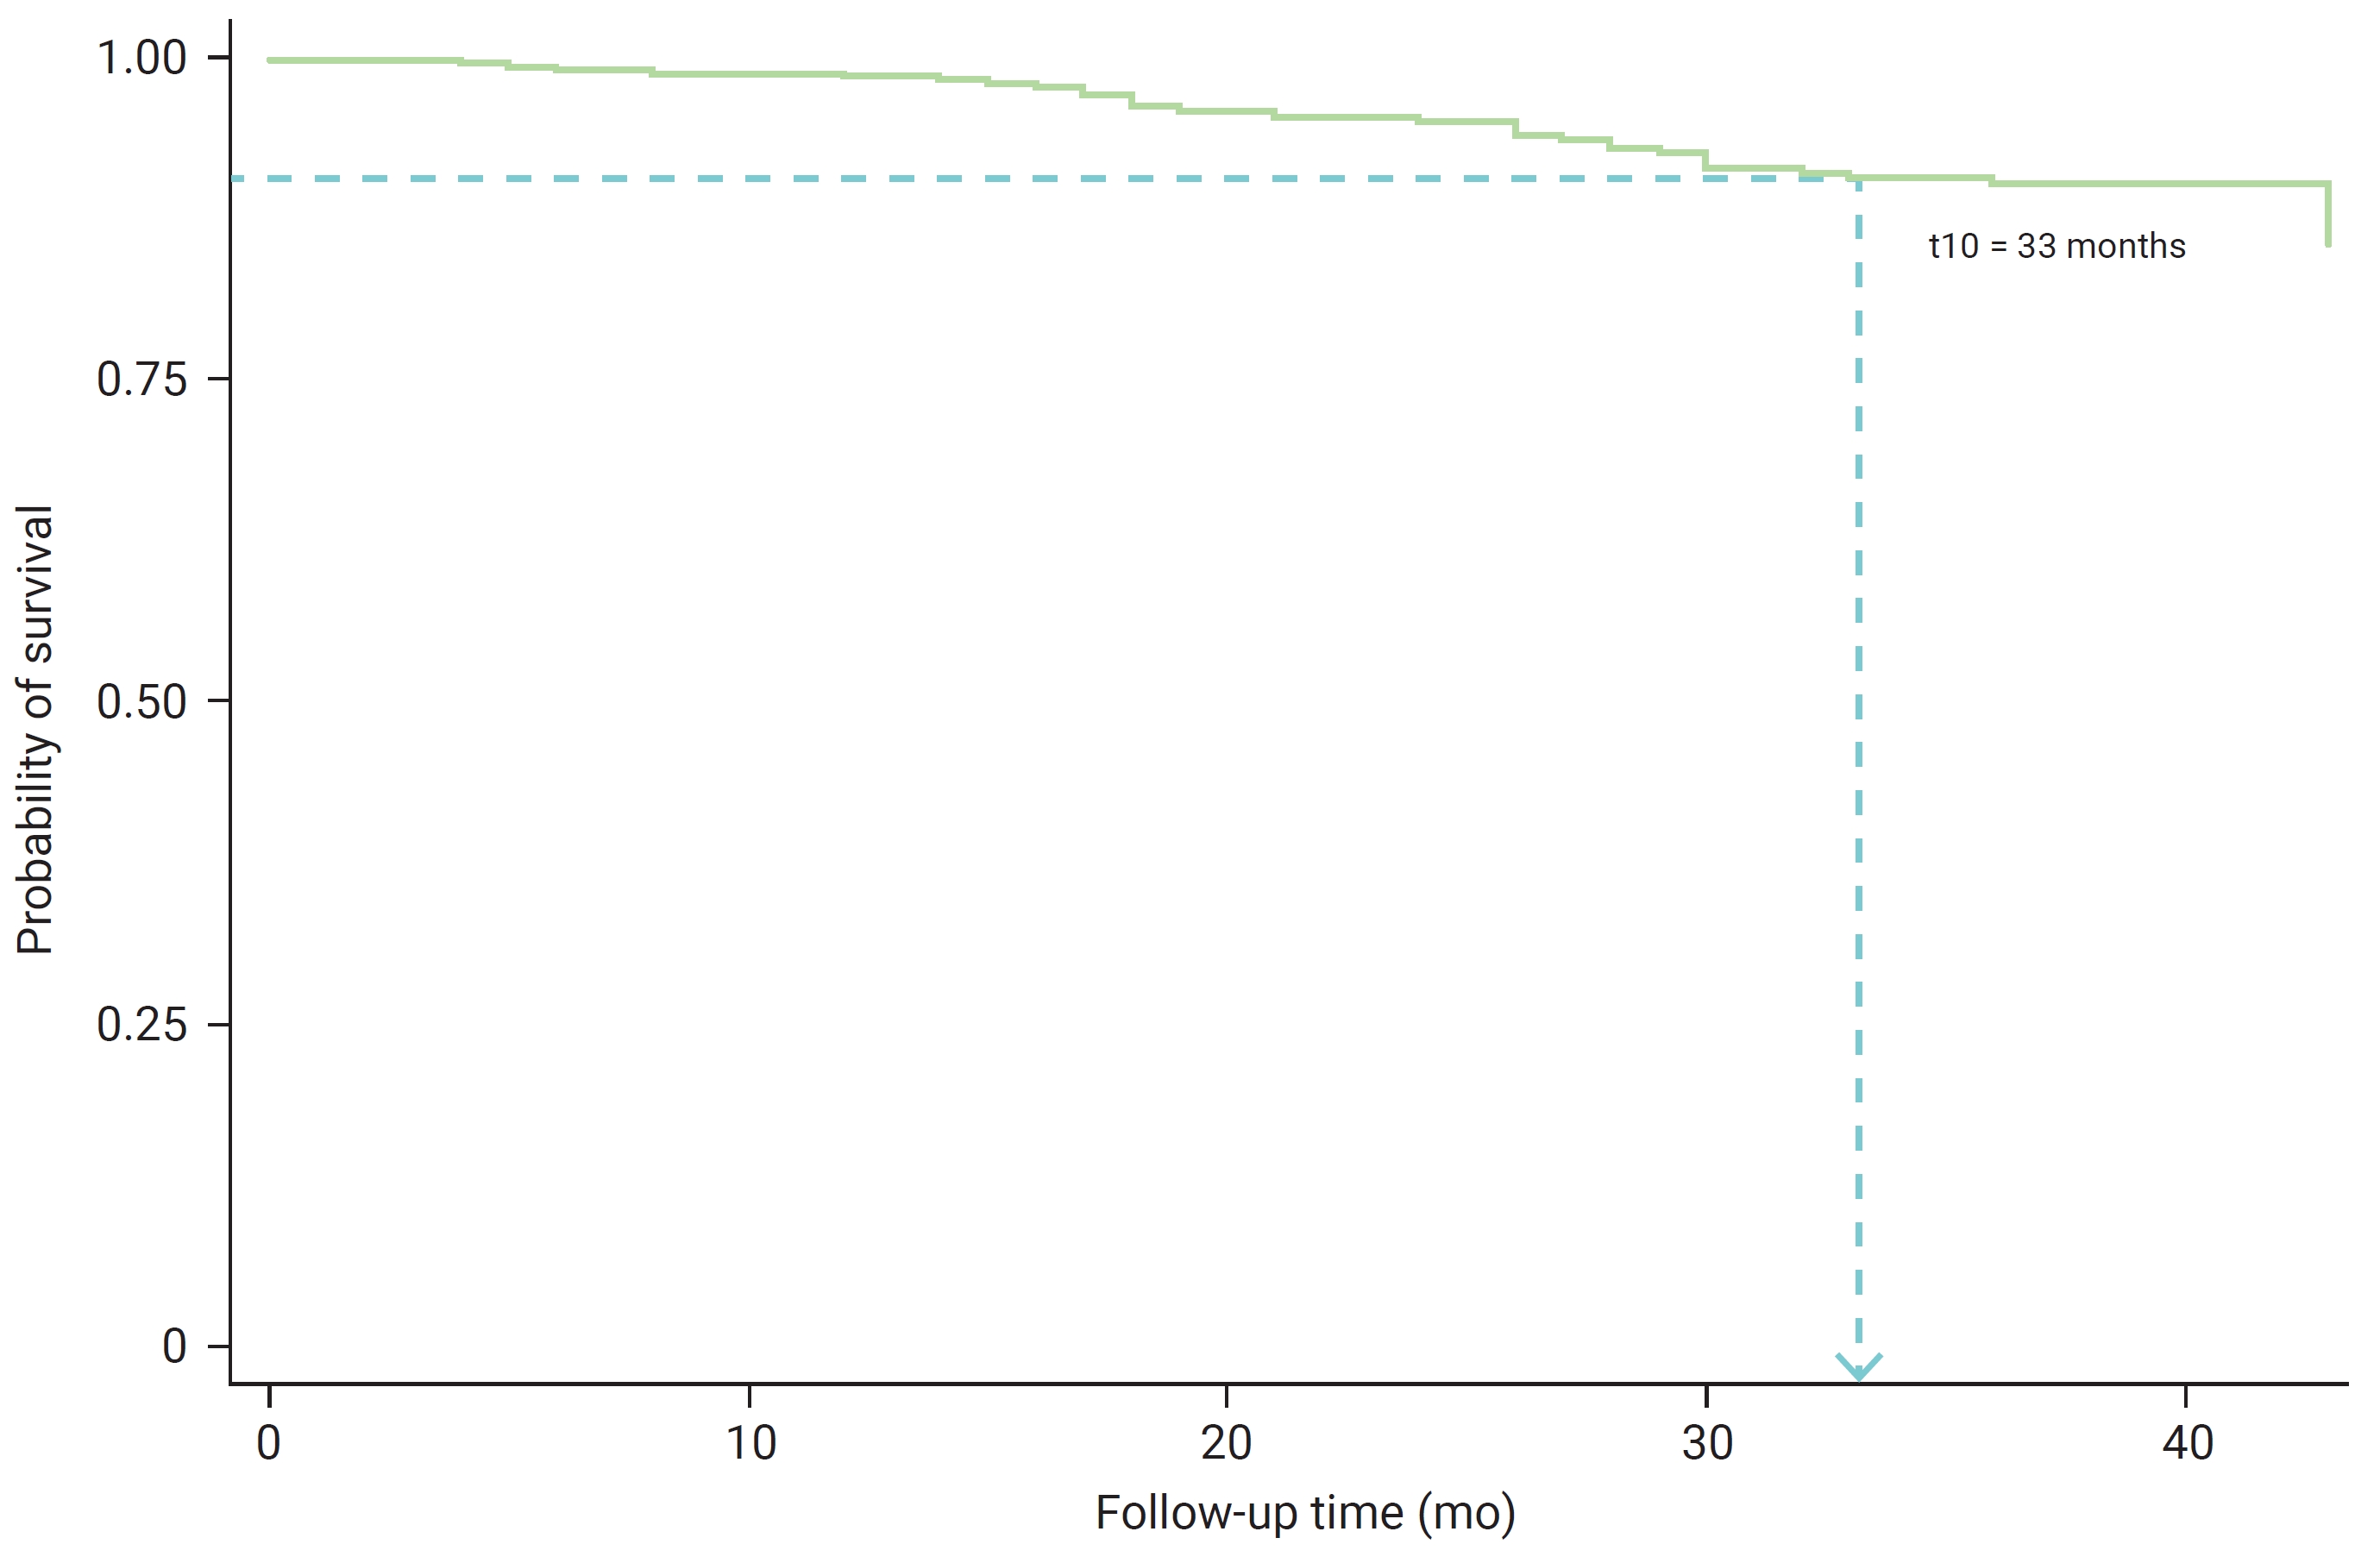
- Overall Survival to the Onset of Diabetic Complications in T2DM Patients by the KM Method
- Patients with T2DM were followed for a median period of 37 months, ranging from 4 to 43 months. Throughout the study, the incidence rate of diabetic complications was 2.5 cases (95% CI, 0.17–0.36) per 1,000 person-months. The incidence rates for specific complications such as retinopathy, peripheral vascular disease, nephropathy, and neuropathy were 6.35 (95% CI, 3.17–12.70), 4.76 (95% CI, 0.67–33.81), 4.19 (95% CI, 2.71–6.50), and 3.13 (95% CI, 0.44–22.18) cases per 100 person-months, respectively.
- By the conclusion of the study, the number of patients experiencing diabetic complication events was below the 50th percentile—that is, the median onset time for diabetic complications could not be determined. It was observed that after 33 months, patients with T2DM had a survival probability of 0.90, indicating a survival rate of 90% until the study’s end (Figure 1). The cumulative probabilities of experiencing diabetic complications among T2DM patients at 12, 24, and 36 months were 0.0131, 0.0492, and 0.1010, respectively.
- Predictors of Diabetic Complications in T2DM Patients
- The log-rank test revealed factors significantly related to the onset time of diabetic complications in patients with T2DM. These factors included the duration of T2DM, comorbidity with hypertension, and eGFR (p<0.05). Other factors, however, were found to be insignificant (Table 2).
- The results of the univariate analysis for the Cox PH, Weibull, and log-normal AFT models are presented in Table 3. In all 3 models, variables such as age, duration of T2DM, comorbid hypertension, HbA1c, LDL-C, and eGFR were found to be significant (p<0.10).
- Multivariate analysis utilizing the Cox PH, Weibull, and log-normal AFT models revealed that the duration of T2DM, the presence of hypertension, and eGFR values were significant predictors of the onset time for diabetic complications in T2DM patients (p<0.05) (Table 4).
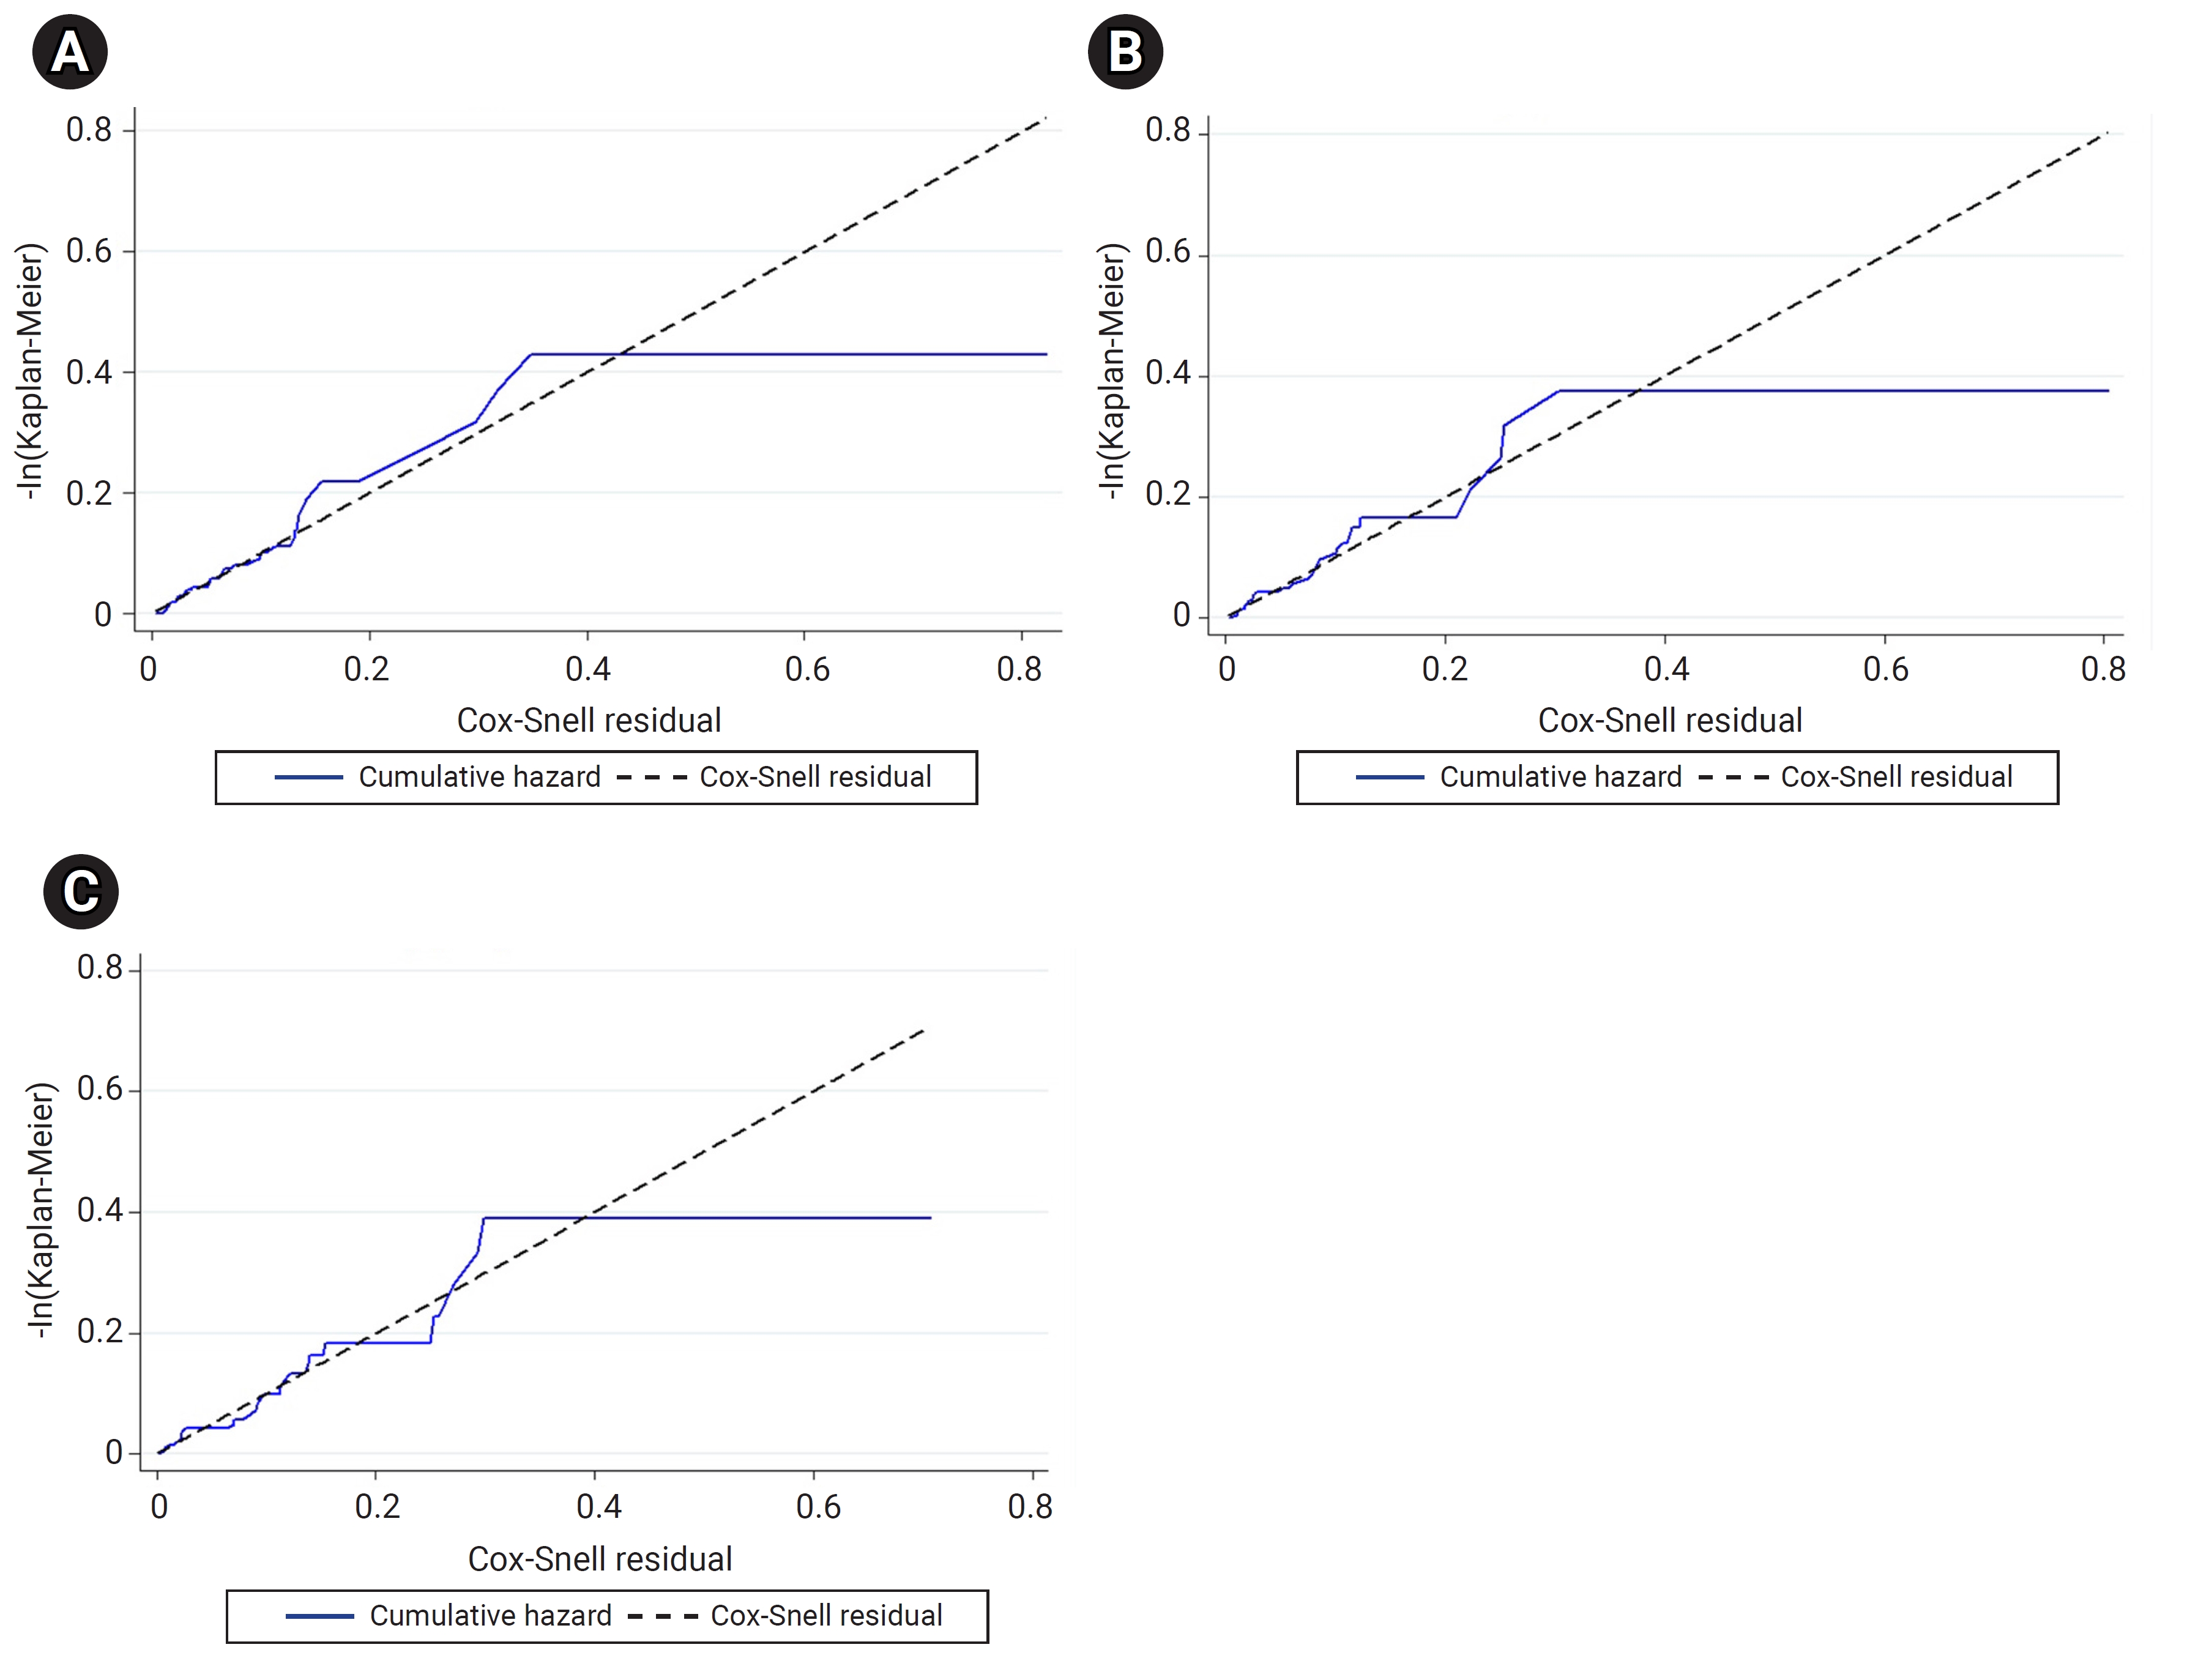
- The results of the univariate and multivariate analyses did not differ between the Cox PH, Weibull, and log-normal AFT models. However, the AIC and BIC values of these models suggested that the log-normal AFT model was the most suitable for explaining the onset time of diabetic complications in patients with T2DM (Table 5). Similarly, the Cox-Snell residuals from the 3 models indicated that the log-normal AFT model closely aligned, with a straight line at a 45° angle (Figure 2).
Results
- This study’s findings revealed that the KM method could not estimate the median time of diabetic complications.
- The 90% survival rate for the onset time of diabetic complications in patients with T2DM was observed at 33 months of follow-up. This is consistent with a study conducted in southern Lithuania, which reported a survival rate of 93% at 2 years, decreasing to 41% over 13 years of living with diabetes [34]. A study in Northwest Ethiopia [35] found that the median time to develop microvascular complications was 30 months, and in Iran [36], the median time until retinopathy was 58 months. A multivariate analysis of the model for the onset time of diabetic complications in T2DM patients revealed that a duration of T2DM exceeding 42 months, the presence of comorbid hypertension, and eGFR levels (ranging from mildly to moderately decreased and severely decreased to kidney failure) were identified as factors associated with diabetic complications (p<0.05).
- The duration of T2DM was significantly associated with diabetic complications (p=0.001), a finding that aligns with other studies [37−40]. Among patients with diabetic complications, the median duration of T2DM was approximately 3 years, a figure lower than that reported by Zoungas et al. [41]. They discovered that a diabetes duration of 5 years or longer was linked to an increased risk of both macrovascular and microvascular complications. Our results indicated a shorter survival time for diabetic complications in patients with a T2DM duration of 42 months or longer, compared to those with a duration of less than 42 months, by about 44%. A similar study conducted in Northwest Ethiopia [42] found that a duration of less than 4 years was a significant predictor of diabetic neuropathy in patients with T2DM.
- The findings suggest that patients with comorbid T2DM and hypertension are at a heightened risk of diabetic complications. This aligns with research conducted in Ethiopia [43,44], Indonesia [45], and Taiwan, which also found an increased risk of major diabetic foot complications and cardiovascular events in T2DM patients with hypertension [46]. The study revealed that the time from onset to diabetic complications in T2DM patients with hypertension is estimated to be 70% shorter than in patients without hypertension. This could be due to hyperglycemia causing a systemic increase in blood pressure by expanding the volume of circulating fluid. Additionally, the progression of vascular remodeling can increase peripheral artery resistance, contributing to hypertension [47]. Therefore, T2DM patients with hypertension tend to develop diabetic complications more rapidly than those without hypertension (p<0.001).
- A reduction in the GFR signifies a decrease in hyperfiltration, a process that initiates diabetic nephropathy [48]. This study found that the level of eGFR is a significant factor in diabetic complications (p<0.05), a result that aligns with other studies conducted in China and Japan. The influence of undiagnosed diabetes mellitus was also assessed, identifying the eGFR as a risk factor for the development of diabetic kidney disease [49−51]. The estimated survival time for patients with T2DM and eGFR levels ranging from mildly to moderately decreased to kidney failure (G3a to G5) is shorter than that of patients with a normal eGFR and those with a mildly decreased eGFR, at 57% and 62% respectively. Consequently, a decreased eGFR can lead to the rapid progression of diabetic nephropathy and cardiovascular diseases [52,53].
- The AIC and BIC values were utilized to compare models and identify the best-fitted survival model [36,54−56], and a Cox-Snell residual plot was used to assess whether the overall model fit the data [20,57,58] for semi-parametric and parametric models. This study found that the log-normal AFT model had the lowest AIC and BIC values. Additionally, in the Cox-Snell residual plot, the lines were closely aligned with a straight line at a 45° angle. Consequently, the log-normal AFT model was determined to be the best-fitted survival model for explaining the onset time of diabetic complications in patients with T2DM, compared to other models. Parametric models provide more informative and precise estimates when the distribution is accurately specified, as compared to the Cox model [32,59].
- This study adhered to recommendations for data handling to estimate and reduce right-censored data in a precise manner. Diabetes mellitus is a chronic disease influenced by individuals’ behavior. Therefore, behavioral factors (smoking and alcohol drinking) and other comorbid factors should be added in future studies to identify risk factors for the onset time of diabetic complications.
Discussion
- This study found that the duration of T2DM, the presence of hypertension, and the eGFR were factors associated with the onset of diabetic complications in patients with T2DM. It is crucial for the NHSO to consider these factors, as identified by the most suitable survival model, in order to formulate and implement policies aimed at preventing the development of diabetic complications.
- The log-normal AFT model proved to be more effective and suitable for our type 2 diabetes dataset than the Cox PH model. Based on the AIC and BIC values, as well as the Cox-Snell residual plot, the log-normal AFT parametric model was identified as the best-fitting survival model. This model most accurately explains the onset time of diabetic complications in patients with T2DM.
Conclusion
HIGHLIGHTS
-
Ethics Approval
This study was approved by the Institutional Review Board of the Faculty of Public Health, Mahidol University, Thailand (No: MUPH 45/2021) and performed in accordance with the principles of the Declaration of Helsinki. The informed consent was waived because of the retrospective nature of this study.
-
Conflicts of Interest
The authors have no conflicts of interest to declare.
-
Funding
None.
-
Availability of Data
The datasets are not publicly available due to privacy or ethical restrictions according to the data sharing agreement with the National Health Security Office.
-
Authors’ Contributions
Conceptualization: all authors; Data curation: NS, JS; Formal analysis: NS, JS; Investigation: NS, JS; Methodology: all authors; Project administration: NS, JS; Supervision: JS, CV, PS; Validation: JS, CV, PS; Visualization: NS; Writing–original draft: NS, JS; Writing–review & editing: all authors. All authors read and approved the final manuscript.
Article information
-
Acknowledgements
- This research work was supported by type 2 diabetes data from the National Health Security Office (NHSO).


| Variable | Survival probability at 36 months (95% CI) |
Log-rank test |
|
|---|---|---|---|
| X2 | p | ||
| Sex | 0.03 | 0.868 | |
| Male | 0.90 (0.83–0.94) | ||
| Female | 0.91 (0.85–0.94) | ||
| Age (y) | 2.10 | 0.349 | |
| ≤49 | 0.96 (0.84–0.99) | ||
| 50–59 | 0.88 (0.79–0.94) | ||
| ≥60 | 0.90 (0.84–0.94) | ||
| Age at the diagnosis of T2DM (y) | 0.00 | 0.952 | |
| <35 | 0.92 (0.54–0.99) | ||
| ≥35 | 0.90 (0.86–0.93) | ||
| Duration of T2DM (mo) | 6.81 | 0.009* | |
| <42 | 0.92 (0.88–0.95) | ||
| ≥42 | 0.82 (0.71–0.90) | ||
| Body mass index | 2.25 | 0.523 | |
| Underweight | 0.90 (0.47–0.99) | ||
| Normal | 0.86 (0.76–0.92) | ||
| Overweight | 0.94 (0.83–0.98) | ||
| Obese | 0.91 (0.85–0.95) | ||
| Comorbid hypertension | 13.19 | <0.001* | |
| No | 0.92 (0.88–0.95) | ||
| Yes | 0.70 (0.46–0.85) | ||
| Foot examination | 0.39 | 0.535 | |
| No | 0.90 (0.86–0.97) | ||
| Yes | 0.90 (0.81–0.95) | ||
| Retina examination | 0.01 | 0.904 | |
| No | 0.90 (0.86–0.93) | ||
| Yes | 0.91 (0.79–0.96) | ||
| FBG (mg/dL) | 1.31 | 0.253 | |
| <130 | 0.93 (0.87–0.97) | ||
| ≥130 | 0.88 (0.83–0.92) | ||
| HbA1c (%) | 1.42 | 0.234 | |
| <7 | 0.88 (0.81–0.93) | ||
| ≥7 | 0.92 (0.87–0.95) | ||
| TG (mg/dL) | 0.89 | 0.345 | |
| <150 | 0.89 (0.82–0.93) | ||
| ≥150 | 0.92 (0.86–0.95) | ||
| LDL-C (mg/dL) | 0.12 | 0.734 | |
| <100 | 0.92 (0.82–0.96) | ||
| ≥100 | 0.90 (0.85–0.93) | ||
| eGFR (mL/min/1.73 m2) | 10.18 | 0.006* | |
| Normal to mild decrease (>60) | 0.93 (0.89–0.96) | ||
| Mild to moderate decrease (30–59) | 0.83 (0.70–0.91) | ||
| Severe decrease to kidney failure (<30) | 0.77 (0.49–0.91) | ||
| Characteristic | Cox PH | Weibull AFT | Log-normal AFT |
|---|---|---|---|
| Sex | |||
| Male | Ref. | ||
| Female | 0.959 | 0.907 | 0.946 |
| Age (y) | |||
| ≤49 | Ref. | ||
| 50–59 | 0.052* | 0.065* | 0.045* |
| ≥60 | 0.121 | 0.132 | 0.092* |
| Age at the diagnosis of T2DM (y) | |||
| <35 | Ref. | ||
| ≥35 | 0.134 | 0.153 | 0.166 |
| Duration of T2DM (mo) | |||
| <42 | Ref. | ||
| ≥42 | 0.003* | 0.010* | 0.029* |
| Body mass index | |||
| Underweight | Ref. | ||
| Normal | 0.666 | 0.655 | 0.959 |
| Overweight | 0.725 | 0.736 | 0.414 |
| Obese | 0.599 | 0.595 | 0.445 |
| Comorbid hypertension | |||
| No | Ref. | ||
| Yes | <0.001* | 0.001* | <0.001* |
| Foot examination | |||
| No | Ref. | ||
| Yes | 0.101 | 0.114 | 0.363 |
| Retina examination | |||
| No | Ref. | ||
| Yes | 0.128 | 0.131 | 0.391 |
| FBG (mg/dL) | |||
| <130 | Ref. | ||
| ≥130 | 0.382 | 0.394 | 0.627 |
| HbA1c (%) | |||
| <7 | Ref. | ||
| ≥7 | 0.091* | 0.099* | 0.182 |
| TG (mg/dL) | |||
| <150 | Ref. | ||
| ≥150 | 0.458 | 0.493 | 0.691 |
| LDL-C (mg/dL) | |||
| <100 | Ref. | ||
| ≥100 | 0.098* | 0.103 | 0.215 |
| eGFR (mL/min/1.73 m2) | |||
| Normal to mild decrease (>60) | Ref. | ||
| Mild to moderate decrease (30–59) | 0.002* | 0.005* | 0.002* |
| Severe decrease to kidney failure (<30) | 0.007* | 0.014* | 0.031* |
| Model | df | LL | AIC | BIC |
|---|---|---|---|---|
| Cox PH | 4 | –155.25 | 318.51 | 334.35 |
| Weibull AFT | 6 | –105.87 | 223.79 | 247.48 |
| Log-normal AFT | 6 | –103.72 | 219.44 | 243.21 |
- 1. American Diabetes Association. Diagnosis and classification of diabetes mellitus. Diabetes Care 2014;37 Suppl 1:S81−90.ArticlePubMedPDF
- 2. Sun H, Saeedi P, Karuranga S, et al. IDF Diabetes Atlas: global, regional and country-level diabetes prevalence estimates for 2021 and projections for 2045. Diabetes Res Clin Pract 2022;183:109119. ArticlePubMed
- 3. International Diabetes Federation. Diabetes around the world in 2021 [Internet]. International Diabetes Federation; 2022 [cited 2022 Nov 7]. Available from: http://diabetesatlas.org/data.
- 4. Saeedi P, Salpea P, Karuranga S, et al. Mortality attributable to diabetes in 20-79 years old adults, 2019 estimates: results from the International Diabetes Federation Diabetes Atlas, 9th edition. Diabetes Res Clin Pract 2020;162:108086. ArticlePubMed
- 5. Galicia-Garcia U, Benito-Vicente A, Jebari S, et al. Pathophysiology of type 2 diabetes mellitus. Int J Mol Sci 2020;21:6275. ArticlePubMedPMC
- 6. Khan MA, Hashim MJ, King JK, et al. Epidemiology of type 2 diabetes: global burden of disease and forecasted trends. J Epidemiol Glob Health 2020;10:107−11.ArticlePubMedPMC
- 7. Zheng Y, Ley SH, Hu FB. Global aetiology and epidemiology of type 2 diabetes mellitus and its complications. Nat Rev Endocrinol 2018;14:88−98.ArticlePubMedPDF
- 8. Potisat S, Krairittichai U, Jongsareejit A, et al. A 4-year prospective study on long-term complications of type 2 diabetic patients: the Thai DMS diabetes complications (DD.Comp.) project. J Med Assoc Thai 2013;96:637−43.PubMed
- 9. Deshpande AD, Harris-Hayes M, Schootman M. Epidemiology of diabetes and diabetes-related complications. Phys Ther 2008;88:1254−64.ArticlePubMedPMCPDF
- 10. Djrolo F, Paraiso NM, Diarra O, et al. Diabetes complications and associated factors in type 2 diabetic patients in Cotonou. J Diabetes Mellitus 2014;4:311−5.ArticlePDF
- 11. Bonora E, Trombetta M, Dauriz M, et al. Chronic complications in patients with newly diagnosed type 2 diabetes: prevalence and related metabolic and clinical features: the Verona Newly Diagnosed Type 2 Diabetes Study (VNDS) 9. BMJ Open Diabetes Res Care 2020;8:e001549.ArticlePubMedPMC
- 12. TODAY Study Group, Bjornstad P, Drews KL, et al. Long-term complications in youth-onset type 2 diabetes. N Engl J Med 2021;385:416−26.ArticlePubMedPMC
- 13. Gallman EC, Conner RS, Johnson E. Improving the detection of foot abnormalities in patients with diabetes. Clin Diabetes 2017;35:55−9.ArticlePubMedPMCPDF
- 14. Assem AS, Tegegne MM, Alemu DS, et al. Knowledge about diabetic retinopathy, eye check-up practice and associated factors among adult patients with diabetes mellitus attending at debark hospital, Northwest Ethiopia. BMC Ophthalmol 2020;20:453. ArticlePubMedPMCPDF
- 15. Lewis JE, Morris K, Powell T, et al. Combining diabetic foot and retinopathy screening: a step in the right direction?: a feasibility study. SAGE Open Med 2020;8:2050312120946244. ArticlePubMedPMCPDF
- 16. Singh R, Mukhopadhyay K. Survival analysis in clinical trials: basics and must know areas. Perspect Clin Res 2011;2:145−8.ArticlePubMedPMC
- 17. George B, Seals S, Aban I. Survival analysis and regression models. J Nucl Cardiol 2014;21:686−94.ArticlePubMedPMCPDF
- 18. Faruk A. The comparison of proportional hazards and accelerated failure time models in analyzing the first birth interval survival data. J Phys Conf Ser 2018;974:012008. ArticlePDF
- 19. Schober P, Vetter TR. Survival analysis and interpretation of time-to-event data: the tortoise and the hare. Anesth Analg 2018;127:792−8.ArticlePubMedPMC
- 20. Kubi MG, Lasisi KE, Rasheed BA. Parametric and semi-parametric survival models with application to diabetes data. Sci J Biomed Eng Biomed Sci 2022;3:1−10.
- 21. Wu J. Single-arm phase II survival trial design under the proportional hazards model. Stat Biopharm Res 2017;9:25−34.ArticlePubMedPMC
- 22. Tantigegn S, Ewunetie AA, Agazhe M, et al. Time to diabetic neuropathy and its predictors among adult type 2 diabetes mellitus patients in Amhara regional state Comprehensive Specialized Hospitals, Northwest Ethiopia, 2022: a retrospective follow up study. PLoS One 2023;18:e0284568.ArticlePubMedPMC
- 23. Shamshirgaran SM, Mamaghanian A, Aliasgarzadeh A, et al. Age differences in diabetes-related complications and glycemic control. BMC Endocr Disord 2017;17:25. ArticlePubMedPMCPDF
- 24. Lim JU, Lee JH, Kim JS, et al. Comparison of World Health Organization and Asia-Pacific body mass index classifications in COPD patients. Int J Chron Obstruct Pulmon Dis 2017;12:2465−75.ArticlePubMedPMCPDF
- 25. Narindrarangkura P, Bosl W, Rangsin R, et al. Prevalence of dyslipidemia associated with complications in diabetic patients: a nationwide study in Thailand. Lipids Health Dis 2019;18:90. ArticlePubMedPMCPDF
- 26. ElSayed NA, Aleppo G, Aroda VR, et al. 6. Glycemic targets: standards of care in diabetes-2023. Diabetes Care 2023;46(Suppl 1). S97−110.
- 27. Kidney Disease: Improving Global Outcomes (KDIGO) Diabetes Work Group. KDIGO 2022 Clinical Practice Guideline for Diabetes Management in Chronic Kidney Disease. Kidney Int 2022;102(5S). S1−127.ArticlePubMed
- 28. Etikan I, Abubakar S, Alkassim R. The Kaplan-Meier estimate in survival analysis. Biom Biostat Int J 2017;5:55−9.Article
- 29. Deo SV, Deo V, Sundaram V. Survival analysis-part 2: Cox proportional hazards model. Indian J Thorac Cardiovasc Surg 2021;37:229−33.ArticlePubMedPMCPDF
- 30. Yao Y. Several methods to assess proportional hazard assumption when applying COX regression model. PharmaSUG China 2018;SP−75.
- 31. Saikia R, Barman MP. A review on accelerated failure time models. Int J Stat Syst 2017;12:311−22.
- 32. Zhang Z. Parametric regression model for survival data: Weibull regression model as an example. Ann Transl Med 2016;4:484. ArticlePubMedPMC
- 33. Bellavia A, Bottai M, Orsini N. Evaluating additive interaction using survival percentiles. Epidemiology 2016;27:360−4.ArticlePubMedPMC
- 34. Piliponiene L, Velickiene D, Kregzdyte R. Microvascular complications, peripheral artery disease and mortality in patients with type 2 diabetes mellitus, in two counties of Southern Lithuania over 13 years: analysis using a cohort database of the national health insurance. Medicina (Kaunas) 2021;57:1380. ArticlePubMedPMC
- 35. Gashaye Shita N, Sharew Iyasu A. Predictors of blood glucose change and microvascular complications of type 2 diabetes mellitus patients in Felege Hiwot and Debre Markos referral hospital, North West Ethiopia. BMC Endocr Disord 2022;22:136. PubMedPMC
- 36. keshavarzi F, Askarishahi M, Foumani MG, et al. Parametric and the Cox risk model in the analysis of factors affecting the time of diagnosis of retinopathy with patients type 2 diabetes. AIMS Med Sci 2019;6:170−8.Article
- 37. Haghighatpanah M, Nejad AS, Haghighatpanah M, et al. Factors that correlate with poor glycemic control in type 2 diabetes mellitus patients with complications. Osong Public Health Res Perspect 2018;9:167−74.ArticlePubMedPMCPDF
- 38. Hammoudi J, Dahmani H, Bouanani NH, et al. Risk factors and diabetes related complications frequency in the population of the northeastern Morocco. Open J Epidemiol 2018;8:164−85.ArticlePDF
- 39. Jing X, Chen J, Dong Y, et al. Related factors of quality of life of type 2 diabetes patients: a systematic review and meta-analysis. Health Qual Life Outcomes 2018;16:189. ArticlePubMedPMCPDF
- 40. Kosiborod M, Gomes MB, Nicolucci A, et al. Vascular complications in patients with type 2 diabetes: prevalence and associated factors in 38 countries (the DISCOVER study program). Cardiovasc Diabetol 2018;17:150. ArticlePubMedPMCPDF
- 41. Zoungas S, Woodward M, Li Q, et al. Impact of age, age at diagnosis and duration of diabetes on the risk of macrovascular and microvascular complications and death in type 2 diabetes. Diabetologia 2014;57:2465−74.ArticlePubMedPDF
- 42. Kebede SA, Tusa BS, Weldesenbet AB, et al. Time to diabetic neuropathy and its predictors among newly diagnosed type 2 diabetes mellitus patients in Northwest Ethiopia. Egypt J Neurol Psychiatr Neurosurg 2021;57:147. ArticlePDF
- 43. Wolde HF, Atsedeweyen A, Jember A, et al. Predictors of vascular complications among type 2 diabetes mellitus patients at University of Gondar Referral Hospital: a retrospective follow-up study. BMC Endocr Disord 2018;18:52. ArticlePubMedPMCPDF
- 44. Leulseged TW, Ayele BT. Time to optimal glycaemic control and prognostic factors among type 2 diabetes mellitus patients in public teaching hospitals in Addis Ababa, Ethiopia. PLoS One 2019;14:e0220309.ArticlePubMedPMC
- 45. Pambudi AS, Pramana S. Survival analysis of patient diabetes mellitus type II with complication (study case of medical record from 2012 to 2015 in general hospital of Dr. Moewardi Surakarta). Adv Sci Lett 2018;24:6882−5.Article
- 46. Lin CH, Armstrong DG, Liu PH, et al. Survival of patients following first diagnosis of diabetic foot complications: a nationwide 15-year longitudinal analysis. Front Endocrinol (Lausanne) 2021;12:801324. ArticlePubMedPMC
- 47. Ohishi M. Hypertension with diabetes mellitus: physiology and pathology. Hypertens Res 2018;41:389−93.ArticlePubMedPDF
- 48. Meeme A, Kasozi H. Effect of glycaemic control on glomerular filtration rate in diabetes mellitus patients. Afr Health Sci 2009;9(Suppl 1). S23−6.PubMedPMC
- 49. Zhao Z, Huo L, Wang L, et al. Survival of Chinese people with type 2 diabetes and diabetic kidney disease: a cohort of 12 -year follow-up. BMC Public Health 2019;19:1498. ArticlePubMedPMCPDF
- 50. Jing N, Pan M, Song Y, et al. Renal outcomes and prognostic factors in patients with type-2 diabetes and chronic kidney disease confirmed by renal biopsy. Ther Adv Chronic Dis 2021;12:20406223211052388. ArticlePubMedPMCPDF
- 51. Tanabe H, Saito H, Machii N, et al. Burden of undiagnosed type 2 diabetes in diabetic kidney disease: a Japanese retrospective cohort study. J Clin Med 2020;9:2028. ArticlePubMedPMC
- 52. Sheen YJ, Sheu WH. Risks of rapid decline renal function in patients with type 2 diabetes. World J Diabetes 2014;5:835−46.ArticlePubMedPMC
- 53. Fujii M, Ohno Y, Ikeda A, et al. Current status of the rapid decline in renal function due to diabetes mellitus and its associated factors: analysis using the National Database of Health Checkups in Japan. Hypertens Res 2023;46:1075−89.ArticlePubMedPMCPDF
- 54. Teni DA, Enquoselassie F, Atsmeg C. Survival analysis of diabetes mellitus patients using parametric, non-parametric and semi-parametric approaches: Addis Ababa, Ethiopia. Ethiop eJ Res Innov Foresight 2015;7:20−39.
- 55. Kargarian-Marvasti S, Rimaz S, Abolghasemi J, et al. Comparing of Cox model and parametric models in analysis of effective factors on event time of neuropathy in patients with type 2 diabetes. J Res Med Sci 2017;22:115. ArticlePubMedPMC
- 56. Rad MM, Soheilipour FS, Baradaran HR, et al. The influence of diabetic family history on the development of neuropathy in type 2 diabetic patients: a survival analysis. Rom J Diabetes Nutr Metab Dis 2020;27:25−33.
- 57. Grover G, Sabharwal A. A parametric approach to estimate survival time of diabetic nephropathy with left truncated and right censored data. Int J Stat Probab 2012;1:128−37.Article
- 58. Hosseini Teshnizi S, Taghi Ayatollahi SM. Comparison of Cox regression and parametric models: application for assessment of survival of pediatric cases of acute leukemia in Southern Iran. Asian Pac J Cancer Prev 2017;18:981−5.PubMedPMC
- 59. Bradburn MJ, Clark TG, Love SB, et al. Survival analysis part II: multivariate data analysis: an introduction to concepts and methods. Br J Cancer 2003;89:431−6.ArticlePubMedPMCPDF
 Cite
Cite