
Articles
- Page Path
- HOME > Osong Public Health Res Perspect > Volume 4(3); 2013 > Article
-
Original Article
Estimation of the Infection Window for the 2010/2011 Korean Foot-and-Mouth Disease Outbreak - Hachung Yoona, Soon-Seek Yoona, Han Kima, Youn-Ju Kima, Byounghan Kimb, Sung-Hwan Weec
-
Osong Public Health and Research Perspectives 2013;4(3):127-132.
DOI: https://doi.org/10.1016/j.phrp.2013.04.010
Published online: May 15, 2013
aVeterinary Epidemiology Division, Animal and Plant Quarantine Agency, Anyang, Korea
bFoot-and-Mouth Disease Division, Animal and Plant Quarantine Agency, Anyang, Korea
cLivestock Products Standard Division, Animal and Plant Quarantine Agency, Anyang, Korea
- ∗Corresponding author. heleney@korea.kr
© 2013 Published by Elsevier B.V. on behalf of Korea Centers for Disease Control and Prevention.
This is an Open Access article distributed under the terms of the Creative Commons Attribution Non-Commercial License (http://creativecommons.org/licenses/by-nc/3.0) which permits unrestricted non-commercial use, distribution, and reproduction in any medium, provided the original work is properly cited.
Abstract
-
Objectives
- This study aims to develop a method for calculating infection time lines for disease outbreaks on farms was developed using the 2010/2011 foot-and-mouth disease (FMD) epidemic in the Republic of Korea.
-
Methods
- Data on farm demography, the detection date of FMD, the clinical history for the manifestation of lesions, the presence of antibodies against FMD virus (including antibodies against the structural and nonstructural proteins of serotype O), vaccination status (O1 Manisa strain), the number of reactors and information on the slaughter of infected animals were utilized in this method.
-
Results
- Based on estimates of the most likely infection date, a cumulative detection probability that an infected farm would be identified on a specific day was determined. Peak infection was observed between late December and early January, but peak detection occurred in mid-January. The early detection probability was highest for pigs, followed by cattle (dairy, then beef) and small ruminants. Nearly 90% of the infected pig farms were detected by Day 11 post-infection while 13 days were required for detection for both dairy and beef cattle farms, and 21 days were necessary for small ruminant (goat and deer) farms. On average, 8.1 ± 3.1 days passed prior to detecting the presence of FMD virus on a farm. The interval between infection and detection of FMD was inversely associated with the intensity of farming.
-
Conclusion
- The results of our study emphasize the importance of intensive clinical inspection, which is the quickest method of detecting FMD infection and minimizing the damage caused by an epidemic.
- Foot-and-mouth disease (FMD) is one of the most contagious viral diseases of cloven-hoofed animals and occurs sporadically and endemically in many parts of the world except for Europe, North America, and Oceania [1]. An outbreak of FMD results in economic losses because of the control measures used (e.g., movement restrictions, vaccination, and slaughter) and decreased productivity, both of which affect the entire livestock industry. When an infected or suspected farm is detected, a thorough investigation should be made of all animals, vehicles, personnel, and materials moved on and off the farm for the duration of the risk period associated with the introduction and transmission of the virus [2]. Epidemiological data should be used to construct contact networks between farms according to contact tracing and the estimated infection time line. Infection time lines include estimates of the temporal windows during which a farm was most likely to have been infected and the infectious period surrounding the infected farms. During the 2010/2011 FMD epidemic in the Republic of Korea, emergency vaccination was implemented 1 month after detection of the index case; this policy ultimately became a vaccine-to-live policy. Vaccinations were initiated on cattle farms within the outbreak areas, but were later extended to include all cloven-hoofed animals in Korea. As a result, vaccination status differed with the time of infection, time of detection, animal species, and farm type. Considering the diverse vaccination conditions of the infected farms, all available information, including serological test results, clinical manifestation, and disease dynamics, should be integrated to estimate the infection time line. Moreover, a standard protocol should be developed to apply consistent criteria to each infected farm. In this paper, we present a method for calculating the infection time line at the farm level using the 2010/2011 FMD epidemic in Korea as a reference.
Introduction
- 2.1 Data on the infected farms
- This study included 3748 farms on which at least one serological reactor was confirmed during the FMD epidemic of November 2010 to April 2011. The data used in this study were extracted from the FMD database of the Animal Plant and Fisheries Quarantine and Inspection Agency and included the following: farm demography, the detection date of FMD, the clinical history for the manifestation of lesions, the presence of antibodies against the structural protein (SP) or nonstructural protein (NSP) of FMD serotype O, vaccination status (O1 Manisa strain), the number of reactors, and records on the slaughter of infected animals. Farms were classified by type according to the major species of animal farmed. The study population consisted of 1425 beef cattle, 509 dairy cattle, 1727 pig, 44 goat, and 43 deer farms. The FMD database has been described elsewhere [3].
- 2.2 The most likely time of infection
- The criteria used to estimate the most likely time of infection were prioritized according to the chronological dynamics of FMD virus infection in animals: viremia, clinical lesions, and antibody response [4,5]. The method used to estimate the infection time differed according to vaccination status. However, the presence of NSP antibodies was given the highest priority regardless of vaccination status. If NSP antibodies were detected in at least one animal on a farm, the first animal in this herd was estimated to have been infected at least 11 days (pigs), 13 days (cattle), or 15 days (small ruminants) prior to detection. The second priority for the non-vaccinated farms was the presence of SP antibodies. If SP antibodies were detected, the first infection had to have occurred at least 6 days (pigs), 8 days (cattle), or 10 days (small ruminants) prior to detection. These intervals were inferred from the literature [6–8]. If neither NSP nor SP antibodies were detected, then the infection time was calculated as the age of the oldest clinical lesion plus the incubation period (5 days for cattle, 4 days for pigs, and 6 days for small ruminants [9]) subtracted from the date of detection, which was the same date that the examination for clinical lesions was performed. The age of the clinical lesions was determined using the “Foot and Mouth Disease Aging of Lesions” criteria [10]. On subclinically infected farms, the incubation period was estimated backwards from the time of detection. When several reactors were present on a farm, species-specific simulated patterns of within-herd transmission were also considered [1,11,12]. For vaccinated farms, the second priority was the manifestation of clinical signs. For subclinically infected farms, the incubation period was subtracted from the date of detection. On the vaccinated farms, the presence of SP antibodies was considered only if the reactors showed clinical lesions within 3 days of vaccination. When clinical signs of FMD were observed 4–7 days postvaccination, the infection dates were independently estimated based on the presence of SP antibody and clinical signs. Then, the two estimated dates (with and without the presence of SP antibodies) were compared, and the earliest date of the two estimates was considered the infection date. For farms that were detected more than 14 days postvaccination, the presence of SP antibodies was ignored when determining the infection time.
- 2.3 Statistical analysis of the time distribution
- All analyses in the present study were performed at the farm level and separately according to farm type. Taking into account the small number of infected farms for goats (n = 44) and deer (n = 43), these two farm types were combined and the new class “small ruminants” was generated.
- The cumulative probability that a farm would be detected on a specific day t was estimated as a detection density function,
- The distribution of data for the time interval between the most likely time of infection and detection was fit to the probability density function using maximum likelihood estimates. Goodness of fit was evaluated using the Anderson–Darling test because the time interval was a continuous scale. The estimation of the distribution was performed using @RISK 5.0 (Palisade Inc., Newfield, NY, USA).
Materials and Methods
- The daily number of farms infected and detected showed a similar distribution pattern. A 5–10-day gap was observed between infection and detection of the infected farms. However, the shape of the detected distribution was less smooth than the infected distribution for the period from late January 2011 to February 2011. The infection peak was observed between late December and early January, while detection peaked in mid-January (Figure 1).
- The cumulative probability of detection increased with elapsed time and showed an inverse-exponential curve for pigs and a sigmoidal shape for small ruminants. The probability of early detection was the highest for pig farms, followed by dairy and beef cattle farms, and small ruminant farms. Almost 90% of the infected farms were detected by Day 11 postinfection for pig farms, by Day 13 for both dairy and beef cattle farms, and by Day 21 for small ruminant farms (Figure 2).
- A mean ± standard deviation of 8.1 ± 3.1 days passed prior to the detection of FMD infection on a farm, which we defined as a “detection delay”. The detection delays were shortest for pig farms (7.1 ± 2.5 days) and longest for deer farms where a large variation was also observed (14.4 ± 8.1 days). These time intervals did not present any kind of temporal variation or trend. The coefficient of correlation (r) between the detection delay and the number of days elapsed since the start of the epidemic was −0.02 (p = 0.99). However, the detection delays were significantly different relative to farm type (F-ratio in the analysis of variance, ANOVA = 202.10, p < 0.001). The best fit distributions were Weibull for beef cattle, Pearson type 5 for dairy cattle, Beta General for pigs, and Normal for small ruminants (Table 1).
Results
- Clinical signs are the most convenient indicators of an outbreak and can be related to the progression of disease. In the case of FMD, the most likely time of infection can be estimated on the basis of the oldest clinical lesion in the herd. Such estimations have been used to construct transmission pathways [13,14], understand the pattern of virus excretion [15,16], assess the efficacy of control measures [17], simulate modeling programs [18], and identify the risk factors associated with disease transmission [19]. However, the use of clinical signs is not always feasible because the manifestation of clinical signs is not always obvious; symptoms are less clear in sheep, goats, and deer, for example, than in pigs and cattle [3]. In addition, vaccination against FMD may prevent animals from developing clinical lesions even when infected [20]. It is also possible that the earliest infected animals in a herd are missed until a greater number of animals show clinical signs [15]. If an infected farm can be detected prior to the development of clinical signs (i.e., during the incubation period) through active serological surveillance in association with contact with an infected farm, then relying on clinical lesions is no longer necessary [3,21]. In our method, the detection of NSP antibodies was, for various reasons, the top priority when estimating the infection date. It was possible to distinguish vaccinated from nonvaccinated animals with an NSP enzyme-linked immuno sorbent assay (ELISA) using 3ABC [22] or 3AB [23]. Moreover, SP antibodies develop quicker than NSP antibodies [8]. The seroconversion times reported in the literature are 5 days postinfection for SP antibodies in calves and 10 days postinfection for NSP antibodies in pigs, cattle, and calves [6–8]. Thus, using antibody detection as a criterion was plausible because all 3748 infected farms were confirmed by laboratory diagnosis. However, not all animals suspected of being infected were tested for the presence of antibodies. Our protocol remains reliable, however, because animals showing the most severe clinical lesions were purposefully chosen for specimen collection to detect the reactor [24].
- The time interval between initial infection and detection ranged from 6 days to 15 days in modeling studies [3,25]. However, these estimations include uncertainties because of the assumptions used in their calculation. In the present study, the time courses used to estimate infection time (e.g., latency, incubation, and seroconversion for SP and NSP antibodies) were shorter for pigs than for cattle or small ruminants, which might influence the detection delays in our estimation. This influence appears negligible, however, based on our previous work in which the interval between infection and the detection of clinical signs was shortest in pigs, and the manifestation of clinical signs was independent of vaccination status [3]. Although the parameters of infection and detection could change during the epidemic [24], such change was not considered because the time elapsed from the start of the epidemic did not affect the detection delay, and no correlation was observed between detection delay and the start of the epidemic in the present study (r = −0.02, p = 0.99).
- Detection delays appeared to be associated with within-herd transmission, the type of animal and herd, and the size and density of the herd. Transmission of FMD within an animal herd is influenced by the viability and virulence of the virus strain, and FMD is not easily controlled. Temperature and pH are well-known determinants of FMD virus survival, and the virus is capable of remaining viable under cool conditions [26]. In hot climates, direct transmission through the movement of animals is believed to be the most important factor [27], but in cold weather, such as during winter in Korea when the average temperature in January can drop as low as −7°C [28], the disinfection of inorganic substances (e.g., vehicles, materials, etc.) can be difficult. Indirect mechanical transmission of the virus, which can persist in the environment, would be the main concern for biosecurity and disease control. Another factor to consider is human (farmer) behavior [29]. In an intensive production system, the indirect contact between animals is mainly the result of human activities. Thus, in Korea, the disease might have spread faster among animals in intensive farming systems such as pigs and dairy cattle. Moreover, detection may have occurred earlier than in an extensive production system. The probability of detecting FMD therefore seems to be largely dependent on the frequency and intensity of observations made by the farmers, and thus a result of human action. An example of how the risk of infection could be controlled through clinical observation was observed during the FMD outbreak in the UK. As the movement of animals is considered the highest risk factor for disease transmission, during the 2007 FMD outbreaks in England all animals intended for shipment to Scotland were clinically inspected. These inspections reduced the estimated probability of missing infected ovine farms by half within 15 days [30].
- In conclusion, this study describes an essential but often overlooked step in field epidemiology. Our protocol for estimating the infection time of FMD virus on a farm was designed to measure the time required to detect the infection, which directly influences the efficacy of control measures. The interval between infection and detection of FMD was inversely associated with the intensity of farming. Our findings emphasize the importance of intensive clinical inspections as the quickest method for detecting FMD infections and minimizing the damage caused by an epidemic. The method of estimating the infection window proposed in this study can be used to improve the accuracy of emergency responses in case of an FMD outbreak.
Discussion
-
Acknowledgements
- This study was funded by the Research and Development program of the Animal and Plant Quarantine Agency [Project No. I-AD17-2011-12-01].
Acknowledgments
-
This is an Open Access article distributed under the terms of the Creative Commons Attribution Non-Commercial License (http://creativecommons.org/licenses/by-nc/3.0) which permits unrestricted non-commercial use, distribution, and reproduction in any medium, provided the original work is properly cited.
Article information
- 1. Brito B.P., Perez A.M., Cosentino B.. Factors associated with within-herd transmission of serotype A foot-and-mouth disease virus in cattle, during the 2001 outbreak in Argentina: a prospective effect of vaccination. Transbound Emerg Dis 58(5). 2011 Oct;387−393. PMID: 21896154.ArticlePubMed
- 2. Klein J.. Understanding the molecular epidemiology of foot-and-mouth disease virus. Infect Genet Evol 9(2). 2009 Mar;153−161. PMID: 19100342.ArticlePubMed
- 3. Yoon H., Yoon S.S., Wee S.H.. Clinical manifestation of foot-and-mouth disease during the 2010/2011 epidemic in the Republic of Korea. Transbound Emerg Dis 59(6). 2012 Dec;517−525. PMID: 22273469.ArticlePubMed
- 4. Alexandersen S., Quan M., Murphy C.. Studies of quantitative parameters of virus excretion and transmission in pigs and cattle experimentally infected with foot-and-mouth disease virus. J Comp Pathol 129(4). 2003 Nov;268−282. PMID: 14554125.ArticlePubMed
- 5. Quan M., Murphy C.M., Zhang Z.. Determinants of early foot-and-mouth disease virus dynamics in pigs. J Comp Pathol 131(4). 2004 Nov;294−307. PMID: 15511538.ArticlePubMed
- 6. Chen S.P., Ellis T.M., Lee M.C.. Comparison of sensitivity and specificity in three commercial foot-and-mouth disease virus non-structural protein ELISA kits with swine sera in Taiwan. Vet Microbiol 119(2–4). 2007 Jan 31;164−172. PMID: 17112687.Article
- 7. Ryan E., Gloster J., Reid S.M.. Clinical and laboratory investigation of the outbreaks of foot-and-mouth disease in southern England in 2007. Vet Rec 163(5). 2008 Aug 2;139−147. PMID: 18676997.Article
- 8. Mohapatra J.K., Pandey L.K., Sanyal A.. Recombinant non-structural polyprotein 3AB-based serodiagnostic strategy for FMD surveillance in bovines irrespective of vaccination. J Virol Methods 177(2). 2011 Nov;184−192. PMID: 21864578.ArticlePubMed
- 9. Mardones F., Perez A., Sanchez J.. Parameterization of the duration of infection stages of serotype O foot-and-mouth disease virus: an analytical review and meta-analysis with application to simulation models. Vet Res 41(4). 2010 Jul–Aug;45PMID: 20205988.ArticlePubMed
- 10. Department for Environment, Food and Rural Affairs (Defra). Foot and mouth disease aging of Lesions. January 2005. Defra; London.
- 11. Carpenter T.E., Thurmond M.C., Bates T.W.. A simulation model of intraherd transmission of foot and mouth disease with reference to disease spread before and after clinical diagnosis. J Vet Diagn Invest 16(1). 2004 Jan;11−16. PMID: 14974841.ArticlePubMed
- 12. Heuer C., French N.P., Jackson R.. Application of modeling to determine the absence of foot-and-mouth disease in the face of a suspected incursion. N Z Vet J 55(6). 2007 Dec;289−296. PMID: 18059646.ArticlePubMed
- 13. Cottam E.M., Haydon D.T., Paton D.J.. Molecular epidemiology of the foot-and-mouth disease virus outbreak in the United Kingdom in 2001. J Virol 80(22). 2006 Nov;11274−11282. PMID: 16971422.ArticlePubMed
- 14. Cottam E.M., Thébaud G., Wadsworth J.. Integrating genetic and epidemiological data to determine transmission pathways of foot-and-mouth disease virus. ProcBiol Sci 275(1637). 2008 Apr 22;887−895.Article
- 15. Sanson R.L., Gloster J., Burgin L.. Reanalysis of the start of the UK 1967 to 1968 foot-and-mouth disease epidemic to calculate airborne transmission probabilities. Vet Rec 169(13). 2011 Sep 24;336PMID: 21846685.Article
- 16. Muroga N., Hayama Y., Yamamoto T.. The foot-and-mouth disease epidemic in Japan, 2010. J Vet Med Sci 74(4). 2012 Apr;399−404. PMID: 22075710.ArticlePubMed
- 17. Wee S.H., Nam H.M., Moon O.K.. Using field-based epidemiological methods to investigate FMD outbreaks: an example from the 2002 outbreak in Korea. Transbound Emerg Dis 55(9–10). 2008 Dec;404−410. PMID: 18803614.ArticlePubMed
- 18. Yoon H., Wee S.H., Stevenson M.A.. Simulation analyses to evaluate alternative control strategies for the 2002 foot-and-mouth disease outbreak in the Republic of Korea. Prev Vet Med 74(2–3). 2006 May 17;212−225. PMID: 16423417.Article
- 19. Bessell P.R., Shaw D.J., Savill N.J.. Estimating risk factors for farm-level transmission of disease: foot and mouth disease during the 2001 epidemic in Great Britain. Epidemics 2(3). 2010 Sep;109−115. PMID: 21352781.ArticlePubMed
- 20. Madhanmohan M., Nagendrakumar S.B., Kumar R.. Clinical protection, sub-clinical infection and persistence following vaccination with extinction payloads of O(1) Manisa foot-and-mouth disease monovalent vaccine and challenge in goats and comparison with sheep. Res Vet Sci 93(2). 2012 Oct;1050−1059. PMID: 22079173.ArticlePubMed
- 21. Cottam E.M., Wadsworth J., Shaw A.E.. Transmission pathways of foot-and-mouth disease virus in the United Kingdom in 2007. PLOS Pathog 4(4). 2008 Apr 18;e1000050PMID: 18421380.Article
- 22. Fu Y., Cao Y., Sun P.. Development of a dot immunoblot method for differentiation of animals infected with foot-and-mouth disease virus from vaccinated animals using non-structural proteins expressed prokaryotically. J Virol Methods 171(1). 2011 Jan;234−240. PMID: 21087638.ArticlePubMed
- 23. Jaworski J.P., Compaired D., Trotta M.. Validation of an r3AB1-FMDV-NSP ELISA to distinguish between cattle infected and vaccinated with foot-and-mouth disease virus. J Virol Methods 178(1–2). 2011 Dec;191−200. PMID: 21946290.ArticlePubMed
- 24. Chis Ster I., Singh B.K., Ferguson N.M.. Epidemiological inference for partially observed epidemics: the example of the 2001 foot and mouth epidemic in Great Britain. Epidemics 1(1). 2009 Mar;21−34. PMID: 21352749.ArticlePubMed
- 25. Rautureau S., Dufour B., Durand B.. Structuring the passive surveillance network improves epizootic detection and control efficacy: a simulation study on foot-and-mouth disease in France. Transbound Emerg Dis 59(4). 2012 Aug;311−322. PMID: 22107890.ArticlePubMed
- 26. Bøtner A., Belsham G.J.. Virus survival in slurry: analysis of the stability of foot-and-mouth disease, classical swine fever, bovine viral diarrhea and swine influenza viruses. Vet Microbiol 157(1-2). 2012 May 25;41−49. PMID: 22226541.Article
- 27. Madin B.. An evaluation of foot-and-mouth disease outbreak reporting in mainland South-East Asia from 2000 to 2010. Prev Vet Med 102(3). 2011 Dec 1;230−241. PMID: 21889809.Article
- 28. http://www.kma.go.kr/weather/climate/average_south.jsp.
- 29. Alexandersen S., Zhang Z., Donaldson A.I.. The pathogenesis and diagnosis of foot-and-mouth disease. J Comp Pathol 129(1). 2003 Jul;1−36. PMID: 12859905.ArticlePubMed
- 30. Volkova V.V., Bessell P.R., Woolhouse M.E.. Evaluation of risks of foot-and-mouth disease in Scotland to assist with decision making during the 2007 outbreak in the UK. Vet Rec 169(5). 2011 Jul 30;124PMID: 21730033.Article
References

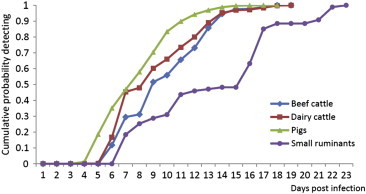
Figure & Data
References
Citations
- Estimating the time of infection for African swine fever in pig farms in Korea
Hachung Yoon, Youngmin Son, Kyung-Sook Kim, Ilseob Lee, Yeon-Hee Kim, Eunesub Lee
Frontiers in Veterinary Science.2023;[Epub] CrossRef - A Meta-Population Model of Potential Foot-and-Mouth Disease Transmission, Clinical Manifestation, and Detection Within U.S. Beef Feedlots
Aurelio H. Cabezas, Michael W. Sanderson, Victoriya V. Volkova
Frontiers in Veterinary Science.2020;[Epub] CrossRef - Probabilistic assessment of potential leachate leakage from livestock mortality burial pits: A supervised classification approach using a Gaussian mixture model (GMM) fitted to a groundwater quality monitoring dataset
Hyun-Koo Kim, Kyoung-Ho Kim, Seong-Taek Yun, Junseop Oh, Ho-Rim Kim, Sun-Hwa Park, Moon-Su Kim, Tae-Seung Kim
Process Safety and Environmental Protection.2019; 129: 326. CrossRef - Using Simulated Annealing to Improve the Information Dissemination Network Structure of a Foreign Animal Disease Outbreak Response
James D. Pleuss, Jessica L. Heier Stamm, Jason D. Ellis
Journal of Homeland Security and Emergency Managem.2018;[Epub] CrossRef - Managing complexity: Simplifying assumptions of foot-and-mouth disease models for swine
A. C. Kinsley, K. VanderWaal, M. E. Craft, R. B. Morrison, A. M. Perez
Transboundary and Emerging Diseases.2018; 65(5): 1307. CrossRef - A study on the spread of the foot-and-mouth disease in Korea in 2010/2011
Jihyun Hwang, Changhyuck Oh
Journal of the Korean Data and Information Science.2014; 25(2): 271. CrossRef - Summing Up Again
Hae-Wol Cho, Chaeshin Chu
Osong Public Health and Research Perspectives.2014; 5(4): 177. CrossRef - Atmospheric pathway: A possibility of continuous outbreaks of foot-and-mouth disease in South Korea in 2010–2011
Prueksakorn Kritana, Kim Taehyeung, Kim Hyeontae, Kim Ki Youn, Son Wongeun
Computers and Electronics in Agriculture.2014; 108: 95. CrossRef - Journal Publishing: Never Ending Saga
Hae-Wol Cho, Chaeshin Chu
Osong Public Health and Research Perspectives.2014; 5(1): 1. CrossRef - Roll the Dice
Hae-Wol Cho, Chaeshin Chu
Osong Public Health and Research Perspectives.2014; 5(5): 243. CrossRef - Years of Epidemics (2009–2011): Pandemic Influenza and Foot-and-Mouth Disease Epidemic in Korea
Hae-Wol Cho, Chaeshin Chu
Osong Public Health and Research Perspectives.2013; 4(3): 125. CrossRef
 PubReader
 Cite
Cite

