
Articles
- Page Path
- HOME > Osong Public Health Res Perspect > Volume 8(6); 2017 > Article
-
Original Article
Effects of Timely Control Intervention on the Spread of Middle East Respiratory Syndrome Coronavirus Infection - Ilsu Choia, Dong Ho Leeb, Yongkuk Kimb
-
Osong Public Health and Research Perspectives 2017;8(6):373-376.
DOI: https://doi.org/10.24171/j.phrp.2017.8.6.03
Published online: December 31, 2017
aDepartment of Statistics, Chonnam National University, Gwangju, Korea
bDepartment of Mathematics, Kyungpook National University, Daegu, Korea
- Corresponding author: Yongkuk Kim, E-mail: yongkuk@knu.ac.kr
Copyright ©2017, Korea Centers for Disease Control and Prevention
This is an open access article under the CC BY-NC-ND license (http://creativecommons.org/licenses/by-nc-nd/4.0/).
Abstract
-
Objectives
- The 2015 Middle East Respiratory Syndrome Coronavirus (MERS-CoV) outbreak in Korea caused major economic and social problems. The control intervention was conducted during the MERS-CoV outbreak in Korea immediately after the confirmation of the index case. This study investigates whether the early risk communication with the general public and mass media is an effective preventive strategy.
-
Methods
- The SEIR (Susceptible, Exposed, Infectious, Recovered) model with estimated parameters for the time series data of the daily MERS-CoV incidence in Korea was considered from May to December 2015. For 10,000 stochastic simulations, the SEIR model was computed using the Gillespie algorithm. Depending on the time of control intervention on the 20th, 40th, and 60th days after the identification of the index case, the box plots of MERS-CoV incidences in Korea were computed, and the results were analyzed via ANOVA.
-
Results
- The box plots showed that there was a significant difference between the non-intervention and intervention groups (the 20th day, 40th day, and 60th day groups) and seemed to show no significant difference based on the time of intervention. However, the ANOVA revealed that early intervention was a good strategy to control the disease.
-
Conclusion
- Appropriate risk communication can secure the confidence of the general public in the public health authorities.
- The emergence of Middle East respiratory syndrome coronavirus (MERS-CoV) in South Korea in 2015 exerted huge social and economic tolls. Mathematical models are effective for understanding and controlling the spread of MERS-CoV, and so far, many attempts at applying mathematical models have been made to understand the MERS-CoV outbreak in Korea [1–9]. The control intervention was conducted during the MERS-CoV outbreak in Korea immediately after the confirmation of the index case. Using a mathematical model, we investigated whether the early risk communication with the general public and mass media is an effective preventive strategy.
- The SEIR (Susceptible, Exposed, Infectious, Recovered) model with estimated parameters from the time series data on the daily incidence of MERS-CoV in Korea was considered from May to December 2015. For the 10,000 stochastic simulations, the SEIR model was computed using the Gillespie algorithm. Depending on the time of control interventions on the 20th, 40th, and 60th days since the index case was identified, the box plots of MERS-CoV incidences in Korea were computed, and then analysis of variance (ANOVA) was used to analyze the results.
INTRODUCTION
- 1. The basic model for MERS-CoV dynamics
- The following SEIR model by Lee et al. [10] that categorizes each individual into one of the six epidemiological classes was considered: susceptible (S), exposed (or high-risk latent) (E), symptomatic and infectious (I), infectious but asymptomatic (A), hospitalized (H), and recovered (R).
- It was assumed that not only infectious and hospitalized individuals, but also asymptomatic individuals could infect others. The parameters β, l1, l2, κ, ρ, γa, γI and γr represent human-to-human transmission rate per unit time, the relative transmissibility of asymptomatic and hospitalized classes, the rate of progression from exposed class E to symptomatic I or asymptomatic infectious class A, the proportion of symptomatic infections, the hospitalization rate of symptomatic individuals, the recovery rate without being hospitalized, and the recovery rate of hospitalized patients, respectively.
- 2. Stochastic simulation methods
- We used the Gillespie algorithm to study random interactions occurring in the given system of equations. The stochastic simulation algorithm, suggested by Gillespie [11], is as follows:
- For a set of coupled ordinary differential equations
- we can construct an exact numerical realization of the process X(t):
Step 0: Initialize the time t = t0 and the system’s state X(t0) = X0.
Step 1: With the system in state X at time t, evaluate all the aj(X) and their sum
-
Step 2: Draw two random numbers r1 and r2 from the uniform distribution in the unit interval, and take
- j=the smallest integer satisfying
Step 3: Replace t ← t + τ and X ← X + cj.
Step 4: Record (X, t) as desired. Return to Step 1, or else end the simulation.
MATERIALS AND METHODS
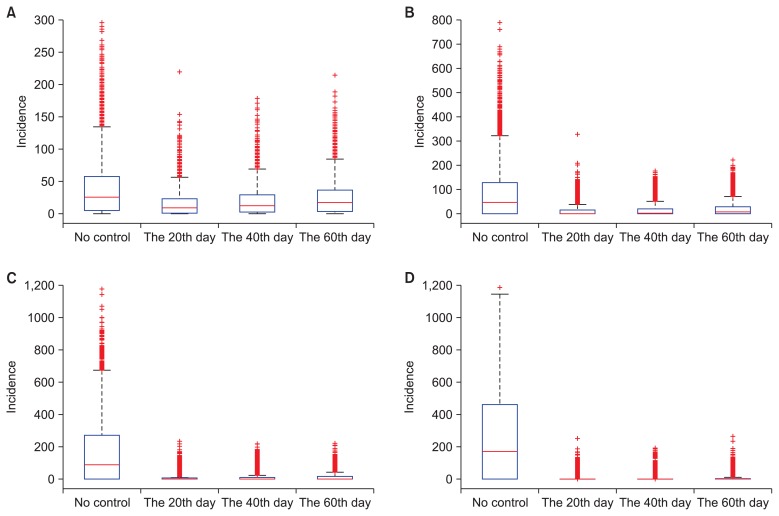
- For the 10,000 stochastic simulations, the SEIR model was computed by using the Gillespie algorithm with initial values S = 100,000; E = 10; I = A = H = R = 0 and the parameter values [10] β = 0.085, l1 = 0.2, l2 = 10, κ = 1/6.6, ρ = 0.585, γa = 0.6403, γI = 1/5, and γr = 1/7. The control measure was used by changing the value l2 from 10 to 8.5. Figure 1 depicts the box plots of incidences I (t) + A (t) + H (t) of the MERS-CoV depending on the time of the control intervention on the 20th, 40th, and 60th days after the identification of the index case.
- The box plots showed that there was a significant difference between the non-intervention and intervention groups (the 20th day, 40th day, and 60th day groups) and seemed to show no significant difference based on the time of intervention. However, the ANOVA in Table 1 revealed a significant difference between the averages in the intervention groups and showed that early intervention promotes a good strategy to control the disease. In particular, these results were evident from the average and standard deviation, which were smaller in the early intervention period. The difference was markedly larger 100 days after the identification of the index case, and the difference in the effect of the intervention over time showed a decreasing trend.
RESULTS
- The control intervention was conducted during the MERS-CoV outbreak in Korea immediately after the confirmation of the index case and the control measures were carried out on the 20th day after the confirmation of the index case. Using the stochastic simulations of the SEIR model depending on the time of control interventions on the 20th, 40th, and 60th days after the confirmation of the index case, this study investigated whether early risk communication with the general public and mass media is an effective preventive strategy. As a result, the intervention on the 20th day after the identification of the index case was much better than the intervention on the 60th day. Therefore, we conclude that appropriate risk communication can secure the confidence of the general public in the public health authorities.
DISCUSSION
-
Acknowledgements
- This study was carried out with the support of the Research Program of Rural Development Administration, Republic of Korea (Project No. PJ011563).
ACKNOWLEDGMENTS
-
CONFLICTS OF INTEREST
No potential conflict of interest relevant to this article was reported.
Article information
- 1. Hsieh YH. 2015 Middle East respiratory syndrome coronavirus (MERS-CoV) nosocomial outbreak in South Korea: insights from modeling. PeerJ 2015;3:e1505https://doi.org/10.7717/peerj.1505. PMID: 10.7717/peerj.1505. PMID: 26713252.ArticlePubMedPMC
- 2. Kim Y, Lee S, Chu C, et al. The characteristics of Middle Eastern respiratory syndrome coronavirus transmission dynamics in South Korea. Osong Public Health Res Perspect 2016;7:49−55. https://doi.org/10.1016/j.phrp.2016.01.001. PMID: 10.1016/j.phrp.2016.01.001. PMID: 26981343.ArticlePubMedPMC
- 3. Lee J, Chowell G, Jung E. A dynamic compartmental model for the Middle East respiratory syndrome outbreak in the Republic of Korea: A retrospective analysis on control interventions and superspreading events. J Theor Biol 2016;408:118−26. https://doi.org/10.1016/j.jtbi.2016.08.009. PMID: 10.1016/j.jtbi.2016.08.009. PMID: 27521523.ArticlePubMedPMC
- 4. Mizumoto K, Saitoh M, Chowell G, et al. Estimating the risk of Middle East respiratory syndrome (MERS) death during the course of the outbreak in the Republic of Korea, 2015. Int J Infect Dis 2015;39:7−9. https://doi.org/10.1016/j.ijid.2015.08.005. PMID: 10.1016/j.ijid.2015.08.005. PMID: 26275845.ArticlePubMedPMC
- 5. Park HY, Lee EJ, Ryu YW, et al. Epidemiological investigation of MERS-CoV spread in a single hospital in South Korea, May to June 2015. Euro Surveill 2015;20:1−6. https://doi.org/10.2807/1560-7917.ES2015.20.25.21169. PMID: 10.2807/1560-7917.ES2015.20.25.21169. PMID: 26132766.ArticlePubMed
- 6. Stone L, Shulgin B, Agur Z. Theoretical examination of the pulse vaccination policy in the SIR epidemic model. Math Comput Model 2000;31:207−15. https://doi.org/10.1016/S0895-7177(00)00040-6. PMID: 10.1016/S0895-7177(00)00040-6.Article
- 7. Virlogeux V, Fang VJ, Park M, et al. Comparison of incubation period distribution of human infections with MERS-CoV in South Korea and Saudi Arabia. Sci Rep 2016;6:35839https://doi.org/10.1038/srep35839. PMID: 10.1038/srep35839. PMID: 27775012.ArticlePubMedPMC
- 8. Virlogeux V, Park M, Wu JT, et al. Association between severity of MERS-CoV infection and incubation period. Emerg Infect Dis 2016;22:526−8. https://doi.org/10.3201/eid2203.151437. PMID: 10.3201/eid2203.151437. PMID: 26890291.ArticlePubMedPMC
- 9. Xia ZQ, Zhang J, Xue YK, et al. Modeling the transmission of Middle East respirator syndrome corona virus in the Republic of Korea. PLoS One 2015;10:e0144778https://doi.org/10.1371/journal.pone.0144778. PMID: 10.1371/journal.pone.0144778. PMID: 26690750.ArticlePubMedPMC
- 10. Lee DH, Masud MA, Kim BN, et al. Optimal control analysis for the MERS-CoV outbreak: South Korea perspectives. J KSIAM 2017;21:143−54.
- 11. Gillespie DT. Exact stochastic simulation of coupled chemical reactions. J Phys Chem 1977;81:2340−61. https://doi.org/10.1021/j100540a008. PMID: 10.1021/j100540a008.Article
REFERENCES
| Variable | Data | ANOVA (F-value)a |
|---|---|---|
| The 100th day | 231.72 | |
| No control | 23.0017 ± 30.1585 | |
|
|
||
| The 20th day control | 9.4533 ± 14.3353 | |
|
|
||
| The 40th day control | 11.4083 ± 16.0851 | |
|
|
||
| The 60th day control | 14.5683 ± 19.9566 | |
|
|
||
| The 200th day | 108.49 | |
|
|
||
| No control | 52.6752 ± 82.3164 | |
|
|
||
| The 20th day control | 7.3237 ± 16.8129 | |
|
|
||
| The 40th day control | 8.6575 ± 18.1072 | |
|
|
||
| The 60th day control | 11.2189 ± 21.7501 | |
|
|
||
| The 300th day | 66.99 | |
|
|
||
| No control | 106.4571 ± 164.5254 | |
|
|
||
| The 20th day control | 5.5167 ± 16.7547 | |
|
|
||
| The 40th day control | 6.3517 ± 17.2051 | |
|
|
||
| The 60th day control | 8.4170 ± 20.5291 | |
|
|
||
| The 400th day | 38.18 | |
|
|
||
| No control | 172.5906 ± 241.5982 | |
|
|
||
| The 20th day control | 3.9101 ± 14.7193 | |
|
|
||
| The 40th day control | 4.4760 ± 15.3066 | |
|
|
||
| The 60th day control | 5.8240 ± 17.5711 | |
Figure & Data
References
Citations
- Healthcare-associated infections: the hallmark of Middle East respiratory syndrome coronavirus with review of the literature
J.A. Al-Tawfiq, P.G. Auwaerter
Journal of Hospital Infection.2019; 101(1): 20. CrossRef
 PubReader
 Cite
Cite
