
Articles
- Page Path
- HOME > Osong Public Health Res Perspect > Volume 7(6); 2016 > Article
-
Original Article
Prevalence and Risk Factors of Chronic Obstructive Pulmonary Disease among Nonsmokers: Fifth Korea National Health and Nutrition Examination Survey (2010–2012) - Heeyoung Oh, Ye-Eun Lee
-
Osong Public Health and Research Perspectives 2016;7(6):385-393.
DOI: https://doi.org/10.1016/j.phrp.2016.11.006
Published online: November 16, 2016
College of Nursing, Eulji University, Daejeon, Korea
- ∗Corresponding author. hoh123@eulji.ac.kr
• Received: August 31, 2016 • Accepted: November 10, 2016
Copyright © 2016 Korea Centers for Disease Control and Prevention. Published by Elsevier Korea LLC.
This is an open access article under the CC BY-NC-ND license (http://creativecommons.org/licenses/by-nc-nd/4.0/).
Abstract
-
Objectives
- The purpose of this study was to determine the prevalence of COPD among non-smoking adults, and to investigate the risk factors that affect disease occurrence.
-
Methods
- The data from the 5th Korea national health and nutrition examination survey (KNHNES) has been used, and 5,489 non-smoking adults aged between 40 to 79 years with diagnosable FEV1/FVC were selected therefrom as the subjects of this study.
-
Results
- The prevalence of COPD in non-smokers was observed to be 6.9%. The development of the COPD showed statistically significant difference among groups; males showed about 2.54 times (95% CI: 1.410∼146.612) higher rates compared to females, subjects aged 70–79 showed about 3.08 times (95% CI: 1.823∼11.437) higher rates compared to those aged 40–49, subjects whose education level was elementary school or less showed about 5.36 times (95% CI: 1.341∼21.393) higher rates compared to those who are college or more, and subjects who are middle school showed about 4.72 times (95% CI: 1.374∼16.217) higher rates compared to the college or more.
-
Conclusion
- It is confirmed that development of the COPD in non-smokers reach significance. For the prevention of the disease, there is a need to identify COPD-related risk factors in males and the elderly and provide appropriate nursing intervention, and to develop health-related education programs for those with low educational background to take in order to promote the improvement of lung health.
- 1.1 Background
- Chronic obstructive pulmonary disease (COPD) is a common respiratory disease in adults, and is diagnosed on the basis of a forced expiratory volume in 1 second of < 0.07 (FEV1/FVC < 0.07) in the pulmonary function test (PFT). COPD is characterized by dyspnea due to limited airflow. According to the Statistics Korea, COPD is the fourth leading cause of death among the elderly (age ≥ 65 years) in South Korea [1], and is likely to become the third leading cause of death in the world by 2020 [2]. Advanced COPD is associated with severe dyspnea accompanied by coughing, sputum, and fatigue, as well as cardiovascular complications such as cardiac insufficiency, which require constant oxygen supply and limit daily activities, ultimately resulting in depression or decreased quality of life 3, 4, 5.
- The main risk factor for COPD is smoking, with a long smoking period leading to a proportionately high prevalence 6, 7, 8. However, the occurrence of COPD has recently increased among nonsmokers who have never smoked in their lives [9]. There are approximately 50 million nonsmoking COPD patients worldwide [6], and recent reports have revealed that the prevalence of COPD among nonsmoking South Koreans is 7.1–8.2% 10, 11.
- Even though there are many COPD patients among nonsmokers, the main cause of the disease has not been yet defined. Some of the pathophysiologic changes, personal, and environmental risk factors relate to air flow restriction have been addressed in previous studies.
- Exposure to cigarette smoke from secondhand smoking can affect the bronchus and limit airflow [11]. The risks of respiratory infection also vary depending on the rate of practicing health-related activities or the level of occupational exposure to hazardous substances 10, 12. A decreased level of immunity or pulmonary compliance due to increased age may also lead to increased risk of respiratory infections or deterioration of respiratory function [13]. Educational and financial status affect acquisition of health-related knowledge and information, as well as access to health services and nutritional intake; hence, these factors may also affect the occurrence of pulmonary infection for those living in an environment exposed to exhaust gas 2, 14, 15, 16, 17. Dust 18, 19, coal, and heavy metals such as cadmium, aluminum, mercury, and lead 20, 21 may cause airflow restriction [22]. Poor nutritional intake and stress affect energy balance and deteriorate immunity, thereby reducing muscle strength and causing dyspnea 16, 22, 23. Differences in physical activities lead to changes in respiratory muscle strength, intramuscular protein, and weight, and may cause dyspnea in daily life as well [24]. Anemia increases muscle fatigue due to oxygen deficiency in the blood, and causes difficulties in physical activities and dyspnea [25]. A medical history of lung disease 26, 27 or pulmonary tuberculosis may impact airflow and cause airway inflammation or pulmonary fibrosis, thus resulting in airway changes [8].
- According to The Korea Environment Corporation, unfortunately, the concentration of fine dust (PM10) in South Korea has recently reached a daily average of up to 99 μg/m3 [28], raising concerns regarding respiratory infections. South Korea is greatly affected by environmental influences from China, which is the largest emitter of air contaminants in northeast Asia. Despite the severity of air pollution or the increase in the number of nonsmoking COPD patients, not many studies have been conducted to investigate factors that play a major role in the occurrence of the disease among nonsmokers. A few previous studies identified the factors associated with COPD among nonsmoking adults as sex, age, socioeconomic status and educational background, occupational exposure to dust, body mass index (BMI), and history of pulmonary tuberculosis or asthma 9, 12, 29, 30. However, conclusions cannot be made based on just a few studies.
- The Korea National Health and Nutrition Examination Survey (KNHANES) includes pulmonary function test and the variables related to respiratory problem. It provides data that are representative of the population since the sample size is large. Therefore, the present study used data from the fifth KNHANES from 2010–2012, to determine the prevalence and to identify the risk factors of COPD among nonsmoking adults. Ultimately, this study is expected to contribute to efforts for prevention of COPD for nonsmoking adults, which should in turn improve their quality of life by preventing physical, social, and financial loss.
- 1.2 Objective
- The objective of this study was to determine the prevalence of COPD among nonsmoking adults aged 40–79 years, and to investigate the risk factors that affect disease occurrence.
Introduction
- 2.1 Research design
- Descriptive and cross-sectional study design was used for secondary data analysis.
- 2.2 Participants
- The study included 40–79-year-old participants of the fifth KNHANES from 2010 to 2012, who underwent PFT, and who were self-reported “never smokers”. Participants with no FEV1/FVC results, those who smoked fewer than five packs of cigarettes in their lifetime, and those who did not respond to smoking survey questions were excluded from the analysis (Figure 1).
- 2.3 Data collection procedures
- The data used in this study were downloaded from the website of the Korea Centers for Disease Control and Prevention (KCDCP; http://knhanes.cdc.go.kr). According to the report by the KCDCP, the fifth KNHANES (2010–2012) is a health and nutrition survey conducted nationwide from a sample of 192 districts, and extracted every year from all household members aged ≥ 1 year in 3,840 households. Within the districts, 20 sample households were selected. Excluded were facilities such as nursing homes for the elderly, military and prison installations, and foreigners. All household members aged ≥ 1 year older within the sample households were selected as survey participants [5].
- Data were collected by technical researchers consisting of nurses and health science personnel who had completed 2–4 weeks of education and training. In particular, to minimize cases of unclear PFT results, the researchers were regularly trained twice a year and retrained as needed. PFT was conducted without administering bronchodilator, on participants aged 40–79 years only. The health survey was conducted in the form of an interview and a self-administered questionnaire. The blood test was performed on 2,400 participants aged ≥ 10 years [7].
- 2.4 Ethical considerations
- For the use of the fifth KNHANES raw data, approval was obtained by the Institutional Review Board of the Korea Centers for Disease Control and Prevention (Year 1: 2010-02CON-21-C, Year 2: 2011-02CON-06-C, Year 3: 1201-01EXP-01-2C) [10]. The data were disclosed to the public, and none of personally information of participants were identifiable. In addition, this study was approved by the Institutional Review Board of Eulji University (EUIRB2016-23).
- 2.5 Research variables
- Independent variables include the general characteristics of sex, age, education, income, longest held job in life, and residence. Also, health and environment related variables were BMI, stress, passive smoking at work, passive smoking at home, moderate physical activities, anemia, lead, cadmium, history of pulmonary tuberculosis, and time elapsed after the first diagnosis of pulmonary tuberculosis. The dependent variable is COPD (FEV1/FVC < 0.07 in PFT). Table 1 shows the list of explanatory variables.
- 2.6 Data analysis method
- Data were analyzed using IBM SPSS Statistics 22.0 (Windows/MAC; SPSS, Inc., Chicago, IL, USA, an IBM Company). Considering that the raw data of KNHANES is a complex sample design, weighted values were used for analysis. The prevalence was analyzed with descriptive statistics using frequency, percentage, and standard errors. The difference of the prevalence by general, health behaviors, and disease-related characteristics were analyzed with χ2 test and independent samples t test. Risk factors of COPD among nonsmoking adults were analyzed with logistic regression analysis.
Materials and methods
- 3.1 Prevalence of COPD among nonsmoking adults
- The annual trend shows that the COPD prevalence was 6.2% in 2010, 6.4% in 2011, and 8.0% in 2012. Among 5,489 adults aged 40–79 years who participated in this study, 6.9% on average (n = 388) were found to have COPD. Table 2 shows the prevalence of COPD among Korean nonsmoking adults.
- 3.2 Comparison of prevalence of COPD by general characteristics among nonsmoking adults
- The prevalence of COPD in men was 2.183 times higher than that in women [95% confidence interval (CI): 1.562–3.051]. According to age, the prevalence was 1.738 times higher among patients who were age 50–59 years (95% CI: 1.037–2.912), 6.173 times higher among ages 60–69 years (95% CI: 3.589–10.617), and 7.734 times higher among ages 70–79 years (95% CI: 1.596–13.013) compared to ages 40–49 years. With respect to education, the prevalence was 2.215 higher for those who attended elementary school or lower compared to those who completed college or higher (95% CI: 11.320–3.717). On the basis of longest held job in life, the prevalence was 1.664 times higher for those working in agriculture, forestry, and fishery/simple labor/military than those working in technical posts/mechanical handling and assembly (95% CI: 1.047–2.581). The differences of those cases were statistically significant. The prevalence according to income or residence did not differ by groups and were not statistically significant. Table 3 shows the prevalence of COPD and risk factors according to the general characteristics of nonsmoking adults.
- 3.3 Comparison of prevalence of COPD by health and environment related characteristics among Korean nonsmoking adults
- The prevalence of COPD was 0.568 times lower among those who experienced a high level of stress (95% CI: 0.388–0.833), and 0.530 times lower among those who experienced a moderate level of stress (95% CI: 0.371–0.757), compared to those who felt almost no stress, and the differences were statistically significant. The difference in prevalence according to BMI, passive smoking at work and home, and moderate physical activities, was not statistically significant. The average blood lead level of COPD among nonsmoking adults was 2.52 ± 1.11 μg/dL. As the level of lead increased by 1 μg/dL, the prevalence became 1.334 times higher (95% CI: 1.057–1.683), and the difference was statistically significant.
- The prevalence according to the time elapsed after the first diagnosis of pulmonary tuberculosis became 1.043 times higher (95% CI: 1.009–1.089) as the time elapsed increased by one year (95% CI: 1.009–1.089), and the difference was statistically significant. The difference in prevalence relative to anemia, history of pulmonary tuberculosis, or blood cadmium level was not statistically significant. Table 3 shows the prevalence of COPD according to characteristics related to general, health, and environment of nonsmoking adults.
- 3.4 Risk factors of COPD among nonsmoking adults
- This study considered sex, age, education, longest held job in life, stress, lead levels in blood, and time elapsed after the first diagnosis of pulmonary tuberculosis as independent variables for the multivariate logistic regression analysis. Table 4 shows the risk factors of COPD for nonsmoking adults.
- In Model 1, the influence of stress was not statistically significant. As for blood lead levels, the risk of COPD occurrence became 1.336 times higher (95% CI: 1.056–1.690) as the lead levels increased by 1 μg/dL, and the difference was statistically significant.
- Model 2 examined the influence of sex, age, education, longest held job in life, stress, and lead levels in blood, which turned out to be significant in the univariate logistic regression analysis. The risk of COPD occurrence was 2.539 times higher in men than in women (95% CI: 1.410–146.612); 3.076 times higher among patients aged 70–79 years than among those aged 40–49 years (95% CI: 1.823–11.437); 5.356 times higher for participants who graduated from elementary school or lower (95% CI: 1.341–21.393), and 4.720 times higher for those who graduated from middle school (95% CI: 1.374–16.217) than for those who graduated from college or higher; in all cases the difference was statistically significant.
- Model 3 examined time elapsed after the first diagnosis of pulmonary tuberculosis as a potential risk factor for COPD. Limited number of participants with the history of pulmonary tuberculosis (n = 238) could be included in the analysis. The results of the analysis showed that the risk of COPD occurrence was higher in men than in women (cross ratio 8.894, 95% CI: 1.523–151.250), in old age (cross ratio 1.054, 95% CI: 1.017–1.202), and with more time elapsed after the first diagnosis of pulmonary tuberculosis (cross ratio 1.064, 95% CI: 1.000–1.133). The difference was statistically significant.
Results
- 4.1 Prevalence of COPD
- Results showed that in 3 years, the average prevalence of COPD for nonsmoking adults aged 40–79 years was considerably high at 6.9%, and constantly increased from 6.2% to 8.0% in 3 years. The increase in COPD prevalence is similar to findings from the fourth KNHANES (2007–2009) and indicated that the average prevalence in these 3 years was 7.6% [10]. It has been reported that the prevalence of COPD among nonsmoking adults aged ≥ 40 years in China is 5.2% [12], which is slightly lower than the rate in South Korea. One factor to consider is that the PFT performed by KNHANES is a large-scale screening test that was performed in the community without the bronchodilator that is routinely administered in diagnostic tests; this may have influenced the incidence rate [7].
- 4.2 COPD risk factors for nonsmoking adults
- In Model 1, stress was included because it is a cause of various chronic diseases, and is known to cause illnesses by decreasing immunity 23, 31, 32, 33. Compared to patients who experienced almost no stress, those who experienced excessive or little stress showed 0.57 times and 0.67 times lower prevalence, respectively. This finding is different from that of previous studies; nonetheless, the influence of stress may be limited, as no statistical significance was found in the multivariate analysis.
- Model 2 shows that the prevalence is approximately 2.54 times higher in men than in women. A study that analyzed 2007–2009 KNHANES data also showed a 4.2-times higher incidence rate in men than in women [10], and a study on Chinese nonsmoking adults showed that the rate was 1.97 times higher in men [11]. Men could be at higher risk due to a lower level of health-related information or a lower rate of practicing health-related behavior than women [10], and are more occupationally and environmentally exposed to hazardous substances [12].
- The prevalence of COPD increased with age, consistent with findings from previous studies 6, 10, 12, 34. With aging, the effect of intra-airway ciliary movement and cough reflex decreases and sputum is not discharged efficiently, thereby increasing the risk of respiratory infections. Moreover, elasticity of lung tissues is damaged, which decreases inhalation and expiratory flow volume while increasing residual air and expiratory reserve volume, consequently reducing airflow and causing ventilation–perfusion mismatch [13]. This indicates that the elderly are at high risk for COPD.
- The occurrence rate was about 2.22 times higher in less educated participants when compared to the counterpart. For nonsmoking Chinese people, it was also found that those who had < 10 years of education had a 1.97 times higher rate compared to those who had ≥ 10 years of education [35]. A low education may indicate relatively low socioeconomic status and poor nutrition [15], thereby resulting in low quality of health, decreased immunity, and a high risk of succumbing to pulmonary infection.
- Finally, Model 3 used a limited number of participants, including those diagnosed with pulmonary tuberculosis (n = 238). The prevalence among this group increased to approximately 1.06-fold as elapsed time after the first diagnosis of pulmonary tuberculosis increased by 1 year. Pulmonary tuberculosis disturbs airflow and causes airway inflammation, leading to rapidly progressing respiratory obstruction [8]. It has also been reported that if one was diagnosed with pulmonary tuberculosis at an earlier age, the occurrence rate and severity of COPD were also higher [36]. Recently, the occurrence rate of pulmonary tuberculosis in Korea has been reported to be the highest in the Organization for Economic Cooperation and Development countries [37]. In a study conducted in Korean nonsmokers, the prevalence of COPD among individuals with a medical history of tuberculosis was 4.5 times higher than that among individuals without such a history [10]. A study on nonsmokers aged ≥ 40 years in 14 countries also showed that both men and women with a medical history of tuberculosis showed 1.5–1.7 times higher prevalence [29], although additional replication studies are required to verify these findings.
- The difference of prevalence compared by the occupation did not reach the level of significance in the multivariate logistic regression analysis, but it was high among those working in agriculture, forestry, and fishery/simple labor/military in the univariate analysis. Previous studies on South Koreans showed that simple laborers including those in the construction or mining industry had a 2.6 times higher prevalence than managers, experts, office workers, service providers, or sales employees [10]. For US citizens, construction laborers and delivery personnel showed 3.4 times and 2.9 times higher prevalence, respectively, compared to office workers [38]. These results are in line with the findings of a Swedish study in which it was found that exposure to gas, dust, or smoke at work influence the occurrence rate of COPD [39].
- As such, there are various risk factors for COPD in nonsmoking adults, and the results of this study may help in facilitating efforts to reduce COPD by guiding the control of risk factors for the disease. This study will also be used as basic data to resolve issues related to COPD.
- 4.3 Limitations
- This study has a number of limitations. First, PFT conducted by KNHANES did not use a bronchodilator and is, therefore, different from the COPD diagnosis criteria routinely followed in clinical practice. Second, PFT conducted by KNHANES limited the participants to those aged 40–79 years, thereby excluding those aged ≥ 80 years. Third, Model 3 includes patients who were diagnosed with pulmonary tuberculosis among all participants, thereby limiting the number of participants. Fourth, the classification of occupational clusters in the source data used in this study was limited in analyzing the harm from occupation and/or the environment.
Discussion
- In conclusion, there is a considerable rate of COPD occurrence among nonsmokers. The risk factors for COPD among nonsmoking adults were: (1) old men with a low education; (2) patients for whom a long time had elapsed following the first diagnosis of pulmonary tuberculosis; and (3) patients who had been highly exposed to lead. Therefore, the findings of this study support the following proposal with respect to prevention of COPD in the future. First, it is necessary to inform never smokers about the risk factors associated with COPD occurrence, and to emphasize the need for preventing respiratory infections. Second, individuals with a medical history of tuberculosis should be required to regularly undergo PFT to prevent deterioration of pulmonary functions and to thoroughly track and observe their conditions. Third, the laborers in the construction or mining industry should be aware of the fact that they may be diagnosed with COPD even if they do not smoke, and also that they must wear protective gear to block out dust; they must also be informed about the characteristics and risks associated with their work environment. Considering that the concentration of fine particulate matter in air is high in South Korea, and given that lead is also detected in old cooking utensils, it is necessary to avoid venturing outdoors on days with especially high levels of fine particulate matter and yellow dust in the air. Otherwise, people must be encouraged to wear a mask when outdoors to protect themselves against yellow dust. Old cooking utensils must also be replaced to prevent accumulation of lead in the lungs. Fourth, a follow-on replication study is suggested on nonsmokers diagnosed in PFT after using a bronchodilator as in clinical setting. Finally, future research should include PFT on the elderly (aged ≥ 80 years), who were excluded from this study, and occupational clusters in the source data need be classified according to exposure to harmful substances.
Conclusions and suggestions
- All authors have no conflicts of interest to declare.
Conflicts of interest
- 1. http://kostat.go.kr.
- 2. Murray C.J., Lopez A.D.. Alternative projections of mortality and disability by cause 1990–2020: Global Burden of Disease Study. Lancet 349(9064). 1997 May;1498−1504. PMID: 9167458.ArticlePubMed
- 3. Lee K.J., Shim J.J.. Early detection and early treatment of COPD. Korean J Med 77(4). 2009 Oct;415−421.
- 4. Rennard S., Decramer M., Calverley P.M.. Impact of COPD in North America and Europe in 2000: subjects' perspective of Confronting COPD International Survey. Eur Respir J 20(4). 2002;799−805. PMID: 12412667.ArticlePubMed
- 5. Bang S.Y.. Influencing factors on fatigue in patients with chronic obstructive pulmonary disease. J Korean Acad Nurs 37(6). 2007 Oct;855−862.Article
- 6. Yin P., Jiang C.Q., Cheng K.K.. Passive smoking exposure and risk of COPD among adults in China: the Guangzhou Biobank Cohort Study. Lancet 370(9589). 2007 Sep;751−757. PMID: 17765524.ArticlePubMed
- 7. Jeon C.M., Oh K.O.. Prevalence of Chronic Obstructive Pulmonary Disease among Adults over 40 years old in Korea, 2009-2013. Public health weekly report, KCDC 8(15). 2015 April;334−336.
- 8. www.lungkorea.org.
- 9. Salvi S.S., Barnes P.J.. Chronic obstructive pulmonary disease in nonsmokers. Lancet 374(9691). 2009 Aug-Sep;733−743. PMID: 19716966.ArticlePubMed
- 10. Lee S.J., Kim S.W., Kong K.A.. Risk factors for chronic obstructive pulmonary disease among never-smokers in Korea. Int J COPD 10:2015 Mar;497−506.Article
- 11. Lee S.H., Hwang E.D., Lim J.E.. The risk factors and characteristics of COPD among nonsmokers in Korea: an analysis of KNHANES IV and V. Lung 194(3). 2016 Apr;353−361. PMID: 27038474.ArticlePubMed
- 12. Zhou Y., Wang C., Yao W.. COPD in Chinese nonsmokers. Eur Respir J 33(3). 2009 Mar;509−518. PMID: 19251797.ArticlePubMed
- 13. Park M.H., Kim A.R., Kim J.S.. Gerontological nursing. 2013. Jung Dam Media; Seoul (Korea).
- 14. Han M.K., Postma D., David M.. Gender and chronic obstructive pulmonary disease. Am J Respir Crit Care Med 176(12). 2007 Dec;1179−1184. PMID: 17673696.ArticlePubMed
- 15. Cho K.H., Nam C.M., Lee E.J.. Effects of individual and neighborhood socioeconomic status on the risk of all-cause mortality in chronic obstructive pulmonary disease: a nationwide population-based cohort study, 2002–2013. Respir Med 114:2015 May;9−17.Article
- 16. Yoon H.I., Park Y.M., Choue R.W.. Correlation between caloric intake and lung function parameters in patients with chronic obstructive pulmonary disease. Tuberc Respir Dis 65(5). 2008 Nov;385−389.Article
- 17. Eisner M.D., Anthonisen N., Coultas D.. An official American Thoracic Society public policy statement: novel risk factors and the global burden of chronic obstructive pulmonary disease. Am J Respir Crit Care Med 182(5). 2010 Sep;693−718. PMID: 20802169.ArticlePubMed
- 18. Diaz-Guzman E., Aryal S., Mannino D.M.. Occupational chronic obstructive pulmonary disease: an update. Clin Chest Med 33(4). 2012 Dec;625−636. PMID: 23153605.ArticlePubMed
- 19. Berry C.E., Wise R.A.. Mortality in COPD: causes, risk factors, and prevention. Int J Chron Obstruct Pulmon Dis 7(5). 2010 Sep;375−382.Article
- 20. Menezes A.M., Peres-Padilla R., Jardim J.R.. Chronic obstructive pulmonary disease in five Latin American cities (the PLATINO study): a prevalence study. Lancet 366(9500). 2005 Nov–Dec;1875−1881. PMID: 16310554.ArticlePubMed
- 21. Chung H.K., Chang Y.S., Ahn C.W.. Effect of blood lead levels on airflow limitations in Korean adults: findings from the 5th KNHNES 2011. Environ Res J 136:2015 Jan;274−279.Article
- 22. Lancaster T., Stead L., Silagy C.. Effectiveness of interventions to help people stop smoking: findings from the Cochrane Library. Br Med J 321(7257). 2000 Aug;355−358. PMID: 10926597.Article
- 23. Rastogi S.K., Gupta B.N., Husain T.. Respiratory symptoms and ventilatory capacity in metal polishers. Hum Exp Toxicol 11(6). 1992 Nov;466−472. PMID: 1361134.ArticlePubMed
- 24. Kang K.J., Kim M.H., Hwang S.K.. Self-care, symptom experience, and health-related quality of life by COPD severity. J Korean Acad Adult Nurs 20(1). 2008 Feb;163−175.
- 25. Moon J.H., OK J.S., Ahn K.O.. The effect of 12 week exercise training on cardiopulmonary and muscular function in chronic obstructed pulmonary disease patients. Official J Korean Acad Kinesiol 15:2013;97−108.Article
- 26. Stern D.A., Morgan W.J., Wright A.L.. Poor airway function in early infancy and lung function by age 22 years: a non-selective longitudinal cohort study. Lancet 370(9589). 2007 Sep;758−764. PMID: 17765525.ArticlePubMed
- 27. Van den Berge M., Vonk J.M., Gosman M.. Clinical and inflammatory determinants of bronchial hyperresponsiveness in COPD. Eur Respir J 40(5). 2012;1098−1105. PMID: 22523354.ArticlePubMed
- 28. www.keco.or.kr.
- 29. Lamprecht B., McBurnie M.A., William M.. COPD in never smokers: results from the population-based burden of obstructive lung disease study. Chest 139(4). 2011 Apr;752−763. PMID: 20884729.ArticlePubMed
- 30. Ramadan M.B., Ibrahim I.E.. Prevalence characteristics of COPD in never smokers. Egypt J Chest Dis Tuberc 61:2012 Jul;59−65.Article
- 31. Lee H.S., Hwang H.S., Kim Y.A.. Effects of hand massage with aroma oil on stress responses and serum immunity of registered nurse during the night duty. J Korean Acad Soc Nurs Edu 13(2). 2007 Dec;169−171.
- 32. Heidar T., Ebrahim N., Jamshid K.. Oxidative stress in COPD patients, smokers, and non-smokers. Respir Care 57(12). 2012 Dec;2090−2094. PMID: 22710284.ArticlePubMed
- 33. Ballantyne C.M., Hoogeveen R.C., Bang H.. Lipoprotein-associated phospholipase A2, high-sensitivity C-reactive protein, and risk for incident coronary heart disease in middle-aged men and women in the Atherosclerosis Risk in Communities (ARIC) study. Circulation 109(7). 2004 Feb;837−842. PMID: 14757686.ArticlePubMed
- 34. Eisner M.D., Balmes J., Yelin E.H.. Directly measured secondhand smoke exposure and COPD health outcomes. BMC Pulm Med 6(12). 2006 Mar;1−11. PMID: 16412223.ArticlePubMed
- 35. Cotton M.M., Bucknall C.E., Dagg K.D.. Early discharge for patients with exacerbations of chronic obstructive pulmonary disease: a randomized controlled trial. Thorax 55:2000 Aug;902−906. PMID: 11050257.ArticlePubMed
- 36. Diaz-Guzman E., Mannino D.M.. Airway obstructive diseases in older adults: from detection to treatment. J Allergy Clin Immunol 126(4). 2010 Oct;702−709. PMID: 20920760.ArticlePubMed
- 37. http://stat.mohw.go.kr.
- 38. Hnizdo E., Sullivan P.A., Bang K.M.. Association between chronic obstructive pulmonary disease and employment by industry and occupation in the US population: a study of data from the Third National Health and Nutrition Examination Survey. Am J Epidemiol 156(8). 2002;738−746. PMID: 12370162.ArticlePubMed
- 39. Hagstad S., Backman H., Bjerg A.. Prevalence and risk factors of COPD among never-smokers in two areas of Sweden—occupational exposure to gas, dust or fumes is an important risk factor. Respir Med 109(11). 2015 Nov;1439−1445. PMID: 26440676.ArticlePubMed
References
Figure 1The selection process for the study participants. COPD = chronic obstructive pulmonary disease; FEV1/FVC = forced expiratory volume in 1 second; KNHAES = Korea National Health and Nutrition Examination Survey.
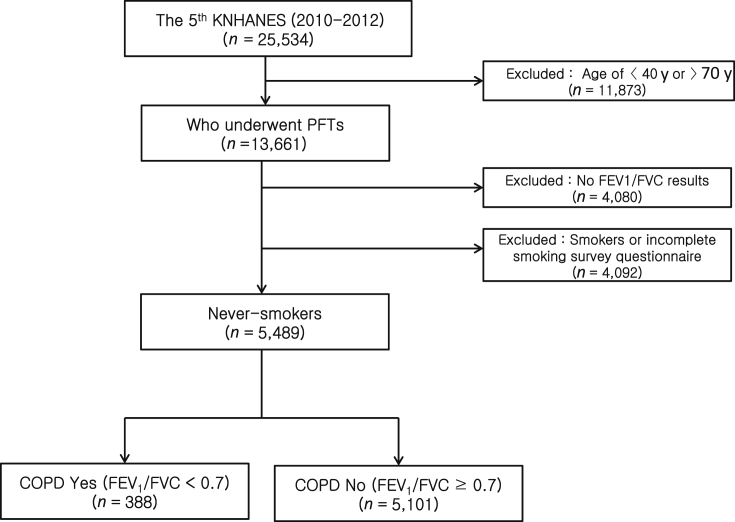
Table 1List of explanatory variables.
Table 2Prevalence of chronic obstructive pulmonary disease (COPD) among nonsmoking adults (n = 5,489).
Table 3Comparison of prevalence of chronic obstructive pulmonary disease (COPD) by general, health and environment related characteristics among nonsmoking adults. (n = 5,489).
Table 4Risk factors of chronic obstructive pulmonary disease (COPD) for nonsmoking adults (n = 1,567).
Figure & Data
References
Citations
Citations to this article as recorded by 
- Estimating the global prevalence of chronic obstructive pulmonary disease (COPD): a systematic review and meta-analysis
Nadia AL Wachami, Morad Guennouni, Younes Iderdar, Karima Boumendil, Maryem Arraji, Yassmine Mourajid, Fatima Zahra Bouchachi, Mohamed Barkaoui, Mohamed Lahbib Louerdi, Abderraouf Hilali, Mohamed Chahboune
BMC Public Health.2024;[Epub] CrossRef - Prevalence and Risk Factors of COPD: A Scoping Review From 2011 to 2021
Zhenggang Zhu, Ayu Suzailiana Muhamad, Norsuhana Omar, Foong Kiew Ooi, Xiaoyan Pan, Li Yin Ong Marilyn
Malaysian Journal of Medicine and Health Sciences.2023; 19(5): 345. CrossRef - STUDY OF PREVALENCE OF OBSTRUCTIVE LUNG DISEASE
Shilpa Anand Hakki
Journal of Evidence Based Medicine and Healthcare.2018; 5(35): 2580. CrossRef - What Affects Chronic Obstructive Pulmonary Disease in Korea?
Hae-Wol Cho, Chaeshin Chu
Osong Public Health and Research Perspectives.2016; 7(6): 339. CrossRef
 PubReader
 Cite
Cite
