
Articles
- Page Path
- HOME > Osong Public Health Res Perspect > Volume 6(2); 2015 > Article
-
Original Article
Application of Gap-Constraints Given Sequential Frequent Pattern Mining for Protein Function Prediction - Hyeon Ah Parka, Taewook Kimb, Meijing Lia, Ho Sun Shonc, Jeong Seok Parkd, Keun Ho Ryua
-
Osong Public Health and Research Perspectives 2015;6(2):112-120.
DOI: https://doi.org/10.1016/j.phrp.2015.01.006
Published online: February 24, 2015
aDatabase/Bioinformatics Laboratory, College of Electrical and Computer Engineering Chungbuk National University, Cheongju, Korea
bSyntekabio Incorporated, Korea Institute of Science and Technology, Seoul, Korea
cGraduate School of Health Science Business Convergence, Chungbuk National University, Cheongju, Korea
dMedical Informatics∙Engineering, Korea National University of Transportation, Cheongju, Korea
- ∗Corresponding author. khryu@dblab.chungbuk.ac.kr
© 2015 Published by Elsevier B.V. on behalf of Korea Centers for Disease Control and Prevention.
This is an Open Access article distributed under the terms of the CC-BY-NC License (http://creativecommons.org/licenses/by-nc/3.0).
- 2,363 Views
- 16 Download
- 4 Scopus
Abstract
-
Objectives
- Predicting protein function from the protein–protein interaction network is challenging due to its complexity and huge scale of protein interaction process along with inconsistent pattern. Previously proposed methods such as neighbor counting, network analysis, and graph pattern mining has predicted functions by calculating the rules and probability of patterns inside network. Although these methods have shown good prediction, difficulty still exists in searching several functions that are exceptional from simple rules and patterns as a result of not considering the inconsistent aspect of the interaction network.
-
Methods
- In this article, we propose a novel approach using the sequential pattern mining method with gap-constraints. To overcome the inconsistency problem, we suggest frequent functional patterns to include every possible functional sequence—including patterns for which search is limited by the structure of connection or level of neighborhood layer. We also constructed a tree-graph with the most crucial interaction information of the target protein, and generated candidate sets to assign by sequential pattern mining allowing gaps.
-
Results
- The parameters of pattern length, maximum gaps, and minimum support were given to find the best setting for the most accurate prediction. The highest accuracy rate was 0.972, which showed better results than the simple neighbor counting approach and link-based approach.
-
Conclusion
- The results comparison with other approaches has confirmed that the proposed approach could reach more function candidates that previous methods could not obtain.
- Defining functional characteristics of newly found protein or reassigning new functions to already-found protein has been receiving attention from scientists. Analyzing uncharacterized functions of proteins requires a sophisticated computational method, because it is impossible to manually annotate the large amount of constantly uploaded data as proteins tend to carry biological function in more than one aspect.
- Although the classic way of predicting a protein function is to find the homology between the sequence of annotated protein and unannotated proteins, the question of being sensitive enough for diverse sequences still remains. Some studies have inferred the function of a protein using its three-dimensional structure [1] using the similarity of fold, but most folds are associated with only a single function whereas proteins can have multiple functions, and thus could be confusing. Later, bioinformatics techniques to analyze biological process [2,3], clustering, and classification to categorize protein function from DNA data were introduced [4–6]. After the protein–protein interaction network, which shows the functional association between proteins, was introduced, it was often used for function prediction of proteins due to its rich information [7]. The methods to exploit the network have been developed in several different ways, including majority voting method [8], global optimization method [9], labeling and weight assign method [10,11], etc. The protein network can be exploited in various ways because it is packed with a vast amount of information and be easily combined with other information in the form of annotation and weight. Interacting proteins are composed of highly complex networks referred to as protein–protein interaction networks. This successfully captures the feature of the condition of protein relationships. Interacting proteins are likely to share the same functions to serve a common purpose, but predicting protein function solely on this feature has generally demonstrated limited accuracy and efficiency for several reasons. First, protein–protein interaction networks are typically structured on very complex connectivity, therefore making the prediction procedure more challenging if proteins have too many large numbers of neighbors [19]. Second, most proteins have multiple functions under different environmental conditions, which creates more difficulty in predicting the whole, complete set of functions that a single protein may carry [7]. Finally, functional inconsistency exists between interacting proteins.
- In the study of Schwikowski et al [8], which features the analysis of a large protein interaction network, function prediction relying on interacting proteins is proved to be “highly effective”. Although counting the frequency of function categories among neighbor proteins works well for prediction, because of the complexity of the relationship between proteins it has encouraged applying a more sophisticated way to bring better accuracy rates in predictions. One cannot simply tell that a protein will definitely possess a function that its neighbor has—it is a matter of probability, as it is affected by a tangled relationship of proteins with some exceptions. The study by Vazquez et al [9] takes the entire picture of the network to connect all possible impact factors proteins give to each other, to decide what function each will serve. Methods considering such extra influence within networks are also well shown in the study of Chatterjee et al [12], which uses the distance between proteins, for example, and Freschi et al [13], applying rank or weight, or inserting labels as in the study by Wang et al [11]. Although adding some extra factors can better reflect the protein interaction process, all of these comprise parts of all resources gleaned from the interaction network. Combining the strong characters of each local network of strongly related proteins and the global connection flow of all local networks, and additional information tagged into the network are essential as every factor derived from this interaction network are equally effective at guessing the function of protein. Applying graph mining and involving pattern mining can provide the answer to this problem [14,15]. Even when mining a whole network, both global aspects and local aspects of connection can be easily spotted as a large or small pattern, or as in a subpattern inside a larger pattern. Because the pattern mining approach can be easily “equipped” with several constraints and weight factors [16], it makes it possible to return any good sample of how each well-known functions of proteins can indicate the unknown function of their interaction neighbors. A study by Freschi [17] suggests topology analysis that takes overlapping neighbors into account, assigning different weight to different neighboring node patterns in the end. In the study by Cho and Zhang [18], such an approach is attempted to be improved by applying a more advanced pattern mining technique. During the labeled subgraph mining for functional pattern, a priori pruning is applied and triangular duplicated candidate patterns are eliminated. Still, the question of inconsistency remains because no prominent, single rule of patterns exists for one particular function [21].
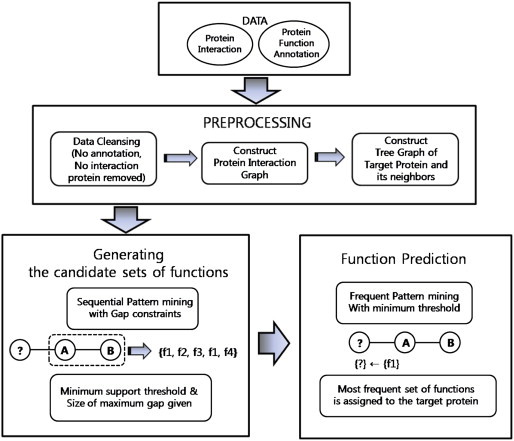
- In this paper, we propose a new approach of protein function prediction by graph pattern mining, which applies gap-constraints sequential pattern mining and frequent pattern mining together. In this way, we attempted to use all advantages that the protein interaction network can give–covering all local and global characters of protein relationship, summarizing the character into patterns, and the high possibility of accurate function assignment based on the frequency of functions appear in particular part within the network. We use three-, four-, and five-node functional patterns, discovering useful frequent patterns for function prediction. We permit a gap among the sets of function within a pattern to capture inconsistent but highly possible functional pattern. Our method proposed here consists of three main parts of different processes. The first is to construct the protein–protein interaction network from existing protein interaction data with annotation data. We figure out the possible functional patterns made from the neighbors of protein being the target of function prediction. At the second stage, candidate patterns for prediction are generated by applying the gap-constraint sequential pattern mining method. Finally, the third stage creates an output of function prediction by selecting the expected function of a protein, using frequent pattern mining. The experiment is conducted at this stage and the accuracy of prediction is calculated. Several different parameters are given during the experiment and results are compared to find the parameter set most effective on prediction. The workflow of our method is presented in Figure 1.
- This article is organized as follows. We first introduce the related works regarding protein function protein methods using the protein–protein network. We then present the detailed procedure of our method and explain the proposed algorithm for discovering functional patterns based on the gap-constraints sequential pattern mining method. After the explanation, we perform an experiment to verify the performance of our algorithm and evaluate the results, comparing with previous related studies. Finally, we summarize our work and discuss future studies.
Introduction
- 2.1 Preprocessing
- The preprocessing of the method consists of three stages. First, cleansing the raw data; second, constructing a graph representing the protein relationship with functions annotated; and third, generating candidate function sets for proteins in which their functions are revealed. 2.1.1
- Before we transform the protein–protein interaction (PPI) interaction network into a graph, as proteins become the nodes, the ones that show no protein–protein interaction are removed. Each protein is labeled with the set of corresponding functions. Functional categories used in this paper come from the MIPS Mammalian Protein–Protein Interaction Database (http://mips.helmholtz-muenchen.de/proj/ppi/). Another filtering process is done by removing proteins that do not appear in functional annotation reference. 2.1.2
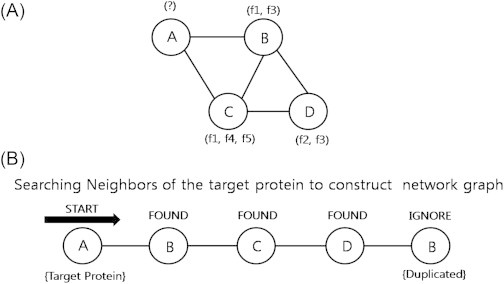
- Protein–protein interaction network can be represented as undirected, unweighted graph G(V,E). Here, V(v1 … vk) is a set of nodes denoting proteins, whereas the set of edges E(e1 … ek) denotes interactions between proteins. Sets of functional categories are assigned in the form of the label F(f1 … fk), as one protein can have multiple functions. Thus, we obtain a graph of protein interaction data including unannotated protein, ready to be used for extracting functional patterns (Figure 2). 2.1.3
- To figure out all possible patterns related to the target protein more efficiently, the patterns are summarized into a tree-structured graph (Figure 3). The target protein for function prediction becomes the root node of the tree. The tree is expended as the search for the next neighbors of target protein is continued and each newly found neighbors become the internal nodes of the tree. Notice these patterns are generated with the neighbors of unannotated proteins only. For example, the three-node pattern consists of three-node neighbors of a target protein but not the target protein itself.
- As we are determined to find the maximum five-node patterns related to the target protein, the maximum depth of the tree also becomes the five-node depth. Arranging the network-based graph data in such a way can save the time of scanning through the whole network. This helps to build highly related candidate functional patterns and simultaneously avoid likely irrelevant functions of the target proteins.
- Extracting patterns from this graph can also prevent generating redundant patterns created from nodes inside a closed walk cycle, which returns duplicated neighbors and patterns. Our algorithm excludes nodes which are detected to be already discovered during the process of building tree of target proteins network graph.
- 2.2 Generating the candidate set of functions
- When prediction is done by simply counting the numbers of frequent function categories appearing among the close neighbors of function-unknown protein, it returns a reliable prediction result of 80% accuracy. However, this also indicates that there still exists inconsistency in the relationship between shared functions and connection between proteins. The remaining unmatching results contain these exceptional cases, as different functions are triggered in a protein in a single state, in a pair or more neighbors, undirect neighbors, etc. To overcome such problems, which lower the rate of accuracy, gap allowance is given while generating a functional pattern closely associated with the target protein using the tree-formed network graph. The purpose of this gap is to allow the generation of more numbers of available functional patterns regarding those outside of the limited collection of functional patterns we are trying to search. These patterns can cover the ones in the protein–protein interaction network under an inconsistent condition. In other words, we obtain a much wider range of possibility of finding the functional set most suitable for the target protein.
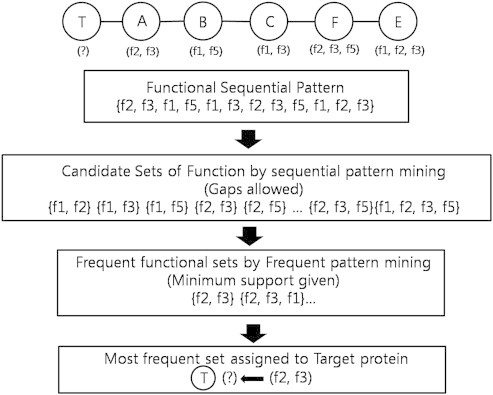
- For example, suppose that {f1-f2}-{f1-f3-f4}-{f1-f2-f3} is a three-node functional pattern of three different proteins, found in the tree-formed network graph of the neighbors of a target protein, this pattern is treated as a sequence – [f1, f2, f1, f3, f4, f1, f2, f3]. From this sequence, the functional patterns are mined and gaps are allowed, and the candidate patterns do not only include a subsequential pattern such as {f1, f2, f2} but also a sequence such as {f2, f3, f4} (Figure 4).
- To generate candidate patterns in such a manner, two different parameters are set to guide the amount of candidate sets. These are the minimum-support threshold and the size of the maximum gap (max-gap) allowed. The purpose of each parameter and the actual use is explained in detail in experiment section.
- 2.3 Function prediction
- Once candidate patterns are extracted after gap-constraint pattern mining, another frequent pattern mining is carried out for extracting the most frequent set of functions. The final sets derived from candidate sets eventually get assumed as the most possible functions that the target protein will possess.
- From the candidate pattern generated by applying gap-constraint pattern mining, we again apply another frequent pattern mining. The result of this process returns several sets of functions, each with a different length and seemingly random joins of function annotations, but all derived from the functions closely meeting with the target proteins.
- As explained previously, the most frequent set of functions mined from candidate set is assigned to the target proteins as its function.
Materials and methods
2.1.1 Data cleansing
2.1.2 Constructing protein network graph
2.1.3 Constructing a tree graph for a target protein
- 3.1 Experimental data
- We used Saccharomyces cerevisiae data from Database of Interacting Protein (DIP) and MIPS funCat catalog for our annotation for the experiment. The protein interaction data contains 1274 protein nodes and 3222 interactions. Seventeen functional categories were derived for our experiment. During the preprocessing, proteins without any interactions or the functions which are not contained in the selected functional annotations were removed. As a result, 1249 protein nodes and 2985 interactions remained for the experiment.
- 3.2 Effectiveness of function prediction by parameters
- We analyzed the results of our method in three different ways as we gave changes to three kinds of parameters–the length of nodes set during the pattern extraction from the tree graph, the minimum support threshold, and the max-gap allowed during the process of generating candidate patterns.
- By setting different aspects of parameters, we have tried to find the best condition of mining that returns the most accurate results. For the length of nodes, the longer the length, the more probable that prediction candidate patterns would be generated, but this means we will have many unwanted results requiring more space for matching and analyzing. Thus, it is important to know which length is just enough for the best result. If too short, we may miss some information. If too long, there will be too much waste of memory.
- As for different minimum supports, this is the same process done in any form of frequent pattern mining. By raising minimum support, we get the most frequent patterns only, which helps to ensure the association rule of a pattern, while in the process of predicting function prediction it is not recommended to discard all infrequent pattern. The reason is that it may contain rare functional patterns still valid for function prediction. Also, despite most frequent pattern mining process preferring to set very high minimum support, we tested various ranges of minimum supports.
- Different max-gaps are used as a similar way as we set the length of patterns. By allowing more gaps, we are able to get more reliable candidates of unexpected but important patterns, and also more unwanted patterns. 3.2.1
- To evaluate our approach, the predicted sets of functions were matched with the actual set of functions. After candidate patterns are generated by our pattern mining algorithm, function annotation is carried out. For the method evaluation we used the pattern from the graph created with DIP and MIPS data being annotated and selected several proteins to be predicted, to see if our method had indeed returned a set of predicted function of the actual annotation. Let Ai be the set of actual function of protein Vi and Pi be the set of predicted functions for Vi. When protein Vi is shown as being Pi⊆Ai, it is counted as an accurate prediction. The parameters were set by different lengths (3-, 4-, and 5-node) and support (minimum support = 50, minimum support = 100, minimum support = 150). We also applied different max-gaps to see the accuracy according to more varying conditions (max-gap = 3, max-gap = 5, and max-gap = 7).
- The accuracy was calculated for each different parameter set, and results analyzed in terms of searching for the best parameter set for prediction as previously mentioned. The most promising result was compared with other methods previously developed, using the same prediction accuracy measurement. 3.2.2
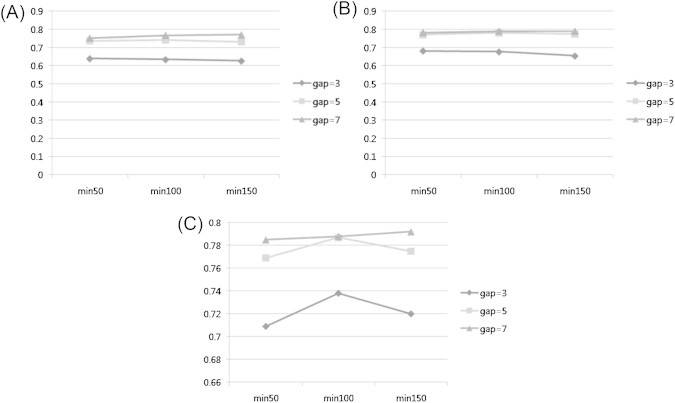
- By max-gap given 3, the rate of accuracy was clearly divided by the length of pattern. As the number of nodes increased the prediction became better. When max-gap is set to 5, the overall accuracy of three-node pattern was dropped while that of four-node pattern has surged, and five-node pattern remained at the same level. At the max-gap at 7, the result showed that accuracy gets much higher as minimum support rises (Figure 5).
- For most conditions, the five-node length of pattern returned the highest accuracy than any other number of nodes. It indicates that the prediction of function requires the involvement of great levels of neighbor proteins, and a complicated pattern with an increased number of neighbors contributes to the prediction process greatly (Figure 6).
- Accuracy tends to mount or stay steady when the support rises from 50 to 100 and drops at 150. However, in the condition where max-gap is given as 7, the three-node pattern accuracy shows a different result.
- The highest accuracy was obtained when max-gap is set as 7, minimum support at 150 in five-node pattern. Overall, the results show that the length of node affects the accuracy most greatly, but it is also seen that larger gap allowance pushes the accuracy even better. This shows the wider size of gap also increases the possibility to detect correct function of a protein by generating powerful candidate patterns.
- 3.3 Result comparison with previous nongraph mining approaches
- We compared our method with other previous methods which use a non-graph mining approach, including neighbor counting [8] and link based [21]. The aforementioned measurement of accuracy was used again to evaluate the results of each method, with the same dataset (Table 1). Although the accuracy rate of the neighbor counting method is 0.532 and link-based method is 0.762, our method proposed has shown 0.972 of accuracy. The best result of our prediction clearly shows how our method works better on the complexity and inconsistency of a protein interaction network. This result indicates that using the frequency of a functional category that appears among the neighbors of target protein should be counted regarding the pattern of connectivity between function, but should not be limited by the levels of layers or any sequence order at the same time. Rather, the results show that allowing a much looser structural rule of protein interaction network should be explored for better prediction.
Results
3.2.1 Parameter setting for function prediction experiment
3.2.2 Performance evaluation by different parameter setting
- In this article we presented a new approach to predict protein functions by applying two kinds of mining method on protein interaction network: pattern mining method with gap-constraints and another frequent pattern mining. Also, instead of using a whole regular graph of protein identification and its function annotation label, we attempted to use a tree-structured graph on one target protein when looking for its function. Within the tree graph we tried to extract possible variations of the frequent pattern as much as possible by allowing a certain length of gaps and length of the pattern itself. By this we gained the most possible function set to be annotated onto the target protein, although it might not have been directly connected to its neighbor or not appear as a pattern or rule in a regular order. We compared several outputs of our experiment controlled under various conditions, and searched for the most promising parameter set to get accurate prediction. The result comparison with other approaches has confirmed that the proposed approach could reach more function candidates that previous methods could not obtain.
- During the process of our application we have seen several progresses with the approach of using the graph mining method on the protein interaction network for function prediction. First, we suggested creating and using a tree-structured graph as the target protein at the root node. This has not only been useful in reducing redundant scanning of the whole network and duplicated count of functions, but also ensures that we can secure the most highly related functions of a target protein. Second, generating candidate function sets to assign as target proteins function with gap-constraint pattern mining has allowed us to find various candidates, including the ones that could appear with inconsistency within a certain area around the target protein. Applying frequent pattern mining after such candidate generations returned the result of what previous frequent graph pattern mining method could not find. In this way, we could secure more accuracy from prediction evaluation. These aspects can be especially useful when trying to learn about whether there are strong characteristics appearing among a protein network in terms of relationship between several of different functions and their combination. This strategy could easily apply to any type of protein interaction network regardless of its size, whether full network or partial.
- To guarantee more accuracy during protein function prediction, it is essential to understand the complexity of the interaction network and developing sophisticated prediction rules is required. It is clear that the limitation of prediction is triggered by the fact that the simple picture of connection between proteins with only close neighbors is not enough to represent the relationship of proteins and their functions. If more effective details can be found to add to our method, it will be a promising method to predict undiscovered functions of a protein. The future study will be conducted for more discoveries of important parameters and setting an experiment in another condition to adjust better to the complexity of the PPI network.
Discussion
- All the authors declare no conflicts of interest.
Conflicts of interest
-
Acknowledgements
- This research was supported by Basic Science Research Program through the National Research Foundation of Korea (NRF) funded by the Ministry of Science, ICT & Future Planning (No. 2013R1A2A2A01068923), Basic Science Research Program through the National Research Foundation of Korea (NRF) funded by the Ministry of Science, ICT & Future Planning (No-2013R1A1A206518) and Export Promotion Technology Development Program, Ministry of Agriculture, Food and Rural Affairs (No.114083-3).
Acknowledgments
-
This is an Open Access article distributed under the terms of the Creative Commons Attribution Non-Commercial License (http://creativecommons.org/licenses/by-nc/3.0) which permits unrestricted non-commercial use, distribution, and reproduction in any medium, provided the original work is properly cited.
Article information
- 1. Mészáros B., Tompa P., Simon I.. Molecular principles of the interactions of disordered proteins. J Mol Biol. 372(2). 2007 Sep;549−561. PMID: 17681540.ArticlePubMed
- 2. Lee H., Tu Z., Deng M.. Diffusion kernel-based logistic regression models for protein function prediction. OMICS 10(1). 2006 Spring;40−55. PMID: 16584317.ArticlePubMed
- 3. Pierri C.L., Parisi G., Porcelli V.. Computational approaches for protein function prediction: a combined strategy from multiple sequence alignment to molecular docking-based virtual screening. Biochim Biophys Acta 1804(9). 2010 Sep;1695−1712. PMID: 20433957.ArticlePubMed
- 4. Juan H.F., Huang H.C.. Bioinformatics: microarray data clustering and functional classification. Methods Mol Biol. 382:2007;405−416. PMID: 18220245.ArticlePubMed
- 5. Otero F.E., Freitas A.A., Johnson C.G.. A hierarchical multi-label classification ant colony algorithm for protein function prediction. Memetic Computing 2(3). 2010;165−181.Article
- 6. Yano K.. Improved prediction of protein interaction from microarray data using asymmetric correlation. Procedia Computer Science 4:2011;1072−1081.Article
- 7. Szklarczyk D., Franceschini A., Kuhn M.. The STRING database in 2011: functional inter-action networks of proteins, globally integrated and scored. Nucleic Acids Res. 39(Suppl. 1). 2011 Jan;D561−D568. PMID: 21045058.ArticlePubMed
- 8. Schwikowski B., Uetz P., Fields S.. A network of protein–protein interactions in yeast. Nat Biotechnol 18(12). 2000 Dec;1257−1261. PMID: 11101803.ArticlePubMed
- 9. Vazquez A., Flammini A., Maritan A.. Global protein function prediction from protein-protein interaction networks. Nat Biotechnol 21(6). 2003 Jun;697−700. PMID: 12740586.ArticlePubMed
- 10. Jiang J.Q., McQuay L.J.. Predicting protein function by multi-label correlated semi-supervised learning. IEEE/ACM Trans Comput Biol Bioinform 9(4). 2012 Jul/Aug;1059−1069. PMID: 22595236.ArticlePubMed
- 11. Wang H., Huang H., Ding C.. Function–function correlated multi-label protein function prediction over interaction networks. J Comput Biol. 20(4). 2013 Apr;322−343. PMID: 23560867.ArticlePubMed
- 12. Chatterjee T., Chatterjee P., Basu S.. Protein function by minimum distance classifier from protein interaction network. Communications, Devices and Intelligent Systems (CODIS), 2012 International Conference. 2012. IEEE.
- 13. Freschi V.. Graph-based semi-supervised algorithm for protein function prediction from interaction maps. In learning and intelligent optimization. 2009. Springer Berlin Heidelberg; pp 249−258.
- 14. Parthasarathy S., Tatikonda S., Ucar D.. A survey of graph mining techniques for biological datasets. In managing and mining graph data. 2010. Springer; US: pp 547−580.
- 15. Kiiciikural A., Szilagyi A., Sezerman O.U.. Protein homology analysis for function prediction with parallel sub graph isomorphism. Bioinformatics: concepts, methodologies, tools, and applications. 2013. p 386.
- 16. Hu L., Huang T., Shi X.. Predicting functions of proteins in mouse based on weighted protein-protein interaction network and protein hybrid properties. PLoS One 6(1). 2011 Jan;e14556PMID: 21283518.ArticlePubMed
- 17.
- 18. Cho Y.R., Zhang A.. Predicting protein function by frequent functional association pattern mining in protein interaction networks. IEEE Trans Inf Technol Biomed 14(1). 2010 Jan;30−36. PMID: 19726271.ArticlePubMed
- 19. Li X., Wu M., Kwoh C.K.. Computational approaches for detecting protein complexes from protein interaction networks: a survey. BMC Genomics 11(Suppl. 1). 2010 Feb;S3PMID: 20158874.Article
- 20. Lin C., Jiang D., Zhang A.. Prediction of protein function using common-neighbors in protein-protein interaction networks. BioInformatics and BioEngineering. Sixth IEEE Symposium 2006;251−260.
- 21. Kim T.. Predicting the protein function based on Gap-Constraints sequential pattern mining in protein-protein interaction network, master's thesis. 2013. Chungbuk National University; Korea: p 37.
References


| Approach | Description | Accuracy (%) |
|---|---|---|
| Neighbor counting [8] | Count most frequent function category appear among neighbor proteins and assign to the target protein | 0.532 |
| Link-based [20] | Use small world property of protein interaction network and Bayesian framework | 0.762 |
| Pattern miming with gap-constraint | Use graph pattern mining and frequent sequential pattern mining with gap constraints | 0.972 |
 PubReader
 Cite
Cite


