
Articles
- Page Path
- HOME > Osong Public Health Res Perspect > Volume 5(6); 2014 > Article
-
Original Article
Aging-related Changes in Mouse Serum Glycerophospholipid Profiles - Seungwoo Kim, Hyo-Soon Cheon, Jae-Chun Song, Sang-Moon Yun, Sang Ick Park, Jae-Pil Jeon
-
Osong Public Health and Research Perspectives 2014;5(6):345-350.
DOI: https://doi.org/10.1016/j.phrp.2014.10.002
Published online: November 13, 2014
Division of Brain Diseases, Korea National Institute of Health, Cheongju, Korea
- ∗Corresponding author. jaepiljeon@hanmail.net
© 2014 Published by Elsevier B.V. on behalf of Korea Centers for Disease Control and Prevention.
This is an Open Access article distributed under the terms of the CC-BY-NC License (http://creativecommons.org/licenses/by-nc/3.0).
Abstract
-
Objectives
- Metabolic dysfunction is a common hallmark of the aging process and aging-related pathogenesis. Blood metabolites have been used as biomarkers for many diseases, including cancers, complex chronic diseases, and neurodegenerative diseases.
-
Methods
- In order to identify aging-related biomarkers from blood metabolites, we investigated the specific metabolite profiles of mouse sera from 4-month-old and 21-month-old mice by using a combined flow injection analysis–tandem mass spectrometry and liquid chromatography–tandem mass spectrometry.
-
Results
- Among the 156 metabolites detected, serum levels of nine individual metabolites were found to vary with aging. Specifically, lysophosphatidylcholine (LPC) acyl (a) C24:0 levels in aged mice were decreased compared to that in young mice, whereas phosphatidylcholine (PC) acyl-alkyl (ae) C38:4, PC ae C40:4, and PC ae C42:1 levels were increased. Three classes of metabolites (amino acids, LPCs, and PCs) differed in intraclass correlation patterns of the individual metabolites between sera from young and aged mice. Additionally, the ratio of LPC a C24:0 to PC ae C38:4 was decreased in the aged mice, whereas the ratio of PC ae C40:4 to LPC a C24:0 was increased, supporting the aging-related metabolic changes of glycerophospholipids.
-
Conclusion
- The ratios of the individual metabolites PC and LPC could serve as potential biomarkers for aging and aging-related diseases.
- Aging is an irreversible and progressive, multidimensional, complex process that includes the accumulation of cellular and organ damage, leading to a decline in function [1,2]. Aging is also known to be a risk factor for many prevalent diseases such as diabetes, cancers, and cardiovascular and neurodegenerative diseases (e.g. Alzheimer's and Parkinson's diseases) [3]. Therefore, the discovery of aging and aging-related disease biomarkers is important for the early diagnosis and therapy of diseases.
- Recent metabolomic studies have primarily attempted to understand the underlying biological process to develop disease biomarkers [4]. In particular, metabolomic analysis is suitable for the discovery of aging-related biomarkers because it has been shown that metabolic dysfunction is a common hallmark of the aging process [5]. The utility of targeted metabolomics for the discovery and validation of disease biomarkers has been recently established [6]. Although metabolomic studies have resulted in the identification of aging-related biomarkers from human samples [7–9] and animal models [5,10,11], consistent blood biomarkers of the aging process still need to be identified.
- Phospholipids can function as pathogenic indicators of many diseases such as Alzheimer's disease [12–15], ovarian endometriosis [16], and rheumatoid arthritis [17]. Phosphatidylcholine (PC) is a major component of phospholipids. It was reported that rat plasma phospholipids consist of PCs (∼70% of total phospholipids), very low-density lipoproteins with sphingomyelin (SM; 11%), lysophosphatidylcholine (LPC; 3%), phosphatidylethanolamine (4%), and phosphatidylinositol (3%) [18]. LPCs are generated by the hydrolysis of PCs by phospholipase A2, which plays an important role in inflammatory responses [19].
- The purpose of this study was to examine aging-related changes in serum concentrations of metabolites in young and aged mice to further increase our understanding of the metabolite-related aging process. We found the ratios of LPC acyl (a) C24:0 to PC acyl-alkyl (ae) C38:4 and PC ae C40:4 to LPC a C24:0 were significantly different among sera from young and aged mice. These results suggest that the ratios of PC and LPC levels could provide aging-related metabolic information from blood as well as provide clues for the identification of antiaging molecular targets.
Introduction
- 2.1 Animals
- C57BL6/J mice were purchased from The Laboratory Animal Resource Center, Korea Research Institute of Bioscience & Biotechnology (KRIBB; Ochang, Chungcheongbuk-do, Korea). All mice were maintained in a specific-pathogen free area, according to standard animal care protocols. Whole blood was collected via heart puncture following euthanasia by cervical dislocation. Collected blood was incubated for 20 minutes at room temperature in Serum Separator Tubes (BD Bioscience, Franklin Lakes, NJ, USA), and clots were then removed by centrifugation at 1500 × g. Sera were stored at −70°C until needed.
- 2.2 Metabolite quantification
- Targeted metabolite concentrations were measured using the Absolute IDQ p180 Kit (Biocrates Life Sciences AG, Innsbruck, Austria). The assay procedures have been previously described in detail [20]. Serum metabolites were quantified using appropriate internal standards included in the kit. The 186 metabolites targeted included 40 acylcarnitines (ACs), 21 amino acids (AAs), 19 biogenic amines (BAs), 14 LPCs, 38 PC diacyl, 38 PC ae, 15 SMs, and the sum of hexoses (H1). In brief, AAs and BAs were measured by liquid chromatography–tandem mass spectrometry, and ACs, phospho- and sphingolipids, and hexoses were measured by flow injection analysis–tandem mass spectrometry on API 4000 QTRAP (ABSCIEX, Framingham, MA, USA). To ensure data quality, metabolites coefficient of variance (CV) that was under 20% and above the limit of detection (LOD) were selected. The CV and LOD criteria were passed by 156 metabolites. Concentrations of all detected metabolites are reported as μM.
- 2.3 Statistical analysis
- Statistical analysis was performed using three different methods, including t test and additional BiomarkeR and limma packages in Bioconductor (http://www.bioconductor.org), to identify statistically powerful biomarkers. The BiomarkeR package in Bioconductor has a network-based approach to identify biomarkers in metabolomics research [21]. It provides the biomarker identifier (BI) score by measuring the change of each metabolite and connectivity of the metabolites within the network. The measured metabolite data were imported into the BiomarkeR package and analyzed with the unpaired BI method. The selected biomarkers were plotted with the unpaired BI Graph method. Next, for the linear modeling approach, the concentration of each metabolite was transformed by log and normalized with the quantile normalization method. Then, we employed the limma package in Bioconductor that is designed to stabilize the analysis with linear modeling. The p-values were adjusted for multiple tests. Volcano plots were constructed using an empirical Bayes method in the limma package. The metabolite serum concentrations were normally distributed as indicated by the Kolmogorov–Smirnov test. All statistical analyses were carried out using SPSS version 20 (SPSS Inc., Chicago, IL, USA) and R program (http://www.R-project.org).
Materials and methods
- We used a targeted metabolomic analysis to identify aging-related biomarkers and specific profiles of serum metabolites in the aging process. We investigated seven classes of metabolites (ACs, BAs, AAs, LPCs, PCs, SMs, and hexoses) from young and aged mice. Of these 186 metabolites, 156 were detected in mouse sera at levels above the LOD. Via statistical analysis, we found changes in serum concentrations of 23 metabolites in the young (4-month-old) and aged (21-month-old) mice (Table 1). These 23 metabolites consisted of five classes: ACs (n = 6), BAs (n = 4), LPCs (n = 2), PCs (n = 8), and SMs (n = 3). Of these five classes of metabolites, ACs, LPCs, and SMs were all decreased in sera from aged mice, compared with sera from young mice. By contrast, members of the BA and PC classes were either increased or decreased in aged mice, compared with young mice, thus not displaying intraclass consistency.
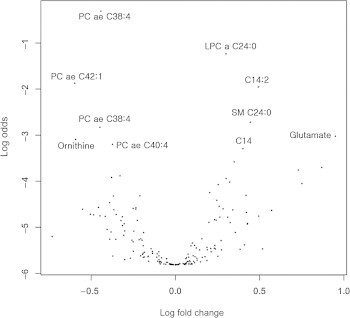
- For aging biomarker identification, we employed a recently published statistical biomarker discovery strategy, the BiomarkeR algorithm [21,22]. The BiomarkeR software was utilized for biomarker identification using a BI score and connectivity strength within the biochemical network of metabolites. The top 10 ranked metabolites and their BI scores are listed in Table 2. According to BiomarkeR algorithm analysis, glutamate, kynurenine, LPC a C17:0, and carnitine (C0) exhibited the top four BI scores, but these metabolites were not represented as significant in the t test (glutamate, LPC a C17:0, and C0) or volcano plot (kynurenine, LPC a C17:0, and C0; Table 3). In addition to the BI score method, we also used a volcano plot to analyze metabolite profiles by log transformation of the p-value and fold-change (Figure 1). Thirteen metabolites displayed significantly different serum concentrations between young and aged mouse sera (Table 3). Finally, our three different statistical analyses allowed for the identification of age-dependent serum biomarkers involving nine metabolites, namely, tetradecanoylcarnitine (C14), hydroxyvalerylcarnitine (C5-OH), sarcosine, spermidine, LPC a C24:0, PC ae C38:4, C40:4, C42:1, and SM C24:0.
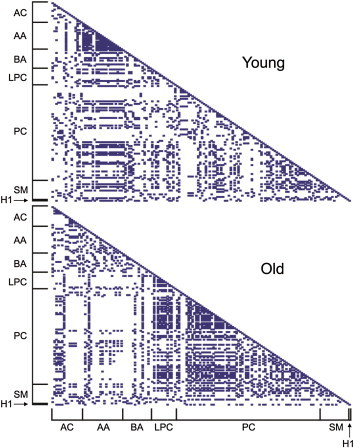
- We calculated pair-wise correlation coefficients of individual metabolites of either young or aged mice (Figure 2). Higher intraclass correlation coefficients were observed for AAs in young mouse sera, but not in aged mouse sera. On the contrary, metabolite classes of PCs and LPCs displayed higher pair-wise correlation coefficients in aged mice relative to the young mice. This suggests that the relative ratios of individual metabolites within a particular intraclass may play an important role in the aging process.
- Next, we examined the pair-wise ratios of nine individual metabolites that were selected using the three statistical methods and compared the difference of the ratios between young and aged mice. It is likely that the relative ratios of metabolite pairs within the sample may reduce experimental bias due to sample variation, aiding in the generation of more reliable results. The Bonferroni correction was used for multiple comparisons. The ratios of LPC a C24:0 to PC ae C38:4 and PC ae C40:4 to LPC a C24:0 were significantly different (9 × 8 = 72 pair-wise ratios, p < 0.00069) between young and aged mice (Table 4). The ratio of LPC a C24:0 to PC ae C38:4 was decreased in aged mice whereas the ratio of PC ae C40:4 to LPC a C24:0 was increased, relative to the ratios observed in young mice.
Results
- We measured metabolite concentrations from young and aged mouse sera by using targeted metabolomics coupled with multiple statistical methods to identify aging-related biomarkers. The ratios of both LPC a C24:0 to PC ae C38:4 and PC ae C40:4 to LPC a C24:0 exhibited significant difference (p < 0.00069, after the Bonferroni correction) between young and aged mice. These results suggest that the relative concentrations of PCs to LPCs may provide a clue for the development of aging-related biomarkers in blood samples.
- In this study, we successfully quantified the serum concentrations of 156 out of 186 metabolites; detection of the other 30 metabolites probably failed because the kit used in this study was originally designed for the range of metabolite concentrations from human samples. Among the metabolites quantified, 23 displayed a significant difference (p < 0.05) in serum concentrations between young and aged mice (Table 1).
- Decreased levels of ACs (excluding butyrylcarnitine and valeryl-l-carnitine) and BAs (excluding histamine and kynurenine) were observed in the sera from aged mice. It was recently reported that plasma AC levels are associated with diabetes [23], myocardial infarction [24], and impaired muscle function in elderly men [25]. However, the relevance of alterations in blood AC levels with aging are unknown. Polyamine (putrescine, spermidine, and spermine) levels were known to decrease with aging in many organisms [26]. In this study, spermidine and spermine levels were significantly decreased in the sera from aged mice, relative to young mice. Therefore, ACs and polyamines were worthy of further investigation regarding their involvement in aging.
- After our comprehensive statistical analysis, nine metabolites [tetradecanoylcarnitine (C14), hydroxyvalerylcarnitine (C5-OH), sarcosine, spermidine, LPC a C24:0, PC ae C38:4, PC ae C40:4, PC ae C42:1, and SM C24:0] were identified as aging-related serum metabolites. With the exception of PC ae C38:4 and PC ae C40:4, the concentrations of selected metabolites were decreased in aged mice, relative to young mice. Some metabolomics studies have reported that ratios of metabolite pairs can be used to reduce experimental bias and provide statistical power for biomarker discovery from disease samples [12,16,27]. In human serum [27] and pig plasma [28] samples, the ratios of AAs were found to be useful as biomarkers for knee osteoarthritis and asphyxia. The ratios of PC and LPC have also been promising targets in biomarker discovery for many diseases. For example, the PC/LPC ratio in human plasma was useful for indicating the severity of rheumatoid arthritis [17] and the LPC/PC ratio in human cerebrospinal fluid is decreased in Alzheimer's disease [12].
- In this study, although significant changes in AA and sugar levels were not observed between young and aged mice, AAs exhibited high correlation coefficients with intraclass metabolites in young mouse sera (Figure 2). By contrast, aged mice displayed higher correlations of metabolite concentrations within PCs or LPCs than young mice. These results revealed that global patterns of correlation coefficients of intraclass metabolites of AAs, PCs, and LPCs might be useful as age-dependent fingerprints of potential metabolite biomarkers for the aging process.
- Glycerol-based phospholipids, glycerophospholipids (GPs), are important not only to maintain neural membrane structure but also to provide suitable environment, fluidity, and ion-permeability [29]. Changes in the phospholipid content of neural cell membranes may contribute to neurodegenerative diseases. Many studies have been conducted to reveal a relationship between lipid metabolism and neurodegenerative diseases such as Alzheimer's disease. Recently, plasma PC and phospholipid levels were identified as potential diagnostic biomarkers for Alzheimer's disease [14] and predictive biomarkers for the conversion of preclinical Alzheimer's disease [15]. PC is the major phospholipid of cellular membranes [30]. In fact, SM and LPC are synthesized from PC via SM synthases and phospholipase A2, respectively. This study reveals that the correlation coefficients of PC, LPC, and SM are altered with aging in mice. Further studies are needed to uncover the biological significance of the changes in GP content in neurodegenerative disease pathogenesis and potentially revealing a link to aging-dependent metabolite changes.
- Many studies have demonstrated that blood metabolic profiles are altered by aging in humans and mice. A recent report indicated that some ACs, SMs, and PCs increased with age, while histidine was decreased [7]. Recent metabolomics studies have shown that the analysis of metabolic profiles of mouse sera could predict biological age [10]. Houtkooper et al [5] reported that levels of long chain ACs and various AAs were decreased in the plasma of aged mice while free fatty acid levels were increased. Consistent with that report, our results also revealed that long-chain ACs (C14, C16, C18 and C18:1) were significantly decreased (Table 1) and some amino acids tended to be decreased in aged mice.
- Our results suggest that PC/LPC ratios can be developed as metabolic indicators of the aging process, providing better targets for antiaging and aging-related disease therapy. To our knowledge, this is the first report to identify the PC/LPC ratio as a potential biomarker of aging. Therefore, further studies should extend to human samples to investigate the biological relevance of PC and LPC serum concentrations and other metabolite ratios in the aging process.
Discussion
- All contributing authors declare no conflicts of interest.
Conflicts of interest
-
Acknowledgements
- We thank Dr. K.Y. Kim in Clinical Trial Center of Inha University Hospital and Dr. S.J. Yu in the Supercomputing R&D center of the Korea Institute of Science and Technology Information for his assistance in statistical analysis. This study was supported by an intramural fund (2012-NG62002-00) from the Korea Center for Disease Control and Prevention (KCDC), Korea National Institute of Health (KNIH).
Acknowledgments
-
This is an Open Access article distributed under the terms of the Creative Commons Attribution Non-Commercial License (http://creativecommons.org/licenses/by-nc/3.0) which permits unrestricted non-commercial use, distribution, and reproduction in any medium, provided the original work is properly cited.
Article information
- 1. Fontana L., Partridge L., Longo V.. Extending healthy life span from yeast to humans. Science 328(5976). 2010 Apr;321−326. PMID: 20395504.ArticlePubMed
- 2. Valdes A.M., Glass D., Spector T.D.. Omics technologies and the study of human ageing. Nat Rev Genet 14(9). 2013 Sep;601−607. PMID: 23938363.ArticlePubMed
- 3. Niccoli T., Partridge L.. Ageing as a risk factor for disease. Curr Biol 22(17). 2012 Sep;R741−R752. PMID: 22975005.ArticlePubMed
- 4. Xia J., Broadhurst D., Wilson M.. Translational biomarker discovery in clinical metabolomics: an introductory tutorial. Metabolomics 9(2). 2012 Dec;280−299. PMID: 23543913.ArticlePubMed
- 5. Houtkooper R.H., Argmann C., Houten S.M.. The metabolic footprint of aging in mice. Sci Rep 1(134). 2011 Oct;134−148. PMID: 22355651.ArticlePubMed
- 6. Griffiths W.J., Koal T., Wang Y.. Targeted metabolomics for biomarker discovery. Angew Chem Int Ed Engl 49(32). 2010 Jun;5426−5445. PMID: 20629054.ArticlePubMed
- 7. Yu Z., Zhai G., Singmann P.. Human serum metabolic profiles are age dependent. Aging Cell 11(6). 2012 Dec;960−967. PMID: 22834969.ArticlePubMed
- 8. Menni C., Zhai G., MacGregor A.. Targeted metabolomics profiles are strongly correlated with nutritional patterns in women. Metabolomics 9(2). 2012 Oct;506−514. PMID: 23543136.ArticlePubMed
- 9. Krištić J., Vučković F., Menni C.. Glycans are a novel biomarker of chronological and biological ages. J Gerontol A Biol Sci Med 69(7). 2014 Jul;779−789.Article
- 10. Tomás-Loba A., Jesus B.B., Mato J.M.. A metabolic signature predicts biological age in mice. Aging Cell 12(1). 2013 Feb;93−101. PMID: 23107558.ArticlePubMed
- 11. Wang Y., Lawler D., Larson B.. Metabolomic investigations of aging and caloric restriction in a life-long dog study. J Proteome Res 6(5). 2007 May;1846−1854. PMID: 17411081.ArticlePubMed
- 12. Mulder C., Wahlund L.O., Teerlink T.. Decreased lysophosphatidylcholine/phosphatidylcholine ratio in cerebrospinal fluid in Alzheimer's disease. J Neural Transm 110(8). 2003 Jun;949−955. PMID: 12898349.ArticlePubMed
- 13. Orešič M., Hyötyläinen T., Herukka S.K.. Metabolome in progression to Alzheimer's disease. Transl Psychiatry 1:2011 Dec;e57PMID: 22832349.ArticlePubMed
- 14. Whiley L., Sen A., Heaton J.. Evidence of altered phosphatidylcholine metabolism in Alzheimer's disease. Neurobiol Aging 35(2). 2014 Sep;271−278. PMID: 24041970.ArticlePubMed
- 15. Mapstone M., Cheema A.K., Fiandaca M.S.. Plasma phospholipids identify antecedent memory impairment in older adults. Nat Med 20(4). 2014 Apr;415−418. PMID: 24608097.ArticlePubMed
- 16. Vouk K., Hevir N., Ribič-Pucelj M.. Discovery of phosphatidylcholinesand sphingomyelins as biomarkers for ovarian endometriosis. Hum Reprod 27(10). 2012 Aug;2955−2965. PMID: 22859507.ArticlePubMed
- 17. Fuchs B., Schiller J., Wagner U.. The phosphatidylcholine/lysophosphatidylcholine ratio in human plasma is an indicator of the severity of rheumatoid arthritis: investigations by 31P NMR and MALDI-TOF MS. Clin Biochem 38(10). 2005 Oct;925−933. PMID: 16043165.ArticlePubMed
- 18. Agren J.J., Kurvinen J.P., Kuksis A.. Isolation of very low-density lipoprotein phospholipids enriched in ethanolamine phospholipids from rats injected with Triton WR 1339. Biochim Biophys Acta 1734(1). 2005 May;34−43. PMID: 15866481.ArticlePubMed
- 19. Linkous A., Yazlovitskaya E.. Cytosolic phospholipase A2 as a mediator of disease pathogenesis. Cell Microbiol 12(11). 2010 Oct;1369−1377. PMID: 20642808.ArticlePubMed
- 20. Laiakis E., Hyduke D., Fornace A.. Comparison of mouse urinary metabolic profiles after exposure to the inflammatory stressors gamma radiation and lipopolysaccharide. Radiat Res 177(2). 2012 Feb;187−199. PMID: 22128784.ArticlePubMed
- 21. Netzer M., Weinberger K.M., Handler M.. Profiling the human response to physical exercise: a computational strategy for the identification and kinetic analysis of metabolic biomarkers. J Clin Bioinforma 1(1). 2011 Dec;34−39. PMID: 22182709.ArticlePubMed
- 22. Baumgartner C., Lewis G.D., Netzer M.. A new data mining approach for profiling and categorizing kinetic patterns of metabolic biomarkers after myocardial injury. Bioinformatics 26(14). 2010 Jul;1745−1751. PMID: 20483816.ArticlePubMed
- 23. Mai M., Tönjes A., Kovacs P.. Serum levels of acylcarnitines are altered in prediabetic conditions. PLoS ONE 8:2013 Dec;e82459PMID: 24358186.ArticlePubMed
- 24. Khan A.H., Alhomida S.A., Madani A.H.. Carnitine and acylcarnitine profiles in dried blood spots of patients with acute myocardial infarction. Metabolomics 9(4). 2013 Feb;828−838.Article
- 25. Lum H., Sloane R., Huffman K.M.. Plasma acylcarnitines are associated with physical performance in elderly men. J Gerontol A Biol Sci Med Sci 66(5). 2011 May;548−553. PMID: 21367961.ArticlePubMed
- 26. Minois N., Carmona-Gutierrez D., Madeo F.. Polyamines in aging and disease. Aging 3(8). 2011 Aug;716−732. PMID: 21869457.ArticlePubMed
- 27. Zhai G., Wang-Sattler R., Hart D.J.. Serum branched-chain amino acid to histidine ratio: a novel metabolomic biomarker of knee osteoarthritis. Ann Rheum Dis 69(6). 2010 Jun;1227−1231. PMID: 20388742.ArticlePubMed
- 28. Solberg R., Enot D., Deigner H.P.. Metabolomic Analyses of plasma reveals new insights into asphyxia and resuscitation in pigs. PLoS ONE 5:2010 Mar;e9606PMID: 20231903.ArticlePubMed
- 29. Frisardi V., Pansa F., Seripa D.. Glycerophospholipids and glycerophospholipid-derived lipid mediators: a complex meshwork in Alzheimer's disease pathology. Prog Lipid Res 50(4). 2011 Oct;313−330. PMID: 21703303.ArticlePubMed
- 30. Klein J.. Membrane breakdown in acute and chronic neurodegeneration: focus on choline-containing phospholipids. J Neural Transm 107(8–9). 2000;1027−1063. PMID: 11041281.ArticlePubMed
References
| Metabolite | Younga | Ageda | Up or downb | p* |
|---|---|---|---|---|
| AC | ||||
| C14 | 0.09 ± 0.01 | 0.07 ± 0.01 | ↓ | 0.035 |
| C16 | 0.24 ± 0.01 | 0.16 ± 0.02 | ↓ | 0.006 |
| C18 | 0.06 ± 0.01 | 0.05 ± 0.01 | ↓ | 0.048 |
| C18:1 | 0.21 ± 0.00 | 0.19 ± 0.00 | ↓ | 0.001 |
| C2 | 26.88 ± 1.29 | 19.53 ± 1.75 | ↓ | 0.004 |
| C5-OH | 0.10 ± 0.01 | 0.07 ± 0.01 | ↓ | 0.003 |
| BA | ||||
| Kynurenine | 0.89 ± 0.11 | 1.09 ± 0.05 | ↑ | 0.040 |
| Sarcosine | 5.49 ± 0.62 | 3.29 ± 1.20 | ↓ | 0.048 |
| Spermidine | 6.79 ± 0.85 | 3.61 ± 0.57 | ↓ | 0.006 |
| Spermine | 1.05 ± 0.08 | 0.72 ± 0.06 | ↓ | 0.004 |
| LPC | ||||
| LPC a C16:0 | 424.54 ± 1.86 | 399.76 ± 13.25 | ↓ | 0.033 |
| LPC a C24:0 | 0.73 ± 0.07 | 0.56 ± 0.06 | ↓ | 0.039 |
| PC | ||||
| PC aa C28:1 | 0.17 ± 0.01 | 0.22 ± 0.02 | ↑ | 0.017 |
| PC aa C34:3 | 18.06 ± 0.30 | 20.08 ± 1.19 | ↑ | 0.046 |
| PC aa C42:6 | 1.96 ± 0.03 | 1.40 ± 0.15 | ↓ | 0.004 |
| PC ae C34:1 | 6.01 ± 0.21 | 5.18 ± 0.44 | ↓ | 0.042 |
| PC ae C38:4 | 4.70 ± 0.47 | 5.78 ± 0.38 | ↑ | 0.037 |
| PC ae C38:6 | 3.75 ± 0.12 | 3.03 ± 0.31 | ↓ | 0.020 |
| PC ae C40:4 | 2.11 ± 0.12 | 2.76 ± 0.29 | ↑ | 0.024 |
| PC ae C42:1 | 0.53 ± 0.10 | 0.75 ± 0.08 | ↑ | 0.040 |
| SM | ||||
| SM C16:1 | 6.15 ± 0.12 | 4.79 ± 0.78 | ↓ | 0.041 |
| SM C18:0 | 3.21 ± 0.14 | 2.72 ± 0.18 | ↓ | 0.021 |
| SM C24:0 | 14.34 ± 0.33 | 10.06 ± 1.44 | ↓ | 0.007 |
*t-test comparison between young and aged mice.
AC = acylcarnitines; BA = biogenic amines; C14 = tetradecanoylcarnitine; C16 = hexadecanoylcarnitine; C18 = octadecanoylcarnitine; C18:1 = octadecanoylcarnitine; C2 = acetylcarnitine; C5-OH = hydroxyvalerylcarnitine; LPC = lysophosphatidylcholines; PC = phosphatidylcholines; SM = sphingomyelins.
| Metabolite | BI score |
|---|---|
| Glutamate | 275.9 |
| Kynurenine | 195.3 |
| LPC a C17:0 | 167.8 |
| C0 | 159.3 |
| PC ae C42:1 | 143.2 |
| Spermidine | 135.5 |
| PC ae C38:4 | 133.4 |
| Sarcosine | 128.4 |
| Hexose | 127.8 |
| C14 | 125.1 |
| Metabolite | p* | BI scorea | Adjusted p** |
|---|---|---|---|
| AC | |||
| C0 | NS | 159.3 | NS |
| C14 | 0.035 | 125.1 | 0.025 |
| C5-OH | 0.003 | 123.4 | 0.036 |
| AA | |||
| Glutamate | NS | 275.9 | 0.019 |
| BA | |||
| kyneurenine | 0.040 | 195.3 | NS |
| Sarcosine | 0.048 | 128.4 | 0.044 |
| Spermidine | 0.006 | 135.5 | 0.041 |
| LPC | |||
| LPC a C17:0 | NS | 167.8 | NS |
| LPC a C24:0 | 0.039 | 112.4 | 0.002 |
| PC | |||
| PC ae C38:4 | 0.037 | 133.4 | 0.001 |
| PC ae C40:4 | 0.024 | 117.9 | 0.022 |
| PC ae C42:1 | 0.040 | 143.2 | 0.005 |
| SM | |||
| SM C24:0 | 0.007 | 120.8 | 0.013 |
*t test comparison between the groups.
** Results from limma package. The p value is adjusted by Benjamini and Hochberg method.
a = acyl; AC = acylcarnitines; ae = acyl-alkyl; AA = amino acids; BA = biogenic amines; LPC = lysophosphatidylcholines; NS = not significant (p > 0.05); PC = phosphatidylcholines; SM = sphingomyelins.
Figure & Data
References
Citations
- Age-related changes in antigen-specific natural antibodies are influenced by sex
Sarah E. Webster, Naomi L. Tsuji, Michael J. Clemente, Nichol E. Holodick
Frontiers in Immunology.2023;[Epub] CrossRef - Age-related changes in adipose tissue metabolomics and inflammation, cardiolipin metabolism, and ferroptosis markers in female aged rat model
Zhuang-Zhi Wang, Fang-Hui Li, Pin-Shi Ni, Lei Sun, Chen-Kai Zhang, Bo-Ming Li, Jia-Han He, Xiao-Ming Yu, Yun-Qing Liu
Biochemical and Biophysical Research Communication.2023; 671: 292. CrossRef - Apolipoprotein E knockout may affect cognitive function in D-galactose-induced aging mice through the gut microbiota–brain axis
Bowei Chen, Jian Yi, Yaqian Xu, Huiqiao Wen, Fengming Tian, Yingfei Liu, Lan Xiao, Lisong Li, Baiyan Liu
Frontiers in Neuroscience.2022;[Epub] CrossRef - Posterior subcapsular cataracts are a late effect after acute exposure to 0.5 Gy ionizing radiation in mice
Sarah Kunze, Alexander Cecil, Cornelia Prehn, Gabriele Möller, Andreas Ohlmann, Gerhild Wildner, Stephan Thurau, Kristian Unger, Ute Rößler, Sabine M. Hölter, Soile Tapio, Florian Wagner, Andreas Beyerlein, Fabian Theis, Horst Zitzelsberger, Ulrike Kulka,
International Journal of Radiation Biology.2021; 97(4): 529. CrossRef - Noninvasive Analysis Using Data-Independent Acquisition Mass Spectrometry: New Epidermal Proteins That Reveal Sex Differences in the Aging Process
Shirui Chen, Hui Zhang, Mengting Liu, Yaochi Wang, Cong Xin, Jing Ma, Xiaodong Zheng, Xuejun Zhang, Liangdan Sun, Sen Yang, Alexandros Georgakilas
Oxidative Medicine and Cellular Longevity.2021; 2021: 1. CrossRef - Phospholipases and Reactive Oxygen Species Derived Lipid Biomarkers in Healthy and Diseased Humans and Animals – A Focus on Lysophosphatidylcholine
Kathrin M. Engel, Jürgen Schiller, Christina E. Galuska, Beate Fuchs
Frontiers in Physiology.2021;[Epub] CrossRef - Metabolomics Study of Isocaloric Different Dietary Patterns on the Life Span in Healthy Population
Cong Zhang, Qingna Yan, Qiushuang Zhu, Jinxiao Liu, Yuanjie Dong, Yuqiao Li, Ruohua Wang, Xuanfeng Tang, Xinyi Lv, Xiaoqing Li, Yunjiang Cai, Yucun Niu
Clinical Interventions in Aging.2021; Volume 16: 2111. CrossRef - Increased plasma phosphatidylcholine/lysophosphatidylcholine ratios in patients with Parkinson's disease
Jadranka Miletić Vukajlović, Dunja Drakulić, Snežana Pejić, Tihomir V. Ilić, Aleksandra Stefanović, Marijana Petković, Jürgen Schiller
Rapid Communications in Mass Spectrometry.2020;[Epub] CrossRef - Effects of lifelong exercise and aging on the blood metabolic fingerprint of rats
Anastasia Tzimou, Dimitra Benaki, Stefanos Nikolaidis, Emmanuel Mikros, Ioannis Taitzoglou, Vassilis Mougios
Biogerontology.2020; 21(5): 577. CrossRef - Ginsenoside Rb1 retards aging process by regulating cell cycle, apoptotic pathway and metabolism of aging mice
Shujie Yu, Hui Xia, Yanlei Guo, Xiaoxian Qian, Xiaojuan Zou, Huabing Yang, Mingzhu Yin, Hongtao Liu
Journal of Ethnopharmacology.2020; 255: 112746. CrossRef - Exercise-induced recovery of plasma lipids perturbed by ageing with nanoflow UHPLC-ESI-MS/MS
Kang Uk Kim, Kyeong Jin Yoon, Suhong Park, Jong Cheol Lee, Hyo Youl Moon, Myeong Hee Moon
Analytical and Bioanalytical Chemistry.2020; 412(28): 8003. CrossRef - Mouse Age Matters: How Age Affects the Murine Plasma Metabolome
Patrick Pann, Martin Hrabě de Angelis, Cornelia Prehn, Jerzy Adamski
Metabolites.2020; 10(11): 472. CrossRef - Effects of Aging, Long-Term and Lifelong Exercise on the Urinary Metabolic Footprint of Rats
Anastasia Tzimou, Stefanos Nikolaidis, Olga Begou, Aikaterina Siopi, Olga Deda, Ioannis Taitzoglou, Georgios Theodoridis, Vassilis Mougios
Metabolites.2020; 10(12): 481. CrossRef - Trends of Food Supply and Nutrient Intake in South Korea Over the Past 30 Years
JONG-GYU KIM, JOONG-SOON KIM, JEONG - GYOO KIM
Current Research in Nutrition and Food Science Jou.2019; 7(1): 85. CrossRef - Whole Blood Transcriptome Analysis for Lifelong Monitoring in Elite Sniffer Dogs Produced by Somatic Cell Nuclear Transfer
Sun-A Ock, Inchul Choi, Gi-Sun Im, Jae Gyu Yoo
Cellular Reprogramming.2019; 21(6): 301. CrossRef - Retracted Article: High-throughput metabolomics identifies serum metabolic signatures in acute kidney injury using LC-MS combined with pattern recognition approach
Hai-Hong Li, Jian-Liang Pan, Su Hui, Xiao-Wei Ma, Zhi-Long Wang, Hui-Xin Yao, Jun-Feng Wang, Hong Li
RSC Advances.2018; 8(27): 14838. CrossRef - A Metabolomics Profiling of Glaucoma Points to Mitochondrial Dysfunction, Senescence, and Polyamines Deficiency
Stéphanie Leruez, Alexandre Marill, Thomas Bresson, Grégoire de Saint Martin, Adrien Buisset, Jeanne Muller, Lydie Tessier, Cédric Gadras, Christophe Verny, Philippe Gohier, Patrizia Amati-Bonneau, Guy Lenaers, Dominique Bonneau, Gilles Simard, Dan Milea,
Investigative Opthalmology & Visual Science.2018; 59(11): 4355. CrossRef - Lactobacillus acidophilus DDS-1 Modulates the Gut Microbiota and Improves Metabolic Profiles in Aging Mice
Ravichandra Vemuri, Tanvi Shinde, Rohit Gundamaraju, Shakuntla Gondalia, Avinash Karpe, David Beale, Christopher Martoni, Rajaraman Eri
Nutrients.2018; 10(9): 1255. CrossRef - Role of kinase-coupled TRP channels in mineral homeostasis
Vladimir Chubanov, Lorenz Mittermeier, Thomas Gudermann
Pharmacology & Therapeutics.2018; 184: 159. CrossRef - Sarcosine Is Uniquely Modulated by Aging and Dietary Restriction in Rodents and Humans
Ryan O. Walters, Esperanza Arias, Antonio Diaz, Emmanuel S. Burgos, Fangxia Guan, Simoni Tiano, Kai Mao, Cara L. Green, Yungping Qiu, Hardik Shah, Donghai Wang, Adam D. Hudgins, Tahmineh Tabrizian, Valeria Tosti, David Shechter, Luigi Fontana, Irwin J. Ku
Cell Reports.2018; 25(3): 663. CrossRef - Mild TBI Results in a Long-Term Decrease in Circulating Phospholipids in a Mouse Model of Injury
Tanja Emmerich, Laila Abdullah, Joseph Ojo, Benoit Mouzon, Thinh Nguyen, Gary S. Laco, Gogce Crynen, James E. Evans, Jon Reed, Michael Mullan, Fiona Crawford
NeuroMolecular Medicine.2017; 19(1): 122. CrossRef - Improved motor and cognitive performance with sodium nitrite supplementation is related to small metabolite signatures: a pilot trial in middle-aged and older adults
Jamie N. Justice, Lawrence C. Johnson, Allison E. DeVan, Charmion Cruickshank-Quinn, Nichole Reisdorph, Candace J. Bassett, Trent D. Evans, Forrest A. Brooks, Nathan S. Bryan, Michel B. Chonchol, Tony Giordano, Matthew B. McQueen, Douglas R. Seals
Aging.2015; 7(11): 1004. CrossRef
 PubReader
 Cite
Cite

