
Articles
- Page Path
- HOME > Osong Public Health Res Perspect > Volume 5(2); 2014 > Article
-
Original Article
Assessment of the Intensive Countermeasures in the 2009 Pandemic Influenza in Korea - Jin Hyuk Choia, Yunhwan Kimb, Seoyun Choec, Sunmi Leec
-
Osong Public Health and Research Perspectives 2014;5(2):101-107.
DOI: https://doi.org/10.1016/j.phrp.2014.03.003
Published online: April 2, 2014
aHumanitas College, Kyung Hee University, Yongin, Korea
bDepartment of Communication and Information, Hankuk University of Foreign Studies, Seoul, Korea
cDepartment of Applied Mathematics, Kyung Hee University, Yongin, Korea
- ∗Corresponding author. sunmilee@khu.ac.kr
© 2014 Published by Elsevier B.V. on behalf of Korea Centers for Disease Control and Prevention.
This is an Open Access article distributed under the terms of the Creative Commons Attribution Non-Commercial License (http://creativecommons.org/licenses/by-nc/3.0) which permits unrestricted non-commercial use, distribution, and reproduction in any medium, provided the original work is properly cited.
- 2,634 Views
- 18 Download
- 1 Scopus
Abstract
-
Objectives
- It is critical to implement effective multiple countermeasures to mitigate or retain the spread of pandemic influenza. We propose a mathematical pandemic influenza model to assess the effectiveness of multiple countermeasures implemented in 2009.
-
Methods
- Age-specific parameters, including the transmission rate, the proportion of asymptomatic individuals, the vaccination rate, the social distancing rate, and the antiviral treatment rate are estimated using the least-square method calibrated to the incidence data.
-
Results
- The multiple interventions (intensive vaccination, social distancing, antivrial treatment) were successfully implemented resulting in the dramatic reduction in the total number of incidence.
-
Conclusion
- The model output is sensitive to age-specific parameters and this leads to the fact that a more elaborate age group model should be developed and extensive further studies must be followed.
- Influenza imposes serious social and economic burden to many countries all around the world [1]. In the US, seasonal influenza results in 200,000 hospitalizations and 36,000 deaths annually, thus its economic burden amounts up to $87.1 billion per year [2]. In France, the economic loss due to the absence from workplace caused by influenza is approximately 13,076 French Francs (about €2,431) in a year [3]. People in UK reportedly miss on average 2.8 workdays because of influenza [4]. In Germany, the per unit cost of an influenza case in 1996–97 was 1,777 Deutsche Mark (about €1,105.63) [5]. According to Szuch [6], the productivity loss per unit due to missing workdays because of influenza was to range from €1,379 to €6,991 and from €482 to €1,409 due to direct infection. In addition to direct economic burden, spread of influenza can cause psychological burden that is not reported in the statistical records on economic loss.
- Therefore, government and public health officials in many countries have made their efforts to resist against the spread of influenza, which is especially the case when it comes to pandemic influenza. The countermeasure strategy includes vaccination, social distancing, and anti-viral treatment. Given the limited amount of available resources, it is critical to find the most effective strategy or multiple strategies before the influenza takes place. Moreover, it is crucial to assess the effectiveness of these countermeasures afterwards since it would provide invaluable information for the future influenza plan. Mathematical modeling is useful for both aims. Using mathematical models, we can simulate how the epidemic would change when we utilize specific countermeasures. Also, we can calibrate it using empirical data and assess the effectiveness of countermeasures which was implemented in the past. The latter approach is especially conducive when we have only data which includes the impact of a variety of countermeasures [7,8]. Assessing the effectiveness of each countermeasure would increase the possibility that we can handle the influenza more efficiently for the future. It was the case of SARS in 2003 where models were built based on past data and appropriate intervention strategies were implemented based on the predictions that the models produced.
- This stud focuses on the case of 2009 Influenza A (H1N1) in the Republic of Korea (hereafter Korea). Influenza A (H1N1), a mutant of swine flu which is known to appear first in Mexico in 2009 and spread to the whole world, has been a serious public health problem as well as social and economic ones throughout the globe [9,10]. In the US, according to CDC, about 600 million people, which amounted up to 20% of total US population, were reportedly to be infected by the influenza. In Korea, after a traveler to Mexico was identified to be infected in April 2009, the number of infected was peaked in November. The Korean health authorities implemented a vaccination program to the hospital personnel from October 27 and expanded the coverage of vaccination to the general public from November 11 [11]. This intervention turned the diffusion trend downward, and the Influenza A (H1N1) was finally declared to be eliminated from Korea in October 2010. The peculiarity of this disease was the high infectious rate of the younger age group and low rate of the older (65 and over) age group [12]. It is believed that the older age group get partially immune when they have experienced Spanish Influenza in the past [13].
- As the case above and others show, when it comes to assessing the effectiveness of countermeasures, the age structure of population should be taken into consideration. It is no wonder because people in different age groups can be justifiably assumed to have different health conditions and different contact rates which come from different social and economic behaviors. There have been many previous researches about the effectiveness of countermeasures include age structures into their models [2,14,15,16,17].
- This study presents a mathematical model with three age groups of the pandemic of Influenza A (H1N1) in 2009. Also, using the incidence data in Korea, we carry out parameter estimations where the best-fitted parameters are sought by the least-square method. The effectiveness of three intervention strategies, which are age-specific vaccination, social distancing, and antiviral treatment, is compared by calculating the basic reproduction number, R0.
Introduction
- 2.1 Influenza pandemic transmission model with age groups
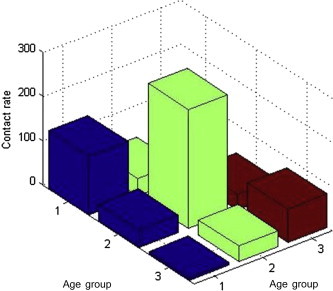
- We integrated the age structure of the Korean population to the influenza transmission model, based on the 2009 Census data [18]. The Korean population was then divided into the following three age groups: Group 1, 0–19 years; Group 2, 20–64 years; and Group 3, ≥65 years. Further, each age group (indexed by i) is classified into eight epidemiological states, namely, susceptibility (Si), effectively vaccinated but not yet protected (Vi), latent (Ei), symptomatic and infectious (Ii), asymptomatic and infectious (Ai), hospitalized (Ji), recovered (Ri), and dead (Di). Susceptible individuals in age group i are exposed to the influenza virus at the force of infection:where
- The force of infection consists of the contact rates
- Latent individuals Ei progress to the infectious class Ii at the rate k (1/k is the mean latent period). Infectious individuals are hospitalized at the age-specific mean rates
- Age-specific parameter values are described in Tables 1 and 2. The population is assumed to be completely susceptible at the beginning of the epidemic. The system of differential equations that describes our influenza transmission model is given by:
(1)
- The basic reproduction number, in the absence of interventions,
Materials and methods
- 3.1 Parameter estimation
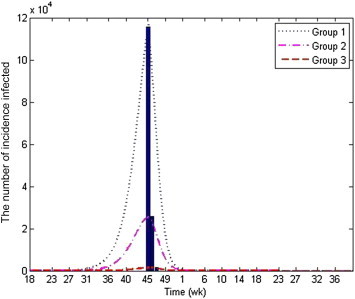
- Using the parameter values estimated through the least-squares method (Tables 1 and 2), the model output is illustrated in Figure 2. In our model, the infected incidence peak number is 115,780 (Group 1) at 44 week. In addition, the number for Group 2 is 25,767 at 45 week and for Group 3 it is 1514 at 44 week (Table 1). Relative error
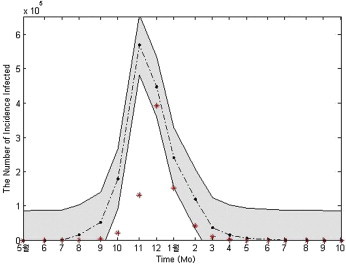
- Figure 3 is described simulation of non-age-groups with estimated parameters. In order to compared with total infected incidence number data per month with our simulation per week, we calculated (about every 4 weeks) the cumulative infection number per week in our model (1). The value of bootstrap method 95% confidence interval was calculated and displayed by resampling 100,000 records. Bootstrap Method determines how accurate our estimation value by the number of times random resampling. Figure 3 shows that influenza data are almost in the 95% confidence interval, so it is explained that our model is reasonable by results of Figure 2 and Figure 3.
- 3.2 Effectiveness of intervention strategies
- Figure 2 presents the result of simulation to find the parameters of our model to fit the data. Then, using this calibrated model, we can evaluate the effectiveness of each control measure (vaccination, social distancing, and antiviral treatment). Parameter values used in simulation are shown in Table 2; parameter values of vaccination are 0.02 (Groups 1 and 3) and 0.03 (Group 2), the parameter value of social distancing is 0.02, and that of antiviral treatment is 0.2 since 46 week.
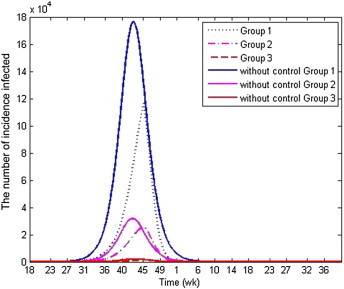
- The effectiveness of intervention strategies is illustrated in Figures 4 and 5. Figure 4 compares the epidemic curves with and without control for each age group where solid curves are the results without controls and dotted curves are the results with controls. The peak of the solid curve (without control) is higher and earlier than the peak of the dotted curve (with control).
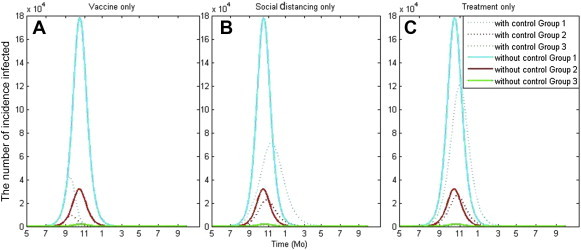
- Figure 5 demonstrates the simulation results when only one intervention strategy is implemented. Figure 5A shows the vaccination-only strategy, Figure 5B for social distancing only, and Figure 5C is for antiviral treatment only. It needs to be noted here that these interventions are implemented two months before the peak, because the effect is not appeared when controls are given one month before the peak. In the vaccination only case, the vaccination level for Group 1 is 0.12 and the ones for other groups are 0.1. The cumulative infected incidence numbers in this case are 1,180,400 (Group 1), 276,400 (Group 2), and 18,200 (Group 3). In the social distancing only case (Figure 5B), the cumulative infected incidence numbers are 1,452,400 (Group 1), 498,000 (Group 2), and 36,800 (Group 3). In addition, in the antiviral treatment only case, the numbers are 1,410,220 (Group 1), 475,700 (Group 2), and 31,800 (Group 3). As can be seen in Figure 5, the infected incidence number is most reduced when the vaccination only strategy was implemented, the next effective was social distancing only, and the antiviral treatment only was the least effective.
Results
- Devising effective countermeasures against influenza is one of the major concerns in public health officials. It is not only for economic cost-effectiveness but also for psychological stableness of people in society. Since it is impossible to conduct experiments on the spread of influenza in real-world settings, mathematical models are of great use to tackle the issue. Its usefulness stretches not only to forward-looking prediction of the future transmission under a variety of conditions but also to backward-looking assessment of combined anti-influenza measures in the past.
- This study presented a mathematical model of Influenza A (H1N1) with age three groups. Parameter estimation is carried out using the least square method to the 2009 pandemic influenza incidence data in Korea. The relative errors of incidence peak were 0.00003, 0.0004, and 0.0013 for each group, and the fit of model with the 95% of confidence which was calculated by the Bootstrap method was given. The basic reproduction number R0 was 1.44 and it reduced to 1.14 after implementation of intensive interventions.
- It was also explored how much influence each control has on the infected incidence. The most successful intervention strategy was vaccination and social distancing followed by antivrial treatment when each of intervention strategy is implemented separately. The most effective intervention would be a mixed strategy which combines vaccination, social distancing and antiviral treatment all together.
- It is suggested that more elaborate age groups need to be incorporated in the model for our future study. Although the present study utilized three age groups, age groups can be more finely subdivided based on a health or social condition. For example, people in their 20s and 50s can be justifiably assumed to have different resistance to influenza. Also, they may have different ways of social interactions and these may have impact on their possibility to be infected. Reflecting this factors and utilizing more elaborate age groups will improve the plausibility of the model and enable us to more accurately assess the effectiveness of countermeasures.
Discussion
- All contributing authors declare no conflicts of interest.
Conflicts of interest
-
This is an Open Access article distributed under the terms of the Creative Commons Attribution Non-Commercial License (http://creativecommons.org/licenses/by-nc/3.0) which permits unrestricted non-commercial use, distribution, and reproduction in any medium, provided the original work is properly cited.
Article information
- 1. Meltzer M.I., Cox N.J., Fukuda K.. The economic impact of pandemic influenza in the United States: Priorities for intervention. Emerg Infect Dis 5(5). 1999;659PMID: 10511522.ArticlePubMedPMC
- 2. Shim E.. Optimal strategies of social distancing and vaccination against seasonal influenza. Math Biosci Eng 10(5–6). 2013;1615PMID: 24245639.ArticlePubMed
- 3. Gasparini R., Amicizia D., Luigi Lai P.. Clinical and socioeconomic impact of seasonal and pandemic influenza in adults and the elderly. Hum Vaccin Immunother 8(1). 2012;21−28. PMID: 22252007.ArticlePubMed
- 4. Keech M., Scott A.J., Ryan P.J.. The impact of influenza and influenza-like illness on productivity and healthcare resource in a working population. Occup Med (Lond) 48:1998;85−90. PMID: 9614766.ArticlePubMed
- 5. Szucs T.D.. Influenza: the role of burden-of-illness research. PharmacoEconomics 16(Suppl 1). 1999;27−32. PMID: 10623373.ArticlePubMed
- 6. Szucs T.D.. Medical economics in the field of influenza: Past, present and future. Virus Res 103:2004;25−30. PMID: 15163484.ArticlePubMed
- 7. Herrera-Valdez M.A., Cruz-Aponte M., Castillo-Chavez C.. Multiple outbreaks for the same pandemic: local transportation and social distancing explain the different “waves” of A-H1N1pdm cases observed in Mexico during 2009. Math Biosci Eng 8(1). 2011;21−48. PMID: 21361398.ArticlePubMed
- 8. Chowell G., Viboud C., Wang X.. Adaptive caccination strategies to mitigate pandemic influenza: Mexico as a case study. PlosOne 4(12). 2009;e8146. Article
- 9. Kim W.J.. Pandemic influenza (H1N1 2009): experience and lessons. Infect Chemother 42(2). 2010;61−63.Article
- 10. Lee D.H., Shin S.S., Jun B.Y.. National level response to pandemic (H1N1) 2009. J Prev Med Public Health 43(2). 2010;99−104. PMID: 20383041.ArticlePubMed
- 11. http://www.cdc.go.kr/CDC/cms/content/68/12468_view.html.
- 12. http://www.cdc.go.kr/CDC/cms/cmsFileDownload.jsp?fid=496&cid=12927&fieldName=attach1&index=1.
- 13. Nah S.Y., Hong J.T., Im J.H.. Variations in number of hospitalized patients with cardiopulmonary diseases associated with 2009 H1N1 pandemic influenza in a tertiary teaching hospital: comparison with seasonal influenza. Infect Chemother 43(5). 2011;390−395.Article
- 14. Lee J., Kim J., Kwon H.D.. Optimal control of an influenza model with seasonal forcing and age structure. J Theor Biol 317:2013;310−320. PMID: 23137836.ArticlePubMed
- 15. Lee S., Golinski M., Chowell G.. Modeling optimal age-specific vaccination strategies against pandemic influenza. B MATH BIOL 74(4). 2012;958−980.Article
- 16. Glasser J., Feng Z., Moylan A.. Mixing in age-structured population models of infectious diseases. Math Biosci 235(1). 2012;1−7. PMID: 22037144.ArticlePubMed
- 17. Cushing J.M.. An introduction to structured population dynamics. CBMS-NSF Regional Conference Series in Applied Mathematics, 71. 1998. SIAM; Philadelphia.
- 18. Korea Centers for Disease Control and Prevention . Study on factors among severe cases and deaths of Influenza A(H1N1) in Korea. 2009. Korea Centers for Disease Control and Prevention; Seoul: [Korean].
References
| Parameters | Description | Value | Refs | |
|---|---|---|---|---|
|
|
Recovery rate for infectious individuals | 7/4 | [1] | |
|
|
Recovery rate for hospitalized individuals | 2.38 | [1] | |
|
|
Rate of progression from latent to infectious individuals | 7/(1.2) | [1] | |
|
|
Relative infectiousness of asymptomatic cases compared with infectious cases | 0.142 | [1] | |
|
|
Probability of transmission per contact |
|
Data fitted | |
|
|
||||
|
|
||||
|
|
Proportion of infected individuals who become symptomatic |
|
Data fitted | |
|
|
||||
|
0.2 |
||||
|
|
Vaccination rate | 40–45 wk | 46+ wk | Data fitted |
| 0 |
|
|||
|
|
||||
|
|
||||
|
|
Social distancing rate |
|
|
Data fitted |
|
|
|
|||
|
|
|
|||
|
|
Antiviral treatment rate for hospitalized individuals |
|
|
Data fitted |
|
|
|
|||
|
|
|
|||
 PubReader
 Cite
Cite


